
Abstract
This study investigates the crystallization and phase transition behavior of the amorphous metallic alloy Au70Cu5.5Ag7.5Si17. This alloy has been recently shown to exhibit a transition of a metastable to a more stable crystalline state, occurring via metastable melting under strong non-equilibrium conditions. Such behavior had so far not been observed in other metallic alloys. In this investigation fast differential scanning calorimetry (FDSC) is used to explore crystallization and the solid–liquid–solid transition upon linear heating and during isothermal annealing, as a function of the conditions under which the metastable phase is formed. It is shown that the occurrence of the solid–liquid–solid transformation in FDSC depends on the initial conditions; this is explained by a history-dependent nucleation of the stable crystalline phase. The microstructure was investigated by scanning and transmission electron microscopy and x-ray diffraction. Chemical mapping was performed by energy dispersive x-ray spectrometry. The relationship between the microstructure and the phase transitions observed in FSDC is discussed with respect to the possible kinetic paths of the solid–liquid–solid transition, which is a typical phenomenon in monotropic polymorphism.
Export citation and abstract BibTeX RIS

Original content from this work may be used under the terms of the Creative Commons Attribution 3.0 licence. Any further distribution of this work must maintain attribution to the author(s) and the title of the work, journal citation and DOI.
1. Introduction
Because material properties strongly depend on the stability of their solid phases, a major topic in materials science is the study of phase transitions and, more to the point, polymorphism. Well-known examples are the transition from graphite to diamond [1] or the hardening of steels [2]. The science of solid–solid transitions also influences other fields. The phase changes of certain minerals have been linked to deep earthquakes [3], and a change in the polymorphic modification of pharmaceutical substances influences their bioavailability [4]. The analysis of different solid phases even led Otto Lehmann, around 140 years ago, to distinguish between enantiotropic and monotropic systems [5, 6]. The stability range and transition temperatures of the different polymorphs are often discussed in terms of the Gibbs free energy [7, 8]. In enantiotropic systems each solid phase has a certain temperature range in which the respective phase is stable, while monotropic systems present, among many solid phases, only one that is stable at all temperatures. During heating of enantiotropic systems the lower temperature phase becomes unstable and transforms into the higher temperature phase. The transformation is a direct solid–solid transition. This is the typical situation in polymorphic metals [9, 10]. In polymorphic molecular crystals, however, monotropic systems are more common [11]. In such systems, metastable phases can coexist with the most stable phase (with a minimum Gibbs free energy) and there is no defined transition between the solid phases. The melting temperatures of the metastable phases are lower than that of the stable phase. The transition of the metastable solid phase to the more stable phase can occur along two pathways:
- a direct exothermic solid–solid transition in a relatively wide temperature range;
- the melting of the metastable phase and subsequent crystallization of the supercooled liquid into the stable phase.
In the latter case the crystallization of the supercooled liquid in the stable phase depends on kinetic conditions. Long known in molecular crystals, such a solid–liquid–solid transition was recently also suggested for atomic crystals [12]. The probability of the formation of metastable monotropic solid phases increases with increased supercooling. Thus we expect monotropic polymorphism in atomic crystals at high supercooling—and hence bulk metallic glass (BMG) forming alloys are a promising class of materials because of their relatively low critical cooling rate for glass formation [13, 14].
We recently showed for the first time, using a gold-based BMG alloy, that a solid–solid transition in metals can occur via the formation of a metastable liquid upon heating [15]. Note that a high-pressure crystalline phase of pure bismuth was recently demonstrated to melt into a metastable liquid below equilibrium melting via decompression, which links our work also to the pressure path [16]. However, on the more common temperature path the rapid transition kinetics, requires FDSC to study the solid–liquid–solid transition; this procedure was rendered technically possible only recently [17–20]. Various metallic systems enable the in situ exploration of the glass formation and crystallization behavior in the whole supercooled liquid region via FDSC [20–28]. In the Au70Cu5.5Ag7.5Si17 BMG a major metastable crystalline phase was suggested to form after heating from the glassy state, although no microstructural details had been reported so far [15]. We showed that this metastable crystalline phase can transform to a more stable crystalline state (which had also not yet been microstructurally investigated) via the formation of a metastable liquid [15]. The transformation path starting from the amorphous state is as follows: glass → undercooled liquid → metastable crystalline state → metastable liquid → more 'stable' crystalline state → equilibrium liquid. Besides the fundamental novelty of this solid–solid transformation, Au-based metallic glasses are interesting because of their potential application as material for small-scale devices (e.g. micro-electro-mechanical systems, micro-robotics, micro-manipulators) [29, 30]. This is due to their excellent material properties, viscous flow workability in the supercooled liquid region and homogeneity and isotropy at small scales [14, 31–33]. Various production techniques for small-scale devices have recently been successfully tested on metallic glasses [29, 30, 34].
This paper investigates the solid–liquid–solid transition of Au70Cu5.5Ag7.5Si17, with an insight into the microstructure provided by scanning and transmission electron microscopy (SEM, TEM), x-ray diffraction (XRD), and chemical mapping at the nanometer level using energy dispersive x-ray spectroscopy. It also discusses the relationship between calorimetric measurements and microstructural features, with particular focus on the conditions governing the occurrence of different phases with respect to the prior thermal route.
2. Experimental
2.1. Materials
The elements Au (purity 99.99 wt.%), Ag (99.99 wt.%), Si (99.999 wt.%) and Cu (99.995%) were weighed according to the atomic composition Au70Cu5.5Ag7.5Si17 and fused via induction melting in sealed quartz glass tubes under high purity (5N) Ar atmosphere. The quenched pre-alloy was processed in a melt spinner to thin and chemically homogenous amorphous ribbons of ~30 µm thickness.
2.2. Calorimetry
FDSC measurements were performed with a power-compensated Mettler-Toledo Flash-DSC 1, equipped with a conditioned and temperature-corrected MultiSTAR UFS1 sensor, which enables for a time constant in the millisecond region [35]. The sample support temperature was set to 183 K. All measurements were conducted under high purity (5N) Ar atmosphere at a flow rate of 10 ml min−1. FDSC samples were prepared by cutting the melt-spun ribbons under a stereomicroscope to small pieces of ~50 × 50 µm2 to ~200 × 200 µm2 with a weight of 1–5 µg. For all experiments, the temperature of the samples was varied between 298 K and 748 K. The exact time–temperature regimes used are displayed in the corresponding heat-flow figures. Reproducibility was guaranteed by running a standard thermal cycle at the beginning and end of each measurement series. Conventional differential scanning calorimetry was performed with a Mettler-Toledo DSC1. These heating measurements were performed at 0.16 K s−1 using 40 µl aluminum crucibles and Ar flow of 30 ml min−1.
2.3. Characterization
The microstructure was investigated using electron microscopy and XRD. The local chemical composition was obtained by energy dispersive x-ray spectroscopy (EDS) in the electron microscopes. A Hitachi SU-70 SEM operated at 25 kV for high contrast in backscattered electron mode (BSE) was used, equipped with an X-max detector (Oxford Instruments) for the EDS analyses. Small-scale FDSC specimens were removed from the sensor with an electrostatic hair and placed on top of a polymethylmethacrylate holder coated with a thin film of instant adhesive. This procedure allowed manual grinding and polishing of the micrometric specimens in the following steps: grinding/polishing using 4000 SiC sandpaper with distilled water as a lubricant; ditto using 1 µm diamond particles and glycerin as lubricants; ditto using 0.05 µm Al2O3-particles with distilled water as a lubricant. Each step was perpendicular to the previous. In order to prevent charging of the sample holder during SEM examination, the setup was coated with a conductive layer of graphite about 5 nm in thickness.
TEM was performed using an FEI Tecnai TALOS F200X equipped with a field-emission gun and operated at 200 kV. Chemical analyses in the TEM were performed with an FEI super EDS detector, which has a collection angle of 0.7 srad and is driven by Bruker Esprit software. TEM lamellas were prepared by focused ion beam (FIB) from the samples directly on the FDSC sensor, using a FIB/SEM FEI HELIOS 600i.
XRD was performed on a Stoe STADI x-ray diffractometer and data were analyzed using the software package X'Pert HighScore Plus from PANanalytical B.V.
3. Results and discussion
3.1. Linear heating
Figure 1 shows heat-flow curves as a function of temperature of the metallic glass Au70Cu5.5Ag7.5Si17 measured by FDSC upon heating at rates between 80 K s−1 and 3000 K s−1. Previously, these specimens had been amorphized in situ in FDSC via rapid cooling from 746 K with a rate of 5000 K s−1. The inserts illustrate the applied temperature–time programs. At low rates (shown from 80 K s−1) a glass transition and several exothermic events as well as melting can be seen. The two major exothermic events are believed to correspond to the formation of crystals from the supercooled liquid and the transition from a metastable to a more stable crystalline state [15]. However, these peaks are divided into sub-peaks, which might be attributed to different phases or simply different nucleation sites of the same phase [36]. This result appears to be similar to those reported for Au70Cu5.5Ag7.5Si17 measured via conventional DSC [37]. At higher heating rates (~500 K s−1), however, an endothermic effect occurs before the second exothermic event sets in. This has been shown to be the melting of the metastable crystalline state [15], just before the transition to a more stable crystalline state occurs, which melts at an even higher temperature. At several rates (e.g. 1000 K s−1) the melting of the metastable crystalline state overlaps with the formation of the more stable crystalline state. At higher heating rates (3000 K s−1), there is not sufficient time for the full formation of the more stable crystalline state, so that mainly the liquid phase is observed after the melting of the metastable crystalline phase. Such behavior is also typical of monotropic molecular crystals, but at significantly lower heating rates than seen here due to molecular dynamics [38] which are slower than the atomic ones in metals.
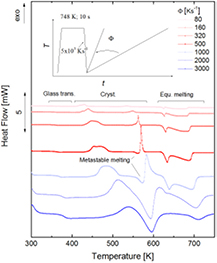
Figure 1. Heat flow of Au70Cu5.5Ag7.5Si17 obtained by fast differential scanning calorimetry (FDSC) as a function of temperature and heating rates (indicated in the graph). The figure reveals the various phase transitions of glass transition, crystallization, polymorphic transition or melting.
Download figure:
Standard image High-resolution image3.2. Isothermal annealing
Figure 2(a) shows the TTT map of Au70Cu5.5Ag7.5Si17 upon cooling, as derived from isothermal FDSC measurements. The melt was cooled at a rate of 5000 K s−1 to the crystallization temperature and held there for 10 s while the heat flow was measured. Because the onset times of the crystallization peaks could not be determined at all temperatures due to the limited time resolution, the times to the crystallization peaks were used to generate the TTT map. Note that crystallization generally requires undercooling as a driving force, such that the temperatures where crystallization occurs are lower than the melting of the corresponding phases [39].

Figure 2. Isothermal crystallization behavior of undercooled Au70Cu5.5Ag7.5Si17. (a) Time–temperature–transformation (TTT) diagram upon cooling and (b) representative isothermal heat-flow curves at different temperatures with the applied temperature ramp given in the insert.
Download figure:
Standard image High-resolution imageFor the low-temperature region, a clear C-curve can be constructed (figure 2(a)), typical of metallic glasses [21, 40]. Crystallization at high temperatures shows a second C-curve type of behavior. We attribute this to the stable crystalline state possible in Au70Cu5.5Ag7.5Si17 [15]. However, there is also a region (510 K < T < 540 K) where the transitions overlap (see 518 K in figure 2(b)). In this temperature region, a sharp second peak is observed in the heat-flow curve immediately after a broad peak. We interpret the broad peaks as resulting from the heterogeneous nucleated crystallization of the stable phase, while the sharp peaks result from the homogeneous nucleated crystallization of the metastable phase. Because the undercooling for the metastable crystalline state is low there (the onset of melting for the metastable crystalline state is around 558 K; see [15]) and the nucleation rate of these phase is low, the second sharp peak at 518 K is expected to result from the nucleation of the metastable crystalline state. This is indicated by the large error bars in time, typical for stochastic nucleation events. However, it seems that another minor third process occurs between these major events, because the TTT map in the intermediate temperature range between the low- and high-temperature C-curve exhibits an acceleration of the two processes. However, the exact reason for this behavior cannot be deduced from the TTT plot only.
3.3. Influence of the conditions under which the metastable phase is formed
In this section we examine the influence of rate on the formation of the metastable crystalline state. In particular, we investigate the effects of the different heating and cooling rates by which the metastable crystalline state is formed in the solid–liquid–solid transition.
The heat-flow measurements shown in figure 3 were conducted after the metastable crystalline state was formed by heating at 100 K s−1 to 473 K, which is right above the peak corresponding to the metastable crystalline state (compare with figure 1). Metastable melting at 558 K becomes only slightly visible at heating rates of approximately 1500 K s−1, while simple linear heating detection of the effect is already possible at about 500 K s−1 (compare with figure 1). At a heating rate of 5000 K s−1 the formation of the stable crystalline state can still be seen, while by simple linear heating above 3000 K s−1 the stable crystalline state is no longer formed (figure 1). Note that in figure 3 the shape and position of the peaks are slightly smeared at high rates by the thermal lag of the FDSC setup, which is typically 1 ms [41].
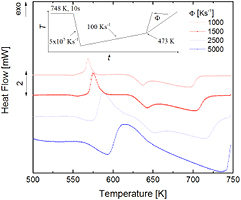
Figure 3. Heat flow in Au70Cu5.5Ag7.5Si17 upon heating at rates of 1000 K s−1 to 5000 K s−1, after the metastable crystalline state was formed by heating to 473 K at heating rates of 100 K s−1. Only the temperature region of interest is shown (500 K–750 K).
Download figure:
Standard image High-resolution imageFor the heat-flow measurements shown in figure 4, the metastable crystalline state was produced by heating to 553 K at a high rate of 2000 K s−1. This state was quenched-in at a cooling rate of 5000 K s−1. Note that it was not possible to directly heat from 553 K any further for device-specific controllability reasons. When compared to figure 3, it appears that the formation of the metastable liquid and the crystallization of the more stable crystalline phase is already dominant at 500 K s−1.
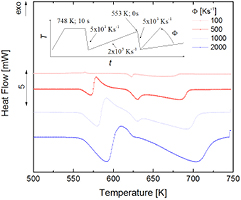
Figure 4. Heat flow in Au70Cu5.5Ag7.5Si17 upon heating at rates of 100 K s−1 to 2000 K s−1, after the metastable crystalline state was formed at 553 K at heating rates of 2000 K s−1 (plus quenching at 5000 K s−1). Only the temperature region of interest is shown (500 K–750 K).
Download figure:
Standard image High-resolution imageThe effect of the heating rate on the metastable state and on the detection of the solid–liquid–solid transition (i.e. the formation of the metastable liquid) can be explained by kinetic effects. A general interpretation of the phenomenon might draw on the assumption that a higher number density of nuclei for the transformation from the metastable to the stable crystalline state formed at lower heating rates, due to the longer time in the temperature region of the maximum of the nucleation rate, which always appears at a lower temperature than the maximum in the growth rate [42]. A second possible interpretation may, however, be linked to a heterogeneous nucleation effect [43] for the formation of the stable crystalline state, provided that another third minor phase has formed previously at low rates. This is supported by figures 2 and 6, where a minor intermediate thermal event is suggested.
Figure 5 presents the influence of the cooling rate (from 10 K s−1 to 5000 K s−1) of the equilibrium melt on the material behavior upon subsequent heating at 2000 K s−1. For the low cooling rate of 10 K s−1 the crystalline phase presents a single transition, here a melting, in the subsequent heating run. It is concluded that upon slow cooling < 10 K s−1 only the stable crystalline phase has formed. By increasing the initial cooling rate, formation of the metastable liquid upon heating starts to occur. No glass transition is visible at this stage, indicating a fully crystalline state that includes both the metastable and stable configurations. Beyond a cooling of 300 K s−1 a glass transition occurs; the formation of the metastable crystalline state appears in the subsequent heating curve and the quenched material consists of metastable, stable and amorphous parts. Note that the critical cooling rate for producing fully amorphous samples of Au70Cu5.5Ag7.5Si17 in FDSC was found to be 1800 K s−1 [22]. This corresponds to the results in figure 5.
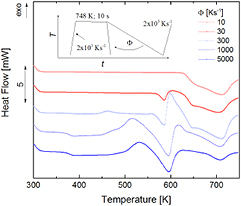
Figure 5. Heat flow in Au70Cu5.5Ag7.5Si17 upon heating at 2000 K s−1, as a function of the prior cooling rate (10 K s−1 to 5000 K s−1) with which the melt was quenched.
Download figure:
Standard image High-resolution imageIn this section, it was demonstrated that the detection of the solid–liquid–solid transformation phenomena in FDSC depends on the conditions under which the metastable phase is formed. The transition temperature from the metastable to the stable crystalline state, which simply reflects transition kinetics, depends on the conditions at which the metastable state has formed (i.e. increasing heating rates for the formation shifts the transition to higher temperatures and vice versa). Note that such behavior is typical of monotropic transitions, for which the transition temperature strongly depends on kinetics. A potential explanation, besides the above-mentioned general assumption that more nuclei for the stable state are created at lower heating rates, lies in the effect of a potential additional intermediate phase, with minor volume fraction. This is partially indicated by the TTT diagram, but a full interpretation is not possible from these FDSC data only. The next section thus aims to gain an insight into the general microstructure and to further clarify the kinetic effect that influences the detectability of the solid–liquid transition.
3.4. Microstructure of small-scale quenched FDSC samples
Figures 6–8 provide micrographs of the microstructure and the corresponding heat-flow response for the samples prepared via FDSC. SEM images were taken in BSE mode after quenching a distinct state corresponding to a particular temperature, indicated by the red cooling curves in the temperature ramp schematics in the corresponding figures. Note that the curvature of the red curve upon quenching results from the performance limit achieved by the FDSC device for cooling at a rate of 5000 K s−1. For figure 6 the material was quenched from 513 K, after the formation of the metastable crystalline state. Darker and brighter regions in the SEM BSE image indicate variations in the elemental distribution (figure 6(b)). At first glance the microstructure may be interpreted as sub-micrometer grains (brighter regions) interspaced by a curvilinear phase consisting of lighter elements (darker regions). However, the curvature of those curvilinear features is not typical of grain boundaries. Figure 6(c) presents a bright-field (BF) TEM micrograph and the corresponding selected-area diffraction pattern (SADP) of the microstructure of the metastable state for Au70Cu5.5Ag7.5Si17 on a FIB extracted lamella. The SADP appears to be rather constant over the whole area present in this BF TEM micrograph, despite the presence of the curvilinear features. (Note that determination of the corresponding crystal structure is beyond the scope of this work.) The SADP analysis indicates that the compositionally enriched zones shown in figure 6(b) are actually present within a single crystalline grain, which is a very interesting microstructure and to the authors' knowledge not known for other metallic systems. Indeed, the whole FIB lamella seems to consist of a single grain. Because of the small size of the curvilinear features no quantitative chemical result could be generated from SEM energy-dispersive x-ray spectroscopy (EDX). STEM EDS elemental mapping was thus used on the FIB lamella extracted (figure 6(d)). The derived maps clearly reveal that the dark curvilinear regions in SEM are enriched in Si and depleted in Au, Cu, and Ag. The brighter regions in SEM are enriched in Ag, Cu, and Au. Note that Au is also present in the Si-rich dark regions. Interestingly, Ag also forms some more strongly enriched zones in these wavy structures. These zones may correspond to a minor intermediate phase responsible for the sensitivity of the system to the conditions under which the metastable phase is formed for the detection of the solid–liquid–solid transition. As mentioned above, they may form to a larger extent at lower heating rates, which in turn accelerates the formation of the stable phase and shifts the occurrence of the solid–liquid–solid transition to lower temperatures by triggering the formation of the stable phase. They may also form isothermally in the intermediate temperature range between the metastable and stable crystalline states and thus facilitate their formation from the undercooled liquid.
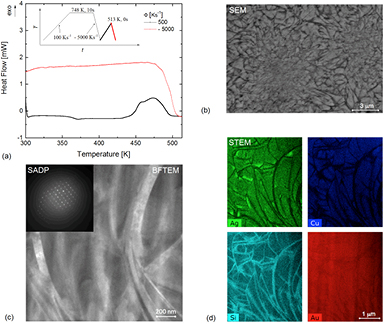
Figure 6. (a) FDSC heat-flow curves for Au70Cu5.5Ag7.5Si17 upon heating to 513 K with a rate of 500 K s−1 and quenching at a rate of 5000 K s−1. The insert shows the temperature ramp used for the preparation of the metastable crystalline state investigated by (b) SEM BSE imaging, (c) BFTEM and SADP, and (d) STEM EDS mapping.
Download figure:
Standard image High-resolution image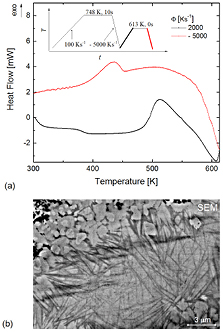
Figure 7. (a) FDSC heat-flow curves for Au70Cu5.5Ag7.5Si17 upon heating to 613 K with a rate of 2000 K s−1 and quenching at a rate of 5000 K s−1. The insert shows the temperature ramp used for the preparation of the quenched metastable liquid state investigated by (b) SEM BSE imaging.
Download figure:
Standard image High-resolution image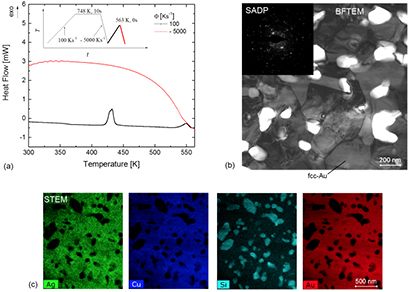
Figure 8. (a) FDSC heat-flow curves for Au70Cu5.5Ag7.5Si17 upon heating to 563 K with a rate of 100 K s−1 and quenching at a rate of 5000 K s−1. The insert shows the temperature ramp used for the preparation of the stable crystalline state investigated by (b) BFTEM and SADP, and (c) STEM EDS mapping.
Download figure:
Standard image High-resolution imageFigure 7 presents an SEM BSE micrograph after quenching from the metastable liquid region (613 K) to room temperature. It is not possible to avoid crystallization during quenching (red line in figure 7(a)), because the required cooling rate to avoid crystallization cannot be achieved in FDSC. Contrary to figure 6, the Z contrast is much stronger in this SEM BSE micrograph. This indicates a greater difference in composition, which is reasonable because the sample has been exposed to higher annealing temperature and time, and is expected to be closer to the decomposed thermodynamic equilibrium condition. There are particles with strong dark contrast, which are richer in silicon and may have evolved from the dark entangled elongated regions revealed in figure 6. There are also bright parts which may have formed from the brighter parts seen in figure 6. Additionally, a rod-like wavy structure is found, which has a contrast comparable to that in figure 6 and may be a metastable crystalline state formed during quenching from the metastable liquid.
Figure 8 presents the material that was quenched from 563 K, after the formation of the stable crystalline state. Figure 8(b) shows a BF TEM micrograph and the corresponding SADP of the microstructure of the stable crystalline state for Au70Cu5.5Ag7.5Si17. This microstructure consists of ultrafine-grained fcc-Au crystals and structurally unidentified precipitates. STEM EDS mapping from an FIB extracted lamella clearly indicates that the precipitates are rich in Si and depleted in Au, Cu, and Ag.
3.5. Microstructure of conventional DSC samples
In order to compare the results from FDSC to those of DSC at lower heating rates, the microstructure of water-quenched samples from conventional DSC measurements was investigated (figure 9). Although the peak temperatures are lower due to the lower heating rate, the heat-flow curve in figure 9 appears comparable to that obtained by FDSC (figure 1). Interestingly, a small intermediate event between the peaks for metastable and stable state formation can be seen, which may correlate with the minor intermediate phase described previously.
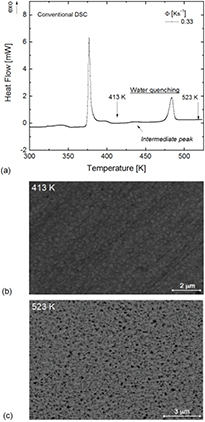
Figure 9. (a) Conventional DSC heat-flow curve of Au70Cu5.5Ag7.5Si17 measured with a heating rate of 0.33 K s−1. SEM BSE micrograph of (b) the metastable crystalline state obtained by water quenching from 413 K and (c) the stable crystalline state obtained by water quenching from 523 K.
Download figure:
Standard image High-resolution imageSimilar to the metastable crystalline state produced via FDSC, the microstructural investigation via SEM reveals a weak Z-contrast (figure 9(b)). Nevertheless, the microstructure appears somewhat different and more like a uniform ultrafine-grained material with zones enriched in Si at the grain boundaries. The microstructure of the stable crystalline state is shown in figure 9(c). The evolution towards stronger Z contrast can be seen clearly. An SEM EDX analysis revealed that the darker regions are enriched in Si. Si enrichment gets indeed stronger with higher annealing temperature (compare figures 6 and 8), but the particles are too small to be quantified in their composition via SEM.
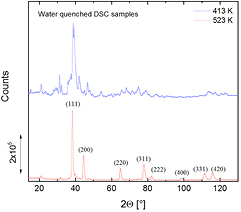
Although there may be differences compared to FDSC, the samples from conventional DSC were investigated by XRD after the formation of the expected metastable and stable crystalline states, because on such samples the XRD measurements can be performed more easily than on the small-scaled FDSC samples (figure 10). There are clear differences in the main peaks for the metastable and stable crystalline states, which reveal a different microstructure. Unfortunately, the reflections could not be indexed for the expected metastable crystalline state according to the X'Pert HighScore Plus database (as was also the case for the TEM sample in figure 6). For the stable crystalline state the material is close to a strongly supersaturated fcc-Au solid solution, but there are a few unidentified smaller peaks, which may result from the Si-enriched particles revealed in figure 9. Note that there are strong similarities in the microstructures of the stable state produced via DSC and FDSC.
Figure 10. XRD patterns of the metastable and stable crystalline states produced by water-quenching of conventional DSC samples.
Download figure:
Standard image High-resolution image
4. Summary and conclusions
In this work we used FDSC to study the occurrence of monotropic polymorphism in the gold-based metallic glass-former Au70Cu5.5Ag7.5Si17. Upon heating, the amorphous Au70Cu5.5Ag7.5Si17 transforms during the glass transition into a supercooled liquid, which crystallizes to a metastable crystalline phase at high supercooling (figure 1). Within a certain heating-rate range this metastable crystalline phase undergoes the characteristic monotropic transition path [38]: metastable crystalline state → metastable liquid → stable crystalline state → equilibrium liquid [15]. At slower heating rates only crystallization occurs. At increasing heating rates, melting of the metastable phase and subsequent crystallization may occur in the same temperature range. Therefore, and because of the lower melting enthalpy of the metastable phase, the exothermal crystallization of the stable phase can mask the endothermic melting process. At faster heating rates, however, the crystallization of the stable phase is shifted to higher temperatures and the two processes are well separated. At even faster heating the formation of the stable crystalline phase can be suppressed. The existence of the two phases is also reflected in a double C-curve in a TTT diagram upon cooling (figure 2).
We explored the effect of different thermal histories on this transformation behavior in situ. It appears that the detectability of the solid–liquid–solid transformation in the monotropic polymorphic Au-based system depends on the conditions under which the metastable phase is formed. If the metastable state is formed at a low heating rate in FDSC the transition to the stable crystalline state takes place at lower temperatures, and vice versa. Such behavior is typical for monotropic transitions, because the transformation is kinetically controlled. We expect the reason for the thermal-history impact on the detectability of the solid–liquid–solid transition to lie in the nucleation stage of the stable crystalline phase. Either the formation of a denser distribution of nuclei or the formation of a minor intermediate phase at low heating rates may trigger the transition from the metastable to the stable phase. This causes a shift in temperature of the kinetic conditions at which the solid–liquid–solid transition can occur.
A microstructural analysis of small-scale FDSC samples revealed that the metastable crystalline state exhibits large unidentified single-crystalline regions presenting crystallographically coherent, large and entangled curvilinear inclusions, enriched in Si and depleted in Ag, Au and Cu. Apart from this interesting microstructure, nanometric zones enriched in Ag were also found, which indicates the formation of a minor intermediate phase that forms depending on the initial heating rate. Because this phase may trigger the formation of the stable phase, it can explain the impact of the conditions under which the metastable phase is formed on the detectability of the solid–liquid–solid transformation. The microstructural investigation also reveals that the stable crystalline state is crystallographically different from the unidentified metastable state. The stable crystalline state consists of supersaturated fcc-Au crystals and a dispersion of unidentified Si-enriched particles.
Acknowledgments
Support by the Swiss National Science Foundation (SNF Grant No. 200020-135100) is gratefully acknowledged. ScopeM of ETH Zurich is acknowledged for the overall use of its facility. This project has received funding from the European Research Council (ERC) under the European Union's Horizon 2020 research and innovation programme (grant agreement No. 757961).