

Abstract
Searching for the ground state of a kagomé Heisenberg antiferromagnet (KHA) has been one of the central issues of condensed-matter physics, because the KHA is expected to host spin-liquid phases with exotic elementary excitations. Here, we show our longitudinal ( ) and transverse (
 ) thermal conductivities measurements of the two kagomé materials, volborthite and Ca kapellasite. Although magnetic orders appear at temperatures much lower than the antiferromagnetic energy scale in both materials, the nature of spin liquids can be captured above the transition temperatures. The temperature and field dependence of
  is analyzed by spin and phonon contributions, and large sample variations of the spin contribution are found in volborthite. Clear changes in
  are observed at the multiple magnetic transitions in volborthite, showing different magnetic thermal conduction in different magnetic structures. These magnetic contributions are not clearly observed in low-
 crystals of volborthite, and are almost absent in Ca kapellasite, showing the high sensitivity of the magnetic excitation in
  to the defects in crystals. On the other hand, a clear thermal Hall signal has been observed in the lowest-
 crystal of volborthite and in Ca kapellasite. Remarkably, both the temperature dependence and the magnitude of
  of volborthite are found to be very similar to those of Ca kapellasite, despite of about an order of magnitude difference in
  We find that
  of both compounds is well reproduced, both qualitatively and quantitatively, by spin excitations described by the Schwinger-boson mean-field theory applied to KHA with the Dzyaloshinskii–Moriya interaction. This excellent agreement demonstrates not only that the thermal Hall effect in these kagomé antiferromagnets is caused by spins in the spin liquid phase, but also that the elementary excitations of this spin liquid phase are well described by the bosonic spin excitations.
Export citation and abstract BibTeX RIS
1. Introduction
A kagomé structure consists of the corner-sharing network of triangles (figure 1(a)). Although this structure has been used as a woven pattern of Japanese bamboo baskets since ancient times, it is quite recently that the magnetic ground state realized in a kagomé structure started to attract tremendous attention in physics.

Figure 1. An illustration of kagomé (a) and triangular lattice (b). The purple arrows indicate the spins.
Download figure:
Standard image High-resolution imageThe focus of the scientific interest is whether a quantum disordered state of spins, termed as a quantum spin liquid (QSL [1]), is realized for antiferromagnetic Heisenberg spins of  on a kagomé lattice, and, if it is the case, what kind of a QSL emerges.
The reason why a kagomé structure is promising to realize a QSL is the strong effect of the geometrical frustration caused by the corner-sharing network of the triangles. This geometrical frustration enhances the quantum fluctuations of the constituting spins, giving rise to a melting of magnetic long-ranged ordered states by the enhanced quantum fluctuations even at the absolute zero temperature. In fact, no magnetic ordered state has been found in kagomé even in the large-scale numerical simulations [2]. This is in sharp contrast to a less-frustrated triangular lattice (figure 1(b)) where the 120° ordered state is known to be stabilized [3, 4].
A variety of QSLs have been suggested as the ground state in the kagomé Heisenberg antiferromagnet (KHA), including the resonating-valence-bond state [5], Z2 spin liquids [2, 6, 7], chiral spin liquids [8], fermionic spin liquids [9], and Dirac spin liquids [10, 11]. The key to clarify the ground state is to reveal the elementary excitation by experiments in candidate materials, because these different QSLs are characterized by different quasiparticles.
How can we find these elementary exicatations by experiments? The magnetic excitations in QSLs have been studied by thermodynamic measurements and by spectoscopies such as NMR, µSR, and neutrons. These are direct and powerful methods, but are often obscured by impurity effects that can become dominant at low temperatures.
Recently, thermal-transport measurements have attracted attention to clarify the low-lying spin excitations. In magnetic insulators, not only phonons but also magnetic excitations can transport heat, which have been observed in various low-dimensional quantum magnets [12–14]. There are several advantages in thermal-transport measurements to study the low-lying spin excitations. First, the thermal conductivity ( ) is exclusively sensitive to itinerant excitations. One can thus avoid the effects of localized excitations by impurities even at very low temperatures. Second,
  directly reflects the mean free path of the elementary excitations. Therefore, one can estimate the quality of the sample by the magnitude of
  . Third, because thermal conductivity measurement is a directional probe, one can study the anisotropy of the low-lying excitation by measuring
  along different directions. Finally, by applying a magnetic field, one can measure the thermal Hall conductivity (
 ) which reflects further details of the low-lying excitation such as the Berry phase.
In particular, thermal Hall measurements have attracted increasing attention as a very powerful probe to reveal the elementary excitation in spin liquids [15, 16]. A thermal Hall effect (THE) is usually caused by the Lorentz force acting on the mobile electrons in a metal, which is known as the Righi-Leduc effect. Therefore, no THE is expected in an insulating QSL candidate material. However, even for charge neutral excitations, it has been shown that a Hall effect occurs in analog to the anomalous Hall effect [17, 18]. In an insulator, this Hall effect is observed by the transverse thermal gradient in response to an applied heat current, i.e. THE. As discussed below,  is given by the relation
where  is the distribution function of the elementary excitations and
  is the Berry curvature. Therefore,
  reflects the detail of the elementary excitation, for example, bosons or fermions, and the band structure.
In fact, the THEs have been observed in insulating ferromagnets [19–21] as a magnon Hall effect. In these ferromagnets, the Dzyaloshinskii–Moriya (DM) interaction provides a Berry curvature on the magnon bands, giving rise to a THE given by equation (1). THEs in insulators have also been observed in various materials, for example  of quantum spins in the QSL candidate Tb2Ti2O7 [22],
  of itinerant Majorana fermions in the Kitaev material α-RuCl3 [23–25],
  of phonons in Tb3Ga5O12 [26] and Ba3CuSb2O9 [27], and
  in the cuprates [28]. THEs of charge neutral excitations have also been actively studied theoretically from magnon THE in antiferromagnets [29, 30] to triplon THE [31], quantized THE in the Kitaev QSL [32, 33], non-quantized THE of Schwinger bosons [34], fermionic U(1) spin liquids [35, 36] and gapless Dirac QSL [37].
In this article, we introduce our thermal-transport measurements of kagomé materials, volborthite [38] and Ca kapellasite [39]. In both compounds, the magnetic ground state is not a disordered state. However, the Néel temperature  is suppressed well below the temperature corresponding to the spin interaction energy
  , providing a wide temperature range of a spin liquid state (
 ) to study the elementary excitations.
First, we shall show the spin thermal conduction from the measurements of the longitudinal thermal conductivity,  [15, 16]. We find that the spin contribution becomes bigger in crystals with higher
  , showing that spin thermal conduction is easily suppressed by defects in crystals. In high-quality crystals of volborthite, clear changes in the magnetic thermal conduction are observed at the multiple magnetic transitions in volborthite.
We then report our successful measurements of  both in volborthite [15] and Ca kapellasite [16]. In a sharp contrast to the case of
  , crystals with smaller
  are better to measure
  because of larger transverse temperature difference (see equation (3)). However,
  is similar in volborthite and in Ca kapellasite despite the very different magnitude of
  , showing that
  does not depend on the degree of the defects. Remarkably, we find that our numerical calculations by the Schwinger-boson mean field theory well reproduce the observed
  both qualitatively and quantitatively, suggesting that the elementary excitations in these kagomé materials are well described by bosonic spin excitations [6, 16, 40].
2. Experimental setup
Figure 2 shows pictures of our thermal-transport measurement probe and a schematic of setup. A heat current ( ) and a magnetic field (
 ) are applied within the
  plane and along the
  axis of the sample, respectively. Three thermometers (Cernox™ (CX-1050) thermometers for measurements above 2 K and RuO2 thermometers below 2 K) and one heater are attached to the sample so that both longitudinal (
 ) and transverse (
 ) thermal differences can be measured simultaneously (figure 2(a)). All thermometers were carefully calibrated in magnetic fields by a calibrated thermometer placed outside the magnetic field. We confirmed that the magnetoresistance of all the Cernox thermometers are identical to the previous work [41] within our resolution.

Figure 2. (a) A schematic drawing of setup. A sample is fixed to the LiF heat bath by Apiezon grease to avoid background thermal Hall signal. (b) A single crystal of volborthite before detwinning. (c) A setup picture of the thermal-transport measurement. (d) A schematic of Cu2+ ions of volborthite. The four spin interactions ( ,
,  ,
,  ,
,  ) are shown. (e) A
  –
– phase diagram of volborthite. Phase boundaries are determined from the heat capacity measurements (solid circles and triangles from [44]). (f) The temperature dependence of
  (left) and
  (right). The heat capacity at zero field is almost the same with that of the previous report (grey circles from [43]). The lattice contribution in
  is taken from [42].
Download figure:
Standard image High-resolution imageThe longitudinal thermal conductivity,  , and the thermal Hall conductivity,
  , are obtained by
where  is the thickness of the sample and
  (
( ) is the distance between the thermal contacts for
  and
and  (
( and
and  ), respectively. To cancel the longitudinal response in
  owing to misalignment of the contacts, the asymmetric component with respect to the field direction is estimated as
  . To measure a small thermal Hall signal from an insulator, we carefully checked the background Hall signal from the measurement cell as described in the supplementary material6 (stacks.iop.org/JPhysCM/32/074001/mmedia).
An experimental requirement to measure  is if
is if  is larger than the resolution limit of the thermometer (typically
  for CX-1050). From equation (2),
  is given by
Therefore, for a given  , requirements to resolve
  are
are
- 1.A thinner sample with smaller
 is better.
 - 2.Applying as large as possible is important. Because the maximum of is often limited by the increase of the sample temperature above the base temperature, reducing the thermal resistance between the sample and the heat bath is necessary.


3. Volborthite
Volborthite, Cu3V2O7(OH)2·2H2O, is a green transparent insulator (figure 2(b)) in which Cu2+ ions form a two dimensional distorted kagomé structure with inequivalent exchange interactions (figure 2(d)). The magnetic susceptibility ( ) shows a typical temperature dependence of a frustrated magnet with a broad peak around 20 K (figure 2(f)). The fitting of the temperature dependence by a high-T expansion gives an estimate of the spin interaction energy
  K [38]. Whereas the heat capacity (
 ) measurements of the powder samples show no sign of a magnetic order down to 1 K [42], that of single crystals show two peaks at 0.89 and 1.10 K [43], indicating a long-range magnetic order below
  K. The heat capacity [44] and NMR [45] measurements have shown the multiple ordered phases—phase I' (
 T, 0.89 K
  ), phase I (
 T,
T,  K), phase II (
 T,
T,  ), and phase III (26 T
  , not shown)—in the
  –
– phase diagram (figure 2(e)). The magnetic structure in the phase II has been suggested as a spin-density-wave (SDW) state [46, 47]. On the other hand, the magnetic structure in phase I and I' is unidentified. This is because a large single crystal appropriate for neutron scattering experiments is not available. Neutron scattering experiments have been performed only for powder sample [48] in which the spin Hamiltonian is shown to be different because of the different lattice structure [43]. As a result, the detail of the magnetic interactions of volborthite is yet to be clarified. The magnetization measurement up to high fields have found a wide one-third magnetization plateau [46], showing that the effective Hamiltonian of volborthite is not a simple kagomé Heisenberg antiferromagnet. First-principles calculations suggest that the effective Hamiltonian can be captured by a coupled frustrated chain model [50] or a coupled-trimers model [51]. The coupled-trimers model is supported by the recent magnetostriction measurement up to 45 T [49].
Figure 2(f) shows the temperature dependence of  and
and  of the samples synthesized in ISSP. We confirmed that the zero-field heat capacity data is almost the same with the previous report [43]. Below ~15 K,
  becomes much larger than that of the lattice heat capacity estimated by the Zn analogue compound in [42], showing the dominant magnetic contribution at low temperatures. Both the temperature dependence of
  and that of
  above
above  show a finite residual in the zero-temperature extrapolation (figure 2(f)), suggesting gapless excitations in the spin liquid state.
3.1. measurements in volborthite

Single crystals of volborthite have an arrowhead-like shape with one twin boundary in the middle (figure 2(b)). All single crystals used in the thermal conductivity measurements were detwinned by cutting in half at the middle as shown in figure 2(c).
Figure 3(a) shows the temperature dependence of  of volborthite measured in several single crystals. Whereas a large sample dependence is observed in the magnitude of
  , all data shows a similar temperature and field dependence.
  shows a broad peak at 3–4 K. This peak is suppressed by a magnetic field. This field suppression is observed to be larger for crystals with higher
  . An increase of
  is observed below
  K (2 K) at zero field (15 T).

Figure 3. (a) The temperature dependence of  of three single crystals of volborthite. (b) The low-temperature data of sample #3 at 0 T. The solid line is a T-linear fit of
  below ~0.15 K. The dashed line shows an estimation of the phonon contribution (see the main text). The temperature dependence of
  from [43] is shown in the right axis for reference.
Download figure:
Standard image High-resolution imageThe longitudinal thermal conductivity of an insulator consists of the phonon contribution  and the spin contribution
  . Both are given by the kinetic equation
  , where
  is the phonon (spin) heat capacity,
  the sound (spin-wave) velocity, and
  the phonon (spin) mean free path. Given that
  at high temperature (~10 K) is dominated by
  as discussed below and that both
  and
and  are independent of the impurity density, the different magnitude of
  of the volborthite samples directly reflects the magnitude of
  in different crystals. Therefore, the sample with larger
  contains smaller defects.
The field suppression effect observed above  is attributed to the resonance scattering effect on
  and a field suppression effect on
  [15]. The resonance scattering is caused by absorption of the phonon energy into the Zeeman gap
  , where
  is the g factor (
 for volborthie [46]) and
  is the Bohr magneton [52]. This resonance scattering is the most effective when the Zeeman energy is equal to the peak of the Debye distribution function (
 ). Therefore, the decrease of
  from 0 to 15 T is mainly by the decrease of
  by the resonance scattering at higher temperatures (
 K). On the other hand, this resonance scattering is less effective at low temperatures (
 K). Therefore, the decrease of
  by applying 15 T at this temperature range is attributed to the field suppression effect on
  , providing an estimation of the fraction of the spin contribution in
  . This spin contribution estimated by the decrease of
  at the low temperatures is larger for samples with larger
  . This smaller fraction of
  in the smaller-
 crystals shows that the magnetic thermal conduction is more easily scattered by defects in crystals compared to the phonon thermal conduction.
To reveal the unknown ordered phases I and I' and the magnetic interactions of volborthite by detecting  ,
,  of the sample #3 was measured down to 60 mK (figure 3(b)). As shown in figure 3(b),
  shows two kinks at the temperatures corresponding to the two phase transitions shown by the two peaks in
  ;
;  is slightly decreased upon entering phase I' which is followed by the increase of
  in phase I.
Here, we first discuss the increase of  in phase I. An increase in
  in a magnetic ordered phase can be caused by an increase of
  owing to a decrease of the spin-phonon scattering and/or the appearance of
  by the magnons. Because the phonon wavelength becomes longer at lower temperatures,
  increases at lower temperatures until being limited by the sample size. This boundary-limited phonons give an upper limit of
  . We estimate this upper limit (the dashed line in figure 3(b)) by
  mJ K−4 Cu-mol−1,
  m s−1, and
  m, where the value of
  is estimated from the lattice data in [42],
  is evaluated by
  by the Debye relation, and
  by the effective sample size (
 ) of sample #3. As shown in figure 3(b),
  of the sample #3 in the phase I is much larger than the boundary-limited
  , showing the dominant contribution of
  in phase I. Therefore, the increase of
  in phase I is attributed to the appearance of
  by the magnons. At the lowest temperature,
  approaches asymptotically to a linear temperature dependence of
  (the solid line in figure 3(b)). As is the case of
  ,
,  also becomes saturated at lower temperatures. Given that spin wave velocity is temperature independent, the asymptotic approach of
  shows the linear temperature dependence of
  . This linear temperature dependence of
  (thus
(thus  ) is consistent with the 2D magnon contribution with a linear dispersion.
The reason for the decrease in  in phase I' is not clear at present. Because
  clearly increases in phase I', the decrease in
  should be attributed to the decrease of the mean free path of phonons or spins. Given that
  usually increases in a magnetic ordered phase by reduced spin-phonon scatterings, the decrease in phase I' may be attributed to a suppression of
  . NMR measuremensts have reported that the spin state becomes inhomogeneous in phase I' from the deviation of the NMR relaxation curve from a single exponential decay [47]. Therefore, one possible scenario for this suppression is that short-ranged magnetic domains are formed in phase I', which then give rise to additional scatterings of the magnons by the domain boundaries.
To get further insight into the unknown magnetic structure in phase I, the field dependence of  in phases I and II was measured in sample #2 (figure 4). In this measurement, both
  along the
  axis and the
  axis were measured in sample #2 to investigate if there is an anisotropy in
  expected in the anisotropic coupled chain model suggested by the first-principles calculation [50].

Figure 4. The temperature dependence (a) and (b) and the field dependence (c) and (d) of  of sample #2 measured along the
  axis (a) and (c) and the
  axis (b) and (d).
Download figure:
Standard image High-resolution imageAs shown in figures 4(a) and (b), the increase of  observed in phase I at zero field is shifted to higher temperatures at higher fields, which is consistent with the increase of
  in phase II. At lower temperatures,
  in phase I shows a similar linear temperature dependence with that in phase II, implying that the magnons near the zero energy have a similar linear energy dispersion in both phases although the location in the momentum space might be different.
The field dependence of  normalized by the zero-field value
  at fixed temperatures is shown in figures 4(c) and (d). In phase I',
  increases by fields, which is followed by a rapid increase upon entering phase II (see the data at 1.0 K in figures 4(c) and (d)). Whereas the field increase effect remains at lower temperatures in phase I' and phase I, the field dependence in phase II disappears at lower tempetures (see the data at 0.2 K in figures 4(c) and (d)). At 0.2 K,
  shows a sharp drop from phase I to phase II, indicating a first-order phase transition between the two phases.
A change of the magnon spectrum by a magnetic transition alters both  and
and  as observed in Nd2CuO4 [53]. In volborthite, NMR measurement [47] has reported that a broad single peak in phase I becomes a double-horn shape in phase II, showing a change of the magnetic structure. Therefore, the different field dependence and the sharp drop of
  between phase I and phase II should reflect this change of the magnetic structure. Recently, a phase with an orthogonal spin order in the ac plane has been suggested as phase I by a theory based on the coupled trimer model with DM interactions [54]. The magnetic field perpendicular to the ab plane frustrates this order, which is expected to lead to a drastic change in elementary excitations. In contrast, the elementary excitations of the spin density wave state, which is a candidate for phase II, are phasons [55], whose velocity depends only slowly on the magnetic field. These considerations may be consistent with the different field dependences in these phases (figures 4(c) and (d)).
The difference between  along the
  axis and that along the
  axis is smaller than the error in the estimation of the geometrical factor. This isotropic thermal conduction is more consistent with the coupled trimer model [51] rather than the anisotropic coupled-chain model [50].
3.2. measurements in volborthite

The thermal Hall effect was investigated in sample #1 with the smallest  (figure 3(a)). Figure 5(a) shows the field dependence of the transverse temperature difference
  measured by different heat current
  , where the magnitude of the longitudinal temperature difference
  at the corresponding
  is also shown. As shown in figure 5(a), the transverse temperature difference
  is dominated by the symmetric longitudinal response mixed by the misalignment effect. Figure 5(b) shows the field dependence of antisymmetrized transverse temperature difference
  . We find that a large heat current
  for
for  was necessary to increase
  above the resolution limit (the error bar in figure 5(b)). Because the small
  ,
,  measurement was successful only in sample #1 with the smallest
  , but not in other samples with larger
  . The temperature dependence of
  is obtained by measuring
  with a heat current to set
  as 10%–40% (the horizontal error bar in figure 9). As shown in figure 9, a negative
  starts to appear at
  . At lower temperatures,
  shows a broad peak ~10 K, which is followed by a sharp decrease and a sign inversion just above
  . This temperature dependence is discussed in detail later together with
  of Ca kapellasite.

Figure 5. (a) The field dependence of the transverse temperature difference  of volborthite (sample #1) measured with different heat currents
  at 8.3 K [15]. The value of the longitudinal temperature difference
  by the corresponding
  is also shown. (b) The same data of (a) antisymmetrized with respect to the field direction.
Download figure:
Standard image High-resolution image4. Ca kapellasite
Ca kapellasite, CaCu3(OH)6Cl2·0.6H2O, is a newly synthesized kagomé compound, in which Cu2+ ions form a non-distorted, ideal kagomé lattice (figure 6) [39]. Kapellasite is a structural polymorph of herbertsmithite, ZnCu3(OH)6Cl2 [56]. Compared to herbertsmithite where the non-magnetic Zn2+ ions are located between the kagomé layers, the non-magnetic Ca2+ ions in Ca kapellasite are in the same kagomé layer, resulting in a better two dimensionality by the smaller coupling between the kagomé layers. Moreover, owing to the bigger ionic radii of Ca2+ ion than that of Cu2+, there is no site mixings in Ca kapellasite, in contrast to that in herbertsmithite [57].

Figure 6. (a) and (b) Crystal structure of Ca kapellasite viewed along the  axis (a) and the
  axis (b). A picture of the setup. Four gold wires of 25 µm for the thermometers and the heater were attached to the crystal by stycast 2850 FT. The crystal was attached to the LiF heat bath by Apiezon grease.
Download figure:
Standard image High-resolution imageThe spin interaction energy  is estimated as ~60 K from the temperature dependence of the magnetic susceptibility and the first-principles calculation [16, 39]. Both the next-nearest neighbor spin interaction
  and the diagonal interaction
  are estimated as negligile compared to
  . Therefore, the spin Hamiltonian of Ca kapellasite is well approximated to an ideal KHA. The temperature dependence of
  and
and  feature a peak at
  K, which is shown later as an onset of a long-ranged ordered state by NMR measurement [58].
4.1. measurements in Ca kapellasite

Figure 7 shows the temperature dependence of  of Ca kapellasite with that of volborthite (sample #1). As shown in figure 7,
  of Ca kapellasite is about one order of magnitude smaller than that of sample #1 which shows the smallest
  measured in the crystals of volborthite (figure 3(a)). Given that the heat capacity of Ca kapellasite [39] is about two times larger than that of volborthite [43], this very small
  of Ca kapellasite can be attributed to a very short mean free path of phonons by the structural disorders in Ca kapellasite. In Ca kapellasite, Ca2+ ions are randomly located in the two equivalent Wyckoff positions. Moreover, there are vacancies for H2O molecules in Ca kapellasite. These defects are likely to scatter phonons, giving rise to the small
  .
.

Figure 7. The temperature dependence of  of Ca kapellasite at 0 and 15 T. The data of
  of volborthite (sample #1) is shown together. The dashed line indicates the Néel temperature of Ca kapellasite.
Download figure:
Standard image High-resolution imageAs lowering temperatures, only a small increase is observed in  upon entering the magnetic ordered phase below
  . Also, the field effect in
  is smaller in Ca kapellasite than that in volborthite. These results show that
  has a negligible contribution in
  in Ca kapellasite owing to the structural disorders, which is consistent with the smaller contribution of
  in the crystals of volborthite with smaller
  (figure 3(a)). These systematic relations between the magnitude of
  and that of
  observed in volborthite and Ca kapellasite demonstrate that a magnetic thermal conduction is more easily scattered by defects in crystals than that by phonons.
4.2. measurements in Ca kapellasite

Although this small  in Ca kapellasite is inconvenient to measure
  , it turned out to work better to measure
  . Remarkably, as shown in figure 8(a), the field dependence of
  observed in Ca kapellasite clearly shows an antisymmetric field dependence, which is in sharp contrast to that of volborthite in which antisymmetrizing
  is necessary to resolve the thermal Hall signal (figure 5). This large
  observed in Ca kapellasite is not owing to a large
  in Ca kapellasite, but is simply due to small
  as expected in equation (3). Because of the large
  , a heat current
  for
for  % was good enough to resolve the thermal Hall signal, enabling us to measure the temperature dependence of
  of Ca kapellasite with fixed
  % in the whole temperature range. As shown in figure 8(b), the field dependence of
  obtained by antisymmetrizing
  shows a linear field dependence above
  . Below
  ,
,  shows a non-linear field dependence with a peak around 4 T, which becomes negligibly small above ~6 T. This drastic change in the field dependence of
  below
below  is attributed to the change of the elementary excitations by the magnetic order, demonstrating a better sensitivity of
  to a change of the elementary excitation in sharp contrast to the small change in
  at
at  .
.

Figure 8. (a) The field dependence of the transverse temperature difference  of Ca kapellasite at different temperatures. The heat current
  was adjusted to set the longitudinal temperature difference
  (b) The field dependence of the thermal Hall conductivity
  .
.
Download figure:
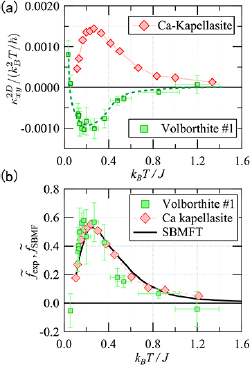
Standard image High-resolution imageFigure 9 shows the temperature dependence of  of Ca kapellasite above
  , which is determined by the linear fit of
  as a function of the field (the solid lines in figure 8(b)). Quite unexpectedly, we find that both the temperature dependence of
  and the magnitude
  of Ca kapellasite are similar to that of volborthite. This is in sharp contrast to
  which differ by one order of magnitude between the two kagomé materials (see figure 7). The very similar behaviors of
  in the two kagomé materials suggest that the origin of the thermal Hall effect does not come from phonons, but rather from spins of which the magnitude of the interaction energy is similar in the two compounds.

Figure 9. The temperature dependence of  of Ca kapellasite and volborthite (sample #1) [16].
Download figure:
Standard image High-resolution image5. Schwinger-boson mean field theory for estimating spin thermal Hall
For further investigation of a thermal Hall effect by kagomé spins, we calculate  by using Schwinger-boson mean field theory (SBMFT) [59]. In SBMFT, the spins are described by the pair of bosons
  as
as
where  and
and  is the Pauli matrices.
We take the mean-field value of the bond operator 
 to diagonalize the kagomé Heisenberg Hamiltonian
where  is the
  axis component of the DM interaction.
Figures 10(a) and (d) show the energy bands calculated by the SBMFT method for kagomé Heisenberg antiferromagnet ( ) and ferromagnet (
 ), respectively. From these energy bands,
  is calculated by the relation [17, 18]:
where  is a distribution function of the Schwinger bosons,
  polylogarithm function,
  the Bose–Einstein distribution function,
  the energy eigenvalue of
  -th energy band, and
  the Berry curvature (see [16] for details). The bands of up-spin Schwinger bosons and those of down-spin have exactly opposite
  to each other. This degeneracy is lifted by a magnetic field, giving rise to a finite
  in the sum of the whole Brillouin zone.

Figure 10. SBMFT calculations for kagomé Heisenberg antiferromagnet (a)–c) and ferromagnet (d)–(f). (a) and (d) Energy bands. The solid (dashed) lines are the bands with up- (down-)spin bosons. The red (green/blue) lines are for the upper (middle/lower) band. (b) and (e) Berry curvature of up-spin Schwinger bosons multiplied by  at
at  ,
,  , and
, and  . The purple line shows the sum of the all bands. (c) and (f) The temperature dependence of
  calculated at
  . Note that
  in antiferromagnet (c) is one order of magnitude larger than that in ferromagnet (f) because the high
  point in the former is located at lower energy at
  .
.
Download figure:
Standard image High-resolution imageFrom the definition of the Berry curvature,  becomes larger in the momentum space where the energy gap between the bands is smaller, i.e. around the
  and the
  points (figures 10(a) and (d)). The contribution of these high
  points to
  is determined by the energy dependence of the distribution function
  . Owing to the monotonically-decreasing energy dependence of
  , the high
  point at lower energy has a larger contribution to
  . As shown in figures 10(b) and (e),
  near
near  point has the largest contribution for the kagomé antiferromagnet, whereas it is at
  point for the ferromagnetic case. Non-trivial temperature dependence of
  , and thus that of
  , determine the temperature dependence of
  . As a result, the peak temperature of
  sensitively reflects the energy where
  is large. This is demonstrated by the difference in the temperature dependence and the magnitude of
  between the antiferromagnet (figure 10(c)) and the ferromagnet (figure 10(f)), which is caused by the different energy position of the high-
 .
.
To compare the calculated  with the measurements of
  in volborthite and Ca kapellasite, the thermal Hall conductivity for one two-dimensional (2D) kagomé layer is estimated by
  , where
  is the inter-layer distance (7.22 Å and 5.76 Å for volborthite and Ca kapellasite, respectively). Figure 11(a) shows
  normalized by
  at 1 T as a function of
  where
where  is assumed as 60 K for both compounds.
Figure 11. (a) The temperature dependence of  normalized by
  of volborthite (sample #1) and Ca kapellasite. The horizontal axis is also normalized by
  K. (b) The temperature dependence of the one-variable scaling function determined by the SBMF calculation
  and that by experimental data
  . Fitting parameters used for the fit of
  are (
are ( ,
,  ) = (60, −0.07) and (66, 0.12) for volborthite and Ca kapellasite, respectively [16].
Download figure:
Standard image High-resolution image
Most remarkably, both the temperature dependence and the magnitude of  are close to the calculated
  for kagomé antiferromagnet. We further normalize both the experiment and the numerical results by one-variable scaling function
  and
and  as
as
and
where  and
and  in
in  are fitting parameters.
As shown in figure 11(b), the numerical and the experimental results show a perfect agreement by choosing ( ,
,  ) = (60, −0.07) and (66, 0.12) for volborthite and Ca kapellasite, respectively. The fitting results of
  are close to the value estimated by the temperature dependence of the magnetic susceptibility and those of
  are in good agreement with
  , further supporting the agreement between the experiment and the theory. This excellent agreement, both qualitative and quantitative, demonstrates not only that the thermal Hall effect in these kagomé antiferromagnets is caused by spins in the spin liquid phase, but also that the elementary excitations of this spin liquid phase are well described by the bosonic spin excitations. These spin excitations can be detetcted by neutron scattering experiments if a large single crystal becomes available, which remains as an important future work.
As discussed in section 3, the effective spin Hamiltonian in volborthite is not a kagomé Heisenberg antiferromagnet at low temperatures. However, the difference from the observed  and that of SBMFT is not clearly observed, implying that a KHA still gives a good approximation in the temperature range where
  is observed. Numerical calculations of
  for the spins in the trimer model remain a future issue.
It is also an open question if the observed  is reproduced by calculations for other spin liquid states, in particular spin liquids with fermionic spinons. We note that the results of the ferromagnetic kagomé (figure 10(f)) clearly fail to reproduce the observed
  both in the temperature dependence and the magnitude. Also, the thermal Hall effect of the 120
 -ordered state in a kagomé antiferromagnet is shown to have a different
  [60]. Therefore, short-ranged magnons are excluded as the origin of
  observed in the two compounds.
6. Summary
We investigated both longitudinal ( ) and transverse (
 ) thermal conductivities of kagomé material volborthite and Ca kapellasite. From
  measurements in volborthie, a spin contribution is found to be larger in crystals with larger
  . In the highest-
 crystal, the dominant magnetic contribution is observed in the ordered state, which shows
  at the lowest temperatures. A different field dependence in
  is observed in phase I and II in volborthite, and
  is isotropic in the ab plane. These results put strong constraints on the unknown magnetic interactions in volborthite. In Ca kapellasite,
  is so small that a magnetic contribution is not observed. On the other hand, a spin thermal Hall effect is observed in both volborthite and Ca kapellasite. We find that κxy in both compounds can be well reproduced by Schwinger-boson mean field theory, demonstrating that the elementary excitations in these kagomé material are well described by bosonic spin excitations.
Acknowledgments
We thank fruitful discussions with S Furukawa and T Momoi. This work was supported by Yamada Science Foundation, Toray Science Foundation, KAKENHI (Grants-in-Aid for Scientific Research) Grant No. 18H05227, No. 19H01809 and No. 19H01848, and Grants-in-Aid for Scientific Research on Innovative Areas 'Topological Material Science' (No. 15H05852) from Japan Society for the Promotion of Science (JSPS). HL and NK were supported by MEXT as 'Exploratory Challenge on Post-K computer' (Frontiers of Basic Science: Challenging the Limits).
Footnotes
- 6
See supplementary material.