

Abstract
The supercapacitive performance in transition metal oxide(s) based supercapacitors is attributed to the enhanced redox activity at the electrode–electrolyte interface. In hierarchical nanorods of Co3O4, with high surface area and reasonable supercapacitive performance, the electrochemical capacitance can be doubled by the addition of a suitable redox additive viz. potassium ferricyanide K3Fe(CN)6. As the 2 M KOH electrolyte is modified by varying concentrations of K3Fe(CN)6, the specific capacitance shows an increasing trend up to an optimum concentration of redox additive. The fabricated device also show improvement in the cyclic and charge/discharge characteristics. The tremendous increase in the power and energy density values makes the devices quite useful for industrial applications.
Export citation and abstract BibTeX RIS
1. Introduction
Electrodes play a crucial role in determining the electrochemical performance of renewable energy devices such as supercapacitors, Li-ion batteries, fuel cells (conventional and biological both), etc [1–3]. Most carbonaceous electrode materials, even with high specific surface area and porosity, return limited specific capacitance. This is linked to the restricted access to the smaller pores for the hydrated ions of the electrolyte to occupy [4, 5]. To counter this detrimental effect, it is imperative to incorporate redox rich electrodes, which enforce fast and reversible kinetics [6, 7]. The most commonly known pseudocapacitive type electrode materials are based on transition metal oxides [8]. Their electrochemical performance can be controlled by tuning the particle crystallinity, architecture and size [9, 10]. Simple nanometer sized metal oxides, with morphologies such as: nanowires, nanotube, nanoflakes, etc, are traditionally favored for application as electrodes in supercapacitors. These conventional nanostructures offer high surface area and thermodynamic stability [11]. In order to enhance their capacitance values, use of kinetically stabilized nano/micro hierarchical structures is now envisaged [12–14]. The presence of hierarchical structures also provides a microsized substrate onto which the nanosized morphologies can be patterned. While the former helps in suppressing the diffusion time for the electrolyte ions, the latter ensures improved thermodynamic stability and interfacial interaction with the active species [15]. Another protocol that has been very recently suggested is the use of hollow structures, where fast kinetics, mechanical/thermal stability and enhanced cycle life have been reported in supercapacitors [16]. To increase the performance of redox electrodes like MnO2, Co3O4, CuO, Cu2O, NiO, V2O5, etc, tailoring of particles morphology or the use of dopants are the most common strategies. These have led to appreciable improvement in the device performance but the values reach saturation after all such combinations are exhausted. Therefore, additional protocols are required that can lead to improvement in the energy and power densities. Out of the many resurging strategies, use of redox additive is quite promising [17–22]. These redox additives undergo fast redox interactions at the electrode-electrolyte interfaces and induce increased power and energy densities [23–27].
Amongst the various available pseudocapacitive materials, cobalt oxide (Co3O4) is one of the most promising; owing to its low cost, natural abundance, and environmental safety [28–31]. This also allows significant lowering of the geopolitical/economic issues related with the use of Li-based electrodes in energy devices. Therefore, Co3O4 based systems are being now routinely proposed for applications ranging from catalysts [32], biosensors [33], Li-ion batteries [34], field emitters [35] to ultracapacitors [36], etc.
Although, Co3O4 based electrodes have been investigated, their extensive use in final devices remains limited. This is linked to the fact that it shows low electrolyte diffusion and poor electronic conductivity, which leads to lower specific capacitance and under-utilization of the active material. The use of porous structures have also been proposed so that some of the adverse factors can be suppressed [37, 38]. For example, flower-like Co3O4 have been synthesized using one-step, template-free and water-controlled precipitation methods [39, 40]. Hollow and ordered mesoporous Co3O4 have been prepared using a facile two-step route or low temperature recrystallization processes followed by thermal decomposition [41, 42]. But, the reported electrochemical values have continued to be low, in comparison to other similar cost-effective electrodes such as MnO2, SnO2, etc [43–45, 66].
In this present work, we propose a facile strategy to obtain Co3O4 nanorods using a cost effective synthesis protocol. To bring quantum jump in the electrochemical performance, the use of potassium ferricyanide K3[Fe(CN)6] as redox additive in KOH electrolyte is reported. The charge storage mechanism shows improvement, which makes it an economically viable electrode material. It is shown that the cyclic stability is also significantly enhanced, in comparison to device fabricated using an unmodified electrolyte system. The reported values are mostly higher than those reported in composites comprising of Co3O4 and other expensive components such as: reduced graphene oxide, graphene, Ni-foam, etc. This further establishes the importance of the use of redox additives in supercapacitors.
2. Experimental
2.1. Synthesis of Co3O4 nanorods
Cobalt chloride hexahydrate (98%) and urea (99%) were procurred from Merck Specialities Pvt. Ltd, India and Nice Chemical Pvt. Ltd India, respectively. Potassium ferricyanide (99%) was obtained from LobaChemie Pvt. Ltd, India. All the precursors were used without further purification. De-ionized water was used throughout the experiments.
To initiate the particle formation, urea complex of cobalt was prepared by employing a low temperature hydrothermal method. For this, CoCl2·6H2O and urea (molar ratio 2:1) were mixed in de-ionized water for 30 min. The resultant solution was left undisturbed for ~12 h. The solution was subsequently transferred to a sealed borosilicate glass bottle. The sealed glass bottle was then heated in an oven at 393 K for 8 h. The obtained pink precipitate was filtered and washed several times with de-ionized water and ethanol until it became free of Cl- and spare urea. The obtained filtrate was dried overnight at 353 K in a vacuum oven. The final product was obtained after calcining the powder at 773 K for 3 h in ambient atmosphere. These samples are henceforth abbreviated as (CO-500).
2.2. Characterization
The phase formation of the samples was investigated using a PANalytical X'Pert diffractometer having CuKα incident radiation (λ = 0.154 06 nm) in the range 10–80°. Scanning electron (SEM CARL ZEISS SUPRA 40, 20 kV) and transmission electron microscopy (TEM FEI-TECNAI G220S-Twin operated at 200 kV) were used for morphological analysis. X-ray photoelectron spectroscopy (XPS) measurements were carried out using a PHI-5000 VERSAProbe II x-ray photoelectron spectrometer having monochromatic AlKα as the incident photon energy. Thermogravimetric analysis (TGA) data was obtained under ambient atmosphere at 10 °C min−1 heating rate, using a Perkin Elmer Diamond TG/DTA thermal analyzer. The Brunauer–Emmett–Teller (BET) surface area and porosity data were collected using a Quantachrome Autosorb-iQ/MP-XR surface area analyzer.
2.3. Electrochemical measurement
Co3O4 electrodes were prepared by mixing 80 wt% Co3O4, 10 wt% activated carbon, and 10 wt% polyvinylidene fluoride in acetone. The mixture was ultrasonicated for 5 min and then stirred continuously at 343 K for 24 h to ensure homogeneous mixing and slurry. The slurry was uniformly coated onto a graphite sheet (1 cm × 1 cm), before being dried in a vacuum oven for ~12 h. Initially, the electrochemical measurements such as: cyclic voltammetry (CV), galvanostatic charge–discharge (CD) and impedance spectroscopy (EIS) were performed in 2 M KOH with the help of a Metrohm Autolab (PGSTAT302N) in a three electrode cell configuration. Platinum wire and Ag/AgCl/3.0 M KCl were introduced as the counter and reference electrodes, respectively (active mass 0.5 mg).
3. Results and discussions
Figure S1 (stacks.iop.org/JPhysD/52/155501/mmedia) (supporting information) shows the XRD pattern of the synthesized cobalt oxide nanorods (a) before and (b) after calcination at 773 K in air. The sharp and narrow peaks could be indexed with the crystalline phase of spinel Co3O4, having a cubic cell with the Fd m space group (JCPDS card no. 42-1467).
XPS measurement of CO-500, shown in figure 1, further corroborated the formation of Co3O4. Two major peaks, at binding energies of ~779.21 and ~794.34 eV, respectively, were observed. These corresponded to the spin–orbit energy splitting of ~15.13 eV. The peaks could be attributed to Co 2p3/2 and Co 2p1/2, respectively, of the Co3O4 [46]. The deconvoluted peaks at ~779.41 and ~794.41 eV were linked to Co3+, whereas the peaks at ~781.04 and ~796.34 eV are known to originate due to Co2+ [47]. The well resolved peaks of O 1s spectrum, at binding energies of 528.43 and 530.3 eV, are generally related to the lattice oxygen of spinel and the hydroxyl (OH) species adsorbed onto the sample nanostructure surface [48].
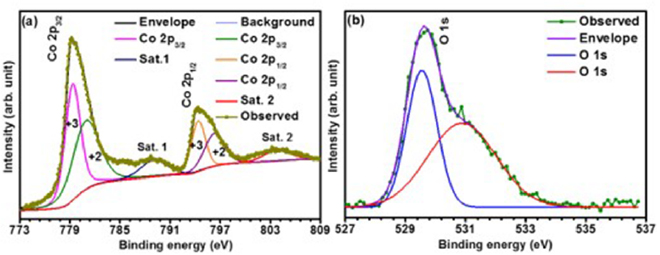
Figure 1. High resolution XPS spectrum for (a) Co 2p and (b) O 1s in Co3O4.
Download figure:
Standard image High-resolution imageThe scanning electron micrographs of the CO-500, shown in figures 2(a) and (b), portray the particle morphologies at varying magnifications. The particles had uniform nanorods type assembly of nano-sized particles, arranged in mesoporous formation. Such nanoparticles were bundled together at one of their ends, which led to formation of loosely bound broom like microstructures. It was also observed that the average size of nanoparticles was ~64 nm whereas the length of the nanorods was ~1.6 µm. To corroborate the inferences drawn based on SEM results, transmission electron microscopic images were analysed. These are shown in figures 2(c) and (d), along with the corresponding selected area electron diffraction patterns. HRTEM micrographs clearly depicted the mesoporous structure was made up of nanorods with nanoparticles clinging to it. The inset shows the lattice fringes of the spinel structure of Co3O4 nanorods.
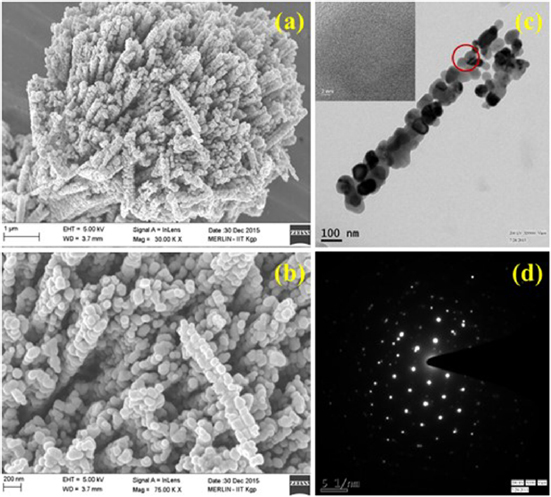
Figure 2. (a), (b) SEM micrographs at different magnification for the Co3O4 hierarchical nanorods, (c) TEM image of CO-500 nanorod and (d) selected area electron diffraction image collected at the encircled points.
Download figure:
Standard image High-resolution imageNormally, pseudocapacitive behavior of an electrode material is attributed to the pore size distribution and specific surface area (SSA) [49]. To analyze the SSA and pore structure of the Co3O4 nanostructure, BET gas adsorption–desorption experiments were performed. Figure S2 (supporting information) shows the N2 adsorption–desorption isotherm for the porous Co3O4 nanorods obtained at 77 K, while the inset in figure S2 depicts the corresponding plot of the pore size distribution. The curve was similar to the one expected in materials having type IV behavior with H4 hysteresis loop. Therefore, formation of a mesoporous structure of Co3O4 nanorods with pore size distribution of ~7 nm could be claimed. The BET surface area was ~12 m2 g−1, with corresponding collective total pore volume of 33 × 10−9 m3 g−1.
Figures 3(a) and (b) depict the cyclic voltammetry (CV) curves of the synthesized Co3O4 nanorods, recorded before and after 3000 charge discharge cycles, in 2 M KOH electrolyte at scan rates 5–250 mV s−1. The measurements were performed in a fixed potential window of −0.4 to 0.5 V. The mesoporous structure of CO-500 is expected to facilitate fast electron and ion transfer, along with large electroactive surface area. In Co3O4, the two redox couples, which are shown below are linked to the pseudocapacitive process [50].


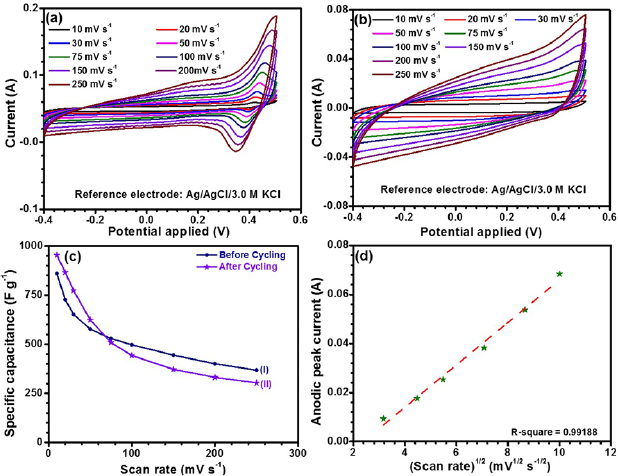
Figure 3. Cyclic voltammetry curves of CO-500 at different scan rates (a) before cycling and (b) after 3000 cycles, (c) specific capacitance of electrode (I) before cycling and (II) after 3000 cycles at various scan rates and (d) relationship between the anodic peak currents and square root of scan rate.
Download figure:
Standard image High-resolution imageThe redox peaks, appearing in the CV curves, before cycling, could be attributed to Co2+/Co3+ reaction and the conversion between Co3+ and Co4+ species. The CV profiles, shown in figure 3(a), also indicated that the estimated specific capacitance had dominant contribution from redox reactions rather than the electric double layer capacitance (EDLC) [51].
The asymmetric nature of oxidation and reduction peaks occur due to a quasi-reversible behavior of the underlying redox reactions. With increasing scan rates, the anodic and cathodic peaks moved toward higher and lower potential sides, respectively. The broad overlapping of the cathodic peaks is known to be related with the polarization of redox peaks [52]. The specific capacitance was estimated using the following equation [53]:
where m is the mass of the active material, ν is the scan rate, ΔV indicates the potential window, and i(V) the current at each potential. The calculated specific capacitance at various scan rates are listed in table 1.
Table 1. Specific capacitance values corresponding to scan rates before and after cycling.
| Scan rates (mV s−1) | Specific capacitance before cycling (F g−1) | Specific capacitance after cycling (F g−1) |
|---|---|---|
| 10 | 859 | 954 |
| 20 | 727 | 866 |
| 30 | 652 | 774 |
| 50 | 577 | 624 |
| 100 | 497 | 442 |
| 200 | 401 | 331 |
As a result of cycling, the CV curves deviated from a typical faradic behavior. It started showing features expected from EDLC behaviour, where the redox couple in the CV curves is appreciably diminished with cycling. The specific capacitance, obtained after 3000 GCD cycles, are listed in table 1.
A curve between specific capacitance as a function of scan rate, is shown in figure 3(c). It was observed that the specific capacitance decreased with increasing scan rate; indicating dominance of the redox reactions [54]. The Randles–Sevcik plot between the anodic peak currents and the square root of the scan rates are shown in figure 3(d). This indicated that the reaction kinetics, occurring during the electrochemical redox reactions, was primarily being controlled by the diffusion of OH− ions. For semi-infinite linear diffusion process, the anodic peak current behavior is described by Cottrell equation [55]. The linear sweep voltammogram would take longer time to be recorded as the scan rate is decreased.
The pseudocapacitor properties were further evaluated by the galvanostatic charge–discharge (GCD) studies at different specific currents. Figure 4(a) shows the GCD curves of CO-500 nanorods measured at specific currents of 2, 3, 4, 6, 8 and 10 A g−1 and potential window of −0.4 to 0.5 V. In GCD curve, the electrode potential showed a non-linear variation as a function of time. It had characteristics of pseudocapacitance features.
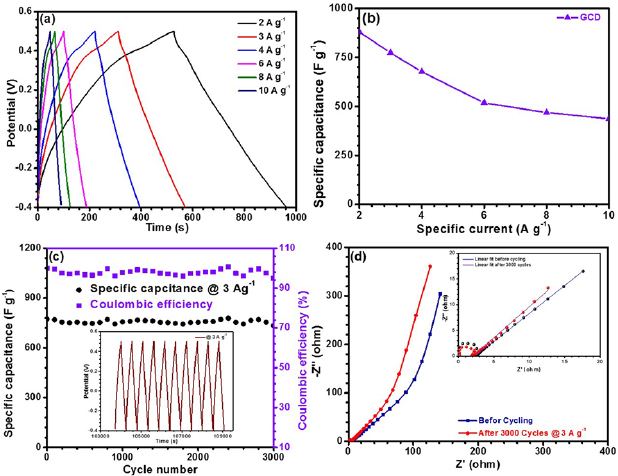
Figure 4. (a) Galvanostatic charge–discharge profile of CO-500 at different specific currents, (b) specific capacitance at various specific currents, (c) cycling life of the CO-500 electrode at specific current of 3 A g−1 in 2 M KOH solution and inset shows last few cycles and (d) Nyquist plots of the CO-500 electrode before and after 3000 cycles at a specific current of 3 A g−1 and inset shows the zoomed view of impedance values in the high frequency range.
Download figure:
Standard image High-resolution imageThe specific capacitance can be calculated according to the following equation [56]:
where im is specific current, Vdt is area under discharging curve, Vf and Vi are final and initial voltage, respectively. It was further noticed that the discharge curve contained two distinct regions viz., one in the range −0.4 to 0.3 V showing good linear relation with time, which represent the ideal nature of EDLC, and second in the range 0.3–0.5 V where the voltage was non-linear with time. Corresponding to the specific currents of 2, 3, 4, 6, 8 and 10 A g−1, the SCs were estimated as 881, 773, 677, 518, 469 and 437 F g−1, respectively. Figure 4(b) represents the variation of specific capacitance with increasing specific currents. The increase in the specific current resulted in the fading of SC, which can be attributed to the induced mechanical stress owing to repeated insertion and de-insertion of electrolyte ions [57].
The cyclic stability of supercapacitors is one of the important parameters for their commercial applications. The long-term cycling and columbic efficiencies of CO-500 electrode were determined using the galvanostatic charge/discharge curves for 3000 cycles at high specific current of 3 A g−1. The corresponding data is shown in figure 4(c). The charge/discharge measurement was performed in the potential window of −0.4 to 0.5 V in 2 M KOH solution. It was observed that the specific capacitance decreased slightly till 400 cycles, before stabilizing. The capacitance retentivity was found to be ~95% after 3000 cycles, which is quite high for the specific currents that were used during the measurements of CD performance in these types of spinel oxides.
Figure 4(d) depicts the electrochemical impedance spectroscopy (EIS) analysis using rms sine potential of 5 mV, in a frequency range from 100 kHz to 0.01 Hz. The Nyquist plot consisted of a semicircle in the high frequency range and a nearly straight line at the low frequency range. At low frequencies, the slope of the line is attributed to the diffusive resistance of the OH− ions (also known as Warburg impedance W), while the semicircle in the high frequency region is related to the Faradic reactions and its diameter signifies the interfacial charge-transfer resistance (Rct) [58]. It can be seen from the zoomed inset, both the slope of the lines and the diameter of the semicircles were modified after the cycling. This can be associated to the microscopic stresses that will originate from the sequential charging/discharging processes. At higher frequencies, the impedance behaves like a resistance but with decreasing frequency, the slope indicated stabilization of a pure capacitive behaviour. The impedance parameters obtained from the equivalent electrical circuit fitting is shown in scheme 1.
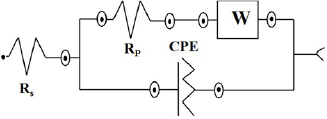
Scheme 1. Equivalent circuit used for fitting the EIS experimental results.
Download figure:
Standard image High-resolution imageThe results indicated:
- (1)high stability of the spinel structure, and
- (2)dominance of redox reactions in determining the specific capacitance.
The values of specific capacitances are comparable or higher to those reported in materials under investigation [59–61]. But, to make a worthwhile contribution, it becomes imperative to bring appreciable increase in the specific capacitance values. Logically, increasing the redox activity will be the way forward. Therefore, we proposed the use of redox additives, which is a strategy being extensively revisited [18, 62].
The incorporation of redox additives provides additional redox pairs and complement the inherent redox activity of the faradaic electrode material. In the present case, the electrolyte system was modified by adding K3[Fe(CN)6] to the KOH electrolyte. This releases the redox pair:  /
/ and is compatible with KOH [14, 63]. In a typical pseudocapacitive materials, redox reaction occurs at the surface layer of electroactive materials and provides fast I–V response. Thus, by adding electrochemically reversible
  /
/ redox pair, the conductive mechanism of active electrode material is also expected to get modified.
To further improve the electrochemical performance of the obtained CO-550 nanorods, incorporation of various concentration of K3[Fe(CN)6] (KFCN) was proposed. For these studies, electrodes with high mass loading (active mass ~1.2 mg) were used since these can withstand the micromechanical stresses arising due to variations in scan rates, specific currents, redox additive concentrations and sequential charging and discharging. [27, 64]. The cyclic voltammetric studies were carried out at various scan rates viz., 10, 50, 100 and 200 mV s−1. The results are shown in figures 5(a)–(d). Specific capacitances obtained from the CV data are listed in table 2. The cycling behavior for up to 6.0 mM KFCN doped was quite normal and smooth in comparison to higher concentrations, where abrupt cycling nature was observed. Also, capacitance fade was higher in samples having KFCN concentration more than 6.0 mM. So, results related with 6.0 mM KFCN doped system are presented below.
Table 2. Specific capacitance values corresponding to scan rates for pure and redox additive concentration.
| Scan rates (mV s−1) | Specific capacitance (F g−1) | |
|---|---|---|
| 2 M KOH (pure) | 6.0 mM KFCN + 2 M KOH | |
| 10 | 534 | 711 |
| 50 | 359 | 487 |
| 100 | 271 | 354 |
| 200 | 206 | 255 |
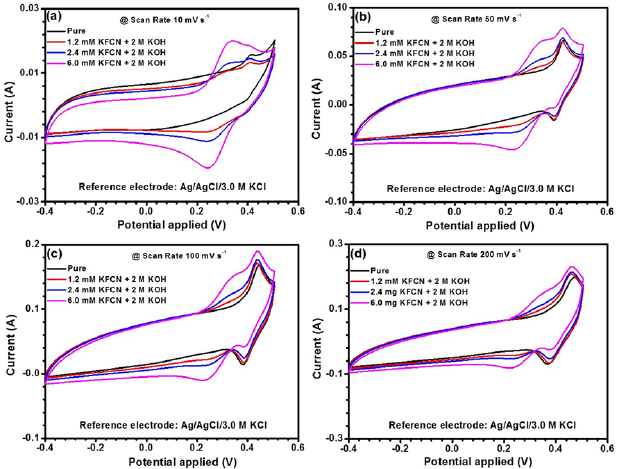
Figure 5. Cyclic voltammograms for systems pure 2 M KOH, 1.2 mM KFCN + 2 M KOH, 2.4 mM KFCN + 2 M KOH and 6.0 mM KFCN + 2 M KOH at scan rates (a) 10, (b) 50, (c) 100 and (d) 200 mV s−1.
Download figure:
Standard image High-resolution imageFigure 5 depicts the CV comparison curves for CO-500 nanorods electrode without and with the addition of redox additive to the supporting electrolyte. Appreciable increase in the area of cyclic voltammograms could be observed, with increase in the addition of KFCN to 2 M KOH leading to the increased charge storage capacity. At higher scan rates, for redox additive concentration ⩾2.4 mM KFCN, there was appearance of an additional redox peak during charging in comparison to pristine 2 M KOH. This additional redox peak can be attributed to the redox pair  /
/ [65].
[65].
For the optimized redox additive concentration of 6.0 mM KFCN, the area under the curve became larger as the scan rate was increased. This is associated with a typical quasi-reversible redox process. Moreover, a common characteristic of quasi-reversible nature of electrode is the shifting of oxidation/reduction potential peaks with increasing scan rates. In the present case, minimal peak shifting was discernible even after the addition of redox additive. Further it could be observed that additional peak occurring at ~355 mV was very near to the redox pair peak of Co2+/Co3+.
The redox additive dependent capacitive behavior could be further estimated from the galvanostatic charge/discharge technique. Figures 6(a)–(d) depict the charge/discharge potential versus time curve at specific currents of 1, 2, 3 and 10 A g−1 for various concentrations of KFCN.
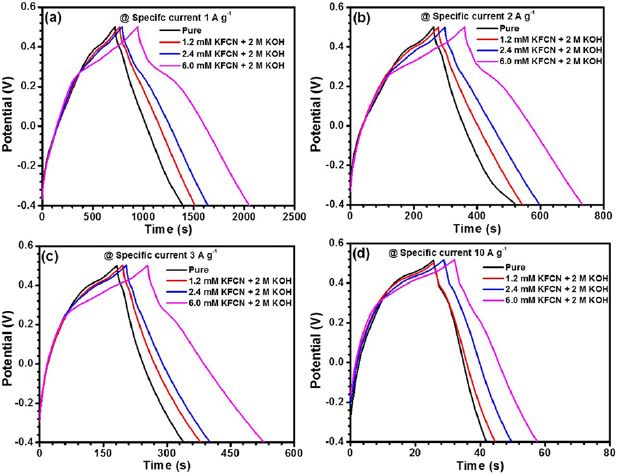
Figure 6. Galvanostatic charge/discharge curves for systems pure 2 M KOH, 1.2 mM KFCN + 2 M KOH, 2.4 mM KFCN + 2 M KOH and 6.0 mM KFCN + 2 M KOH at specific currents (a) 1, (b) 2, (c) 3 and (d) 10 A g−1.
Download figure:
Standard image High-resolution imageUsually, the lower discharge time is always equivalent to or marginally lesser to the charging time for a reversible or quasi-reversible process. From the GCD profiles, it could be inferred that, for lower specific currents, the discharging time was greater than the charging time at different concentrations of KFCN. Specific capacitance values calculated from GCD, at different redox additive concentration, with varying specific currents are listed in table 3.
Table 3. Specific capacitance values corresponding to specific currents for pure and redox additive concentrations.
| Specific currents (A g−1) | Specific capacitance (F g−1) | |
|---|---|---|
| 2 M KOH (pure) | 6.0 mM KFCN + 2 M KOH | |
| 1 | 577 | 1110 |
| 2 | 382 | 723 |
| 3 | 376 | 718 |
| 10 | 166 | 244 |
The phenomena observed in the GCD plots for smaller specific currents viz. 1 A g−1, 2 A g−1, where discharging time > charging time, did not corroborate the quasi-reversible nature of the electrode but it showed that  ions had a significant role in bringing drastic change in the electrochemical activity of CO-500 nanorods electrode. For a particular redox additive concentration, with increasing specific current, specific capacitance had an inverse relationship with specific current. This can be explained as following: at high specific currents, the
  ions attain time constraints that limits their diffusion through the electrode/electrolyte interface, while, at lower specific current,
  ions would have adequate time for accessing the interface. From figure 6(c), at specific current of 3 A g−1, the potential plateau at ~0.28 V in charging process and 0.22 V in discharging process, owing to the oxidation of Co2+ and reduction of Co2+, respectively.
The change in coulombic efficiency (η), with variation in redox additive concentration, was estimated using the relation [67]:
where td is discharging time and tc is charging time. Columbic efficiency calculated at specific current of 3 A g−1 at different concentrations of redox additive are listed in table 4.
Table 4. Charge and discharge times and coulombic efficiency for different redox additive concentrations at specific current of 3 A g−1.
| Redox additive concentration (mM) | Charging time (s) (tc) | Discharging time (s) (td) | Coulombic efficiency (η) (%) |
|---|---|---|---|
| Pure | 180.9 | 156.8 | 86.7 |
| 1.2 | 194.8 | 184.5 | 94.7 |
| 2.4 | 201.8 | 198.5 | 98.4 |
| 6.0 | 276.45 | 275.9 | 99.8 |
Figures 7(a) and (b) depicts the variation of specific capacitance, with varying scan rates and specific currents, respectively. As shown in figure 7(a), at higher scan rates, the presence of large amount of  ions hinder the diffusion time at the electrode/electrolyte interface. Further, same behavior of specific capacitance could be found with varying specific currents for different concentrations of KFCN. Here also, the rate of decrease in specific capacitance, with respect to the specific currents, was highest among other systems. This can happen due to the larger micromechanical stresses felt by electrode/electrolyte interface at higher scan rates resulting in higher flux of
  ions impinging on electrode for small time.
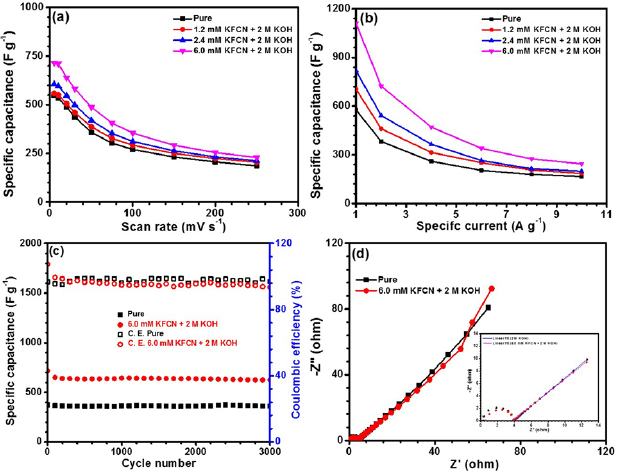
Figure 7. (a) Specific capacitance with respect to variation of scan rates for all systems, (b) specific capacitance versus specific currents for all systems, (c) cyclic performance measured by using GCD at specific current of 3 A g−1 for systems pristine 2 M KOH and 6.0 mM KFCN + 2 M KOH and (d) Nyquist plots of CO-500 electrode in pristine 2 M KOH and 6.0 mM KFCN + 2 M KOH.
Download figure:
Standard image High-resolution imageThe cyclic stability for both the systems (i) pure 2 M KOH and (ii) 6.0 mM KFCN + 2 M KOH were also performed at specific current of 3 A g−1 by sequential galvanostatic charge/discharge technique. The data is shown in figure 7(c). System (i) represents high cycling stability with capacity retentivity of ~97% after 3000 cycles. The lower capacity retention (~87%) of system (ii) can be linked to possibility of fast faradic conversion involving  /
/ reaction, increased consumption of
  ions and unavailability of some of the
  ions trapped into limited sized pores of the CO-500 nanorods. The much higher capacity retentivity at higher concentration of KFCN could be attributed to the availability of electrochemically favorable sites in the nanostructure that provide spatial clearance for higher number of
  ions. Upon persistent cycling, lattice expansion and contraction due to the larger concentration of KFCN induce new active sites, which would contribute in the charge transfer mechanism and enhance the capacitive factor [68].
Figure 7(d) depicts the Nyquist plot, drawn in the frequency range 0.01 and 100 kHz. It is observed that all the spectra indicated two common features: (a) small single semicircle in high frequency range related to the charge transfer process, which is independent of potential [69], and (b) a straight inclined line in the low frequency region, i.e. towards 45° related to the diffusion. The lower value of Rct in presence of 6.0 mM KFCN indicates higher contribution of  ion in the conductive mechanism of CO-500 nanorods. The electrochemical impedance parameters of Co3O4 electrode for different electrolyte systems are listed in table 5. The impedance data were modelled using an equivalent circuit as shown in scheme 2.
Table 5. Impedance fitting parameters obtained from equivalent circuit for various redox additive concentrations.
| Parameters | 2 M KOH | 6.0 mM KFCN + 2 M KOH |
|---|---|---|
| Rs (Ω) | 0.230 34 | 0.542 29 |
| Rct (Ω) | 3.765 40 | 3.184 59 |
| Cdl (F) | 7.841 41 × 10−8 | 1.152 07 × 10−7 |
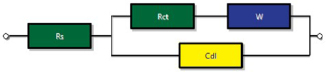
Scheme 2. Equivalent circuit used for fitting the EIS experimental results obtained from pristine electrolyte and various concentrations of redox additive in 2 M KOH.
Download figure:
Standard image High-resolution imageFrom the above electrochemical studies on redox additive concentrations, it is observed the 6 mM KFCN + 2 M KOH leads to nearly two-fold increase in the specific capacitances, in comparison to pure electrolyte. Apart from this, the discharge curve was approximately linear and symmetric, which is a desirable for practical applications.
We also calculated dielectric constant of the material (CO-500) using PSM1735 Frequency Response Analyzer at room temperature by making Co3O4 pellet of diameter 0.9 mm and thickness 1.1 mm. The dielectric constant values varied from 55 to 31 in the frequency range (100 Hz to 2 kHz). These values match well with the reported literature and are also comparable to other similar metal oxides [70–72]. Further, these calculated values are lower than the other systems such as carbon nano-onion composites based supercapacitors [73, 74].
Symmetric devices were fabricated using Co3O4 electrode (mass loading 1.5 mg) in both pure 2 M KOH and 6.0 mM KFCN + 2 M KOH electrolyte. Whatman glass fiber paper (pre-soaked in electrolyte) was used as the separator. The optimized voltage window was found to be 1.3 V (−0.8 V to 0.5 V). Figure 8(a) depicts cyclic voltammogram of both the devices at 50 mV s−1 scan rate. The device using redox additive KOH as the electrolyte showed a certain increase in the area of CV curves, suggesting improved electrochemical performance the same as the three electrode system. The similar trend was also observed in galvanostatic charge/discharge curves shown in figure 8(b), where redox additive device gave better performance. The specific capacitance values were calculated from CV and charge–discharge curves for various scan rates and current density respectively and the results are given in figure 8(c). The specific capacitance values of the devices were estimated as 78 and 112 F g−1 at 1 A g−1 current density in pure 2 M KOH and 6.0 mM KFCN + 2 M KOH electrolyte, respectively.

Figure 8. (a), (b) Cyclic voltammograms and galvanostatic charge/discharge curves for systems pure 2 M KOH and 6.0 mM KFCN + 2 M KOH at 50 mV s−1 scan rate and 1 A g−1 current density, respectively, (c) change in specific capacitance with scan rate and current density and (d) Ragone plot for the two symmetric devices.
Download figure:
Standard image High-resolution image
The energy and power density of both the devices were calculated using the following equations:
where C is the specific capacitance at a particular current density, V is the operating voltage window and t is the total discharge time. The Ragone plots of both the devices showing power density and energy density were depicted in figure 8(d).
4. Conclusions
To summarize, we have successfully synthesized Co3O4 hierarchical nanorods via a semi-hydrothermal method, which is cheaper than conventional hydrothermal methods. Porous nanoparticles are engraved onto nanorods, which provide pathways for electrolyte diffusion. The electrochemical measurements reveal that Co3O4 nanorods manifest favorable pseudocapacitive features with high specific capacitance and appreciable cyclic stability. It is established that the use of potassium ferricyanide as redox additive in 2 M KOH electrolyte can induce nearly 2 times increase in the specific capacitance. The coulombic efficiency was also close to 100%. Finally, ESR and diffusion resistance values were also low, which are amongst the crucial factors in deciding electrochemical performance. The two-electrode symmetric device performance of Co3O4 was also performed in both pure and redox additive KOH. The latter showed an improved performance. The energy and power density of the devices were also calculated and corresponding Ragone plot is given in this paper.