

Abstract
The optical activity of dye molecules in different environments is of great interest for many applications such as laser system or biological imaging. We investigate the fluorescence and absorption spectrum of nano-confined xanthene dyes (RhB and fluorescein sodium salt) in a two-phase liquid. Each show very distinct optical behavior in the water phase of a reverse microemulsion. Their optical properties such as absorption and fluorescence for different concentrations of dye and nanodroplets are investigated. We show that for the same concentration of dye in the microemulsion the peak of fluorescence intensity is varied by altering the concentration of nanodroplets. However, the trend of the change is widely different depending on the hydrophobicity of dyes. Quantum-mechanical second order perturbation theory is used to calculate the ratio of dipole moments in the ground and excited states, which accounts for the Stokes shift in fluorescence peak. Photon correlation spectroscopy is employed to check the trace of the dye in the oil phase of the microemulsion.
Export citation and abstract BibTeX RIS
1. Introduction
Dye molecules emit light in different wavelengths upon excitation with a single wavelength. These molecules are used in wide range of application such as lasing material, single molecule spectroscopy, painting, food and biological imaging [1–5]. A high fluorescence quantum yield, photostability and also low quenching rate are necessary conditions for most applications [6]. Dimerization is one of the main mechanisms, which causes quenching of dye molecules and reduce the fluorescence quantum yield of the medium [7]. A simple method to avoid molecular aggregation is to embed them in a medium thus fixating the position of the dye molecules [8, 9]. Solid and transparent materials such as glass and polymeric material are used as host materials but due to their limited thermal diffusion dye molecules tend to degrade quickly and reduce the fluorescence quantum yield [8, 9]. Additionally, if dyes are illuminated by a non-uniform light source depending on the thermal and optical properties of the medium one might introduce a nonhomogeneous medium with a varying refractive index, which changes the fluorescence emission [10, 11]. One possible medium for a dye system is a liquid medium but it depends on the application. It is very crucial to be able to choose a medium with the desired thermal and optical properties without varying the pH and molecular structure of the host material. It is an almost impossible task to find a single-phase medium with the desired properties but one can achieve it by choosing a two (or more) phase medium. In a two-phase medium, dye molecules can be dissolved and encapsulated in one medium while it is almost isolated from any chemical interaction with the second medium. Emulsions (oil in water) and reverse emulsions (water in oil) are in the class of two-phase systems [12–14], which have been studied extensively for encapsulating dye molecules. In an emulsion system, one can use a water dissolvable dye with an oil medium (or vice versa) thus avoiding dimerization, which leads to the quenching. This class of system is commonly used in two different size ranges, macroemulsion and microemulsion [15–19]. Macroemulsions are in the size range of bigger than 1 µm and they are not thermodynamically stable (with a stability period of a few days to months). Due to their size and their perfect curvature, macroemulsions are used as microcavities for microlaser systems. The emission of such microcavities can be described with whispering gallery modes [20, 21]. Macroemulsions are used for tuning the wavelength of microlasers by varying the size, dye concentration or the shape of micrometer-size droplets [22]. However, due to low lifetime and the size and polydispersity of macroemulsions, one should supply the system with fresh and monodisperse macroemulsion continuously. In contrast to macroemulsions, microemulsions are more monodisperse and very stable. Microemulsions sized smaller than 100 nm are thermodynamically stable [14]. Due to their size, these types of emulsions cannot be used as microcavities but they can be used as a host medium for dye molecules. One of the prime reasons to use a microemulsion is its unique ability to modify the refractive index or dielectric properties without concern about the interaction of the molecules with the medium [23]. Additionally, microemulsions are used for stabilization and enhance the solubility of dye molecules [24]. Dye dissolved in a microemulsion medium is much more resistant to decomposition and localized heat compared to dye-doped polymers or dye-doped glass medium, hence it increases the lifetime of dye lasers. Moreover, the optical properties (absorption and fluorescence) of dyes can be tuned by solvents [23, 25], pH [26, 27], dye concentration [26], surfactant concentrations [27] and concentrations of water in a microemulsion [28].
In this study, we systematically study the optical properties of two xanthene dyes (Rhodamine B (RhB) and fluorescein sodium salt) in a microemulsion system. We show how the structure of the microemulsion influenced the absorption and fluorescence spectrum of each dye. This study aims to shed light on how the concentration of a nanodroplet might change the emission spectra thus presenting the possibility of optimizing a dye-doped microemulsion system for different applications. Rhodamine dyes (have several derivatives such as RhB, Rhodamine 6G and Rhodamine 123 etc) are in a class dyes that emit red light with the wavelength above 600 nm. This class of dye is a very useful marker for biological application because of the noninvasive nature of red light in biological system [2]. Here we focus on RhB, which has four types of molecular forms, quinonic, lactonic, zwitterionic and cationic [29] depending on the medium. RhB and its derivatives have been studied extensively in both liquid and solid media. The degradation process, marking, the electric permittivity of their medium, quenching and also the effect of pH on emission has been investigated [2, 30, 31]. Fluorescein sodium salt (FSS) also called uranine is practically non-toxic, readily soluble in water and is used as an organic semiconductor and for diagnostic purposes in medicine [26, 33]. FSS is a very useful tracer even at very low concentrations, which is essential in studies that require a very good sensitivity [26].
RhB and FSS dissolve in reverse microemulsion are studied as model systems for dye-doped (reverse) microemulsion. RhB and FSS have different solubility in water in the amounts of 12 g l−1 and 500 g l−1, respectively. The microemulsion system consists of decane as the oil phase (continues medium), water as the disperse phase and an anionic surfactant, and Dioctyl sulfosuccinate sodium salt (AOT) as the stabilizer. All experiments are done at a constant water/surfactant ratio. The main variables in our experiments are the concentration of dye and the concentration of nanodroplets. Ultraviolet–visible (UV–Vis) spectroscopy, fluorescence spectroscopy and photon correlation spectroscopy (PCS) are employed to study the optical properties as well as the dynamical properties of the system. The quantum-mechanical second order perturbation theory is applied to describe to the red shift in the fluorescence spectra.
2. Experiments
Sodium-2-diethylhexyl sulfosuccinate, or AOT (99%), FSS, RhB and n-decane with purities of 99% were purchased from Sigma-Aldrich. Deionized and distilled water is used to prepare the aqueous solution of three different concentrations of FSS (0.04, 0.1 and 2.08 mM) and RhB (9.4 × 10⁻³ mM, 6.5 × 10⁻² mM, and 2 mM).
The final solutions were prepared by adding an aqueous solution of dye in solutions of AOT and n-decane. After waiting for several minutes, the samples were optically clear. All experiments were made 1 d after the sample preparation in order to ensure a homogeneous microemulsion and complete dye solubilization. The microemulsions are prepared by weight, in terms of a water to surfactant molar ratio of X = [H2O]/[AOT], (X = 40) and a mass fraction of nanodroplets of (mf = ( + MAOT)/(MTotal)), which varies by the respective mass of decane (MDec), water (
 ), AOT (MAOT) and total mass (MTotal). For each concentration of dye in water, the samples of microemulsions were prepared at different mass fractions of nanodroplets (0.01–0.15) and constant X = 40. The radius of microemulsions at X = 40 is 6.08 nm with polydispersity of 27% [34].
Absorption spectra of dye in microemulsion were recorded with a UV-1650 PC spectrometer (Shimadzu). Fluorescence spectra (excitation at 490 nm for solutions with FSS and 555 nm for solutions with RhB) were recorded with a Jasco FP-6200 spectrofluorimeter. The spectral measurements of all the samples were taken at room temperature. Photon correlation spectroscopy measurements were performed on the samples using a Malvern vertically polarized HeNe-laser (632.8 nm) as the light source. The beam was focused on a temperature-controlled (293.15 ± 0.1 K) sample cell (10 mm glass tubes).
3. Results
The absorption and fluorescence spectra of RhB and FSS are illustrated in figures 1–4, respectively. For both dyes, the molar ratio of water to surfactant was kept constant at X = 40 but the mass fraction of the nanodroplets was varied from 0.01 to 0.15. The concentrations of dye in the water phase ( ) for RhB were
  = 9 × 10⁻³, 6.5 × 10⁻² and 2.08 mM and for FSS were
  = 4 × 10⁻², 0.1 and 2 mM. We should note that the concentration of dye in the final microemulsion solution (CDinMic) depends on the mass fraction of the water nanodroplets in the microemulsion solution. We used the Gaussian model to find the peak of spectra. For both dyes, the wavelength of the absorption peak, λabs, remains constant while the absorption intensity changes with nanodroplet mass fraction. For all RhB samples, a peak can be observed in the absorption spectrum around λabs = 555 nm, which accounts for the red color of the dye. Figures 1(a)–(c) show for the higher
  of RhB the absorption is bigger. The absorption of RhB for 2.08 mM of microemulsion grow dramatically; thus above mfdrop > 0.03 our device could not measure the absorption spectrum of RhB. Almost the same behavior can be observed for FSS; thus the absorption of FSS for 2 mM is reported up to mfdrop = 0.1, and this shows a less dramatic change in absorption (figure 2). The FSS/microemulsion absorption spectrum shows an absorption peak at 490 nm for all concentrations of nanodroplets.
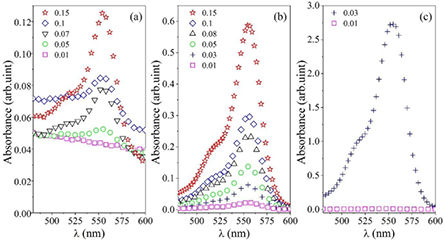
Figure 1. Absorption spectrum for AOT microemulsion mixed with RhB, at constant water to surfactant molar ratio X = 40, and different concentrations of nanodroplets (0.01–0.15),  = 9.4 × 10⁻³ mM, (a),
  = 6.5 × 10⁻² mM, (b) and
  = 2.08 mM, (c).
Download figure:
Standard image High-resolution image
Figure 2. Absorption spectrum for AOT microemulsion mixed with FSS, at constant water to surfactant molar ratio X = 40, and different concentrations of nanodroplets (0.01–0.15),  = 0.04 mM, (a),
  = 0.1 mM, (b) and
  = 2 mM, (c).
Download figure:
Standard image High-resolution image
Figure 3. The fluorescence spectrum of FSS at AOT microemulsion, at constant molar ratio (X = 40) and different concentrations of nanodroplets (0.01–0.15) at different concentrations of RhB/H2O  = 9.4 × 10⁻³ mM (a),
  = 6.5 × 10⁻² mM (b), and
  = 2.08 mM (c), excitation wavelengths 555 nm.
Download figure:
Standard image High-resolution image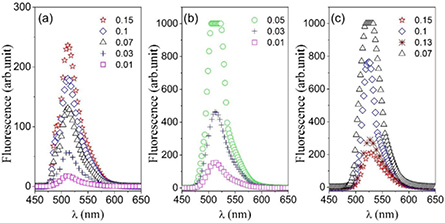
Figure 4. The fluorescence spectrum of FSS at AOT microemulsion, at constant molar ratio (X = 40) and different concentrations of nanodroplets (0.01–0.15) at different concentrations of FSS/H2O  = 0.04 mM (a),
  = 0.1 mM (b), and
  = 2 mM (c), excitation wavelengths 490 nm.
Download figure:
Standard image High-resolution imageThe intensity (Fpeak) and wavelength (λem) of the fluorescence peak varies upon changing the  and the mfdrop. The Fpeak of dye in water and microemulsion for the same concentration in the solution showed a very different trend depending on the type of dye. RhB showed higher fluorescence activity in the microemulsion compared to water while FSS shows an opposite behavior. The fluorescence spectrum of RhB showed a red shift for two higher concentrations (table 1), which is more pronounced for
  = 2.08 mM. The Fpeak (for RhB) is increased for
  = 9 × 10⁻³ mM and 6.5 × 10⁻² mM by increasing the mass fraction of the nanodroplets but an opposite trend was observed for
  = 2.08 mM. The fluorescence spectra of FSS show more complex behavior for
  = 2 mM at mfdrop = 0.07, and for
  = 0.1 mM at mfdrop = 0.03 our detector was saturated due to the high intensity of the peaks. The wavelength of the peak (λem) remains constant for two lower
  but show a red shift for
  = 2 mM.
Table 1. νa − νf (cm−1), νa + νf (cm−1), ratio of dipole moments  /
/ , the wavelength maximum of the absorption, λabs, and emission, λem, of RhB mixed with microemulsion, for different concentrations of nanodroplets (mfdrop) at three
  of 9.4 × 10⁻³ mM, 6.5 × 10⁻² mM and 2.08 mM.
 (mM) (mM) |
mfdrop | λabs (nm) | λem (nm) | νa − νf (cm−1) | νa + νf (cm−1) | m2 /m1 | μe /μg |
|---|---|---|---|---|---|---|---|
| 9.4 × 10⁻³ | 0.15 | 555 | 572 | 535.5 | 35 500.5 | 3.5 | 1.8 |
| 0.03 | 555 | 572 | 535.5 | 35 500.5 | 3.5 | 1.8 | |
| 6.5 × 10⁻² | 0.15 | 555 | 575 | 626.7 | 35 409.3 | 3.08 | 1.96 |
| 0.05 | 555 | 572 | 535.5 | 35 500.5 | 3.50 | 1.8 | |
| 2.08 | 0.01 | 555 | 576 | 656.91 | 35 379.13 | 2.96 | 2.02 |
| 0.03 | 555 | 583 | 865.36 | 35 170.68 | 2.39 | 2.43 | |
| 0.05 | 555 | 587 | 982.24 | 35 053.8 | 2.19 | 2.68 | |
| 0.07 | 555 | 590 | 1068.87 | 34 967.17 | 2.06 | 2.88 | |
| 0.1 | 555 | 596 | 1239.49 | 34 796.54 | 1.87 | 3.31 | |
In order to trace the dye in the oil phase, photon correlation spectroscopy was performed. Figure 5 illustrates the first-order correlation function for both RhB and FSS at 2 mM. We can see that the correlation curve of both dyes can be fitted by a single exponential.

Figure 5. The first-order correlation function for RhB (square) and FSS (circle). The solid lines are stretched exponential fits.
Download figure:
Standard image High-resolution image4. Discussion
In the preparation process, both dyes are dissolved in water then mixed in a solution of surfactant and oil. Even if the concentration of dye is much below the saturation there is still a possibility that some dyes move to the oil phase. This can be examined using the first-order correlation function. In the case of the formation of aggregating dye in the oil phase, a second stretched exponential is needed to fit the data. Using this concept the PCS technique was applied to all the samples and we could not observe any aggregation in the oil phase (figure 5). Therefore, one can safely conclude that RhB and FSS molecules are all located in the water phase in this work.
The dependency of the λmax of the absorption spectrum for both dyes at three  and different mass fractions of nanodroplets are shown in figures 6 and 7. We note that even if the concentration of dye in water (
 ) is constant, the concentration of dye in the microemulsion changes by increasing the mass fraction. A simple calculation shows that in a constant
  , the concentration of dye in the microemulsion (weight concentration) has a linear relationship with the mass fraction of the nanodroplets (the weight concentration of dye in the microemulsion
  ). For all dye concentrations, a linear behavior is observed for the absorption, which indicates the absorption of the solutions obeyed the Beer–Lambert law over the nanodroplets concentration range of 0.01–0.15 [35, 36]. Additionally, the slope of absorption versus concentration increases dramatically at an elevated concentration of dye in water, which could be due to higher scattering.
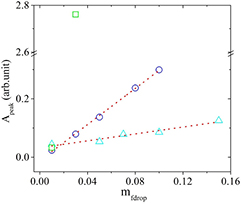
Figure 6. Peak of absorption (Apeak) versus concentrations of nanodroplets (mfdrop) of the AOT microemulsion mixed with RhB. Concentrations of RhB/water,  = 0.9 × 10⁻² mM (triangle),
  = 6.5 × 10⁻² mM (circle) and
  = 2.08 mM (square). The dotted lines are present to guide the eyes.
Download figure:
Standard image High-resolution image
Figure 7. Peak of absorption (Apeak) versus concentrations of nanodroplets (mfdrop) of the AOT microemulsion mixed with FSS. Concentrations of FSS/water,  = 0.04 mM (triangle),
  = 0.1 mM (circle) and
  = 2 mM (square). The dotted lines are present to guide the eyes.
Download figure:
Standard image High-resolution imageAs we mentioned before λem changes at  = 6.5 × 10⁻² and 2.08 mM and
  = 2 mM for RhB and FSS, respectively. The Stokes shift of the fluorescence spectra is often interpreted in terms of the quantum-mechanical second-order perturbation theory [23, 37]. The absorption wavenumber and fluorescence wavenumber in the samples can be described by the following equations:


which are obtained based on the quantum mechanical perturbation theory, and νa and νb are 1/λa and 1/λb, respectively. f (ε, n) and g(n) are defined as the following:

and
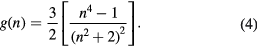
Here ε and n are the permittivity and refractive index of the solvent, respectively. The parameters  and
and  can be determined from the absorption and fluorescence band shifts (νa − νb and νa + νb) of following equations:

and

Where c is the velocity of light in vacuum and h is Planck's constant,  and
and  are the dipole moments in the ground and excited states, respectively [23, 37].
As the medium of dyes is always the same the refractive index is constant for all samples. We measure the refractive index of the bulk solution, which remains constant within four digits of accuracy. However, depending on the position of the dye in the nanodroplet the permittivity (ε) and refractive index (n) (in their micro environment) might change slightly but in this work, we assumed that these changes are negligible. Additionally, our assumption is backed up by the behavior of absorption, because if a change exists in the refractive index of the solution one should expect a deviation from the Beer–Lambert law, which is not the case (figures 6 and 7). By using equations (5) and (6), the ratio of the dipole moment of the excited state to the ground state (μe/μg) can be calculated. For all the samples, the refractive index and the dielectric constant of water are used, which leads to a constant of g(n) and f (ε, n). Therefore, according to perturbation theory (equations (1)–(6)) if n and ε are assumed to be constant the Stokes shift must be due to the change in the dipole moment of dye in nanodroplets. The ratio of ground to excited dipole moments μe/μg is obtained and presented in tables 1 and 2. In general, the νa − νb increases with the increase in the concentration of nanodroplets and νa + νb, decreases in higher concentrations of nandroplets. Our results show that the dipole moment at the excited state is larger than the dipole moment in the ground state.
Table 2. νa − νf (cm−1), νa + νf (cm−1), ratio of dipole moments  /
/ , the wavelength maximum of the absorption, λabs, and emission, λem, of FSS mixed with microemulsion for different concentrations of nanodroplets (mfdrop) at three
  of 0.04 mM, 0.1 mM and 2 mM.
 (mM) (mM) |
mfdrop | λabs (nm) | λem (nm) | νa − νf (cm−1) | νa + νf (cm−1) | m2/m1 | μe/μg |
|---|---|---|---|---|---|---|---|
| 0.04 | 0.03 | 490.2 | 512 | 868.6 | 39 931.1 | ||
| 0.15 | 490.0 | 512 | 876.9 | 39 939.4 | |||
| 0.1 | 0.01 | 490.6 | 512 | 851.9 | 39 914.4 | ||
| 0.03 | 490.6 | 512 | 851.9 | 39 914.4 | |||
| 2 | 0.01 | 491.2 | 521 | 1164.45 | 39 552.16 | 0.13 | 1.30 |
| 0.05 | 490.8 | 522 | 1217.81 | 39 531.99 | 0.15 | 1.36 | |
| 0.1 | 490.0 | 525 | 1360.54 | 39 455.78 | 0.21 | 1.54 | |
| 0.15 | 489.4 | 528 | 1493.79 | 39 372.58 | 0.27 | 1.73 | |
The peak of fluorescence as a function of the mass fraction of the nanodroplets shows two different behaviors, figures 8 and 9. The results show that for both dyes the two lower value of  , the maximum intensity of fluorescence versus the concentration of nanodroplets has a positive slope but the highest
  has a negative slope. This change in the behavior can be due to several reasons. For example, it has been shown that the microviscosity of AOT reverse micelles can affect the fluorescence spectrum [38] because the quantum efficiency of dye in the microemulsion is a function of the internal rotation, which is hindered in higher viscosity. However, for the water/AOT/decan microemulsion the change in viscosity occurs at the molar ratio around X = 6.7 but for X = 40 viscosity remains almost constant in different mass fractions [40, 41]. Two other possible reasons for this behavior can be Raleigh scattering and enhanced quenching due to the higher concentration of dye molecules.
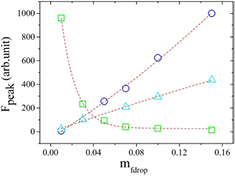
Figure 8. Variation of the peak of fluorescence (Fpeak) as a function of the mass fraction of nanodroplets for different concentrations of RhB, with  = 6.5 × 10⁻² mM (triangle),
  = 9.4 × 10⁻³ mM (circle) and
  = 2.08 mM (cubic). The dotted lines are present to guide the eyes.
Download figure:
Standard image High-resolution image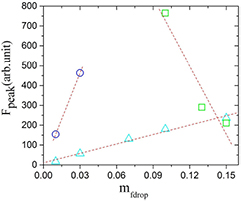
Figure 9. Variation of the peak of fluorescence (Fpeak) as a function of the mass fraction of the nanodroplets for different concentrations of FSS, with  = 0.04 mM (triangle),
  = 0.1 mM (circle) and
  = 2 mM (cubic). The dotted lines are present to guide the eyes.
Download figure:
Standard image High-resolution imageOne noticeable difference between these two xanthene dyes is the change in their fluorescence activity in water and microemulsion solution (figures 10 and 11). RhB shows an increase in fluorescence activity while it is encapsulated in microemulsion but FSS shows an opposite trend (figures 10 and 11). The most obvious difference between these two dyes is their solubility in water, which is almost 40 times more for FSS compared to RhB so FSS is much more hydrophilic than RhB (RhB has a much lower solubility in water compare to FSS, 12 g l−1 and 500 g l−1, respectively). Elsewhere it has been shown that the less hydrophilic dyes tend to place themselves near the surfactant [24]. This behavior leads to less aggregation, which eventually is responsible for lower quenching. For a better understanding, we used a regression method in the linear region (two lower  ) and calculate the intensity of fluorescence at constant
  for different mfdrop. Figure 12 shows that for a constant
  the intensity of the fluorescence of RhB increases by increasing the mass fraction of the microemulsion. This means that RhB dyes are distributed in different nanodroplets and decreases the aggregation and quenching process. In contrast water is a very good solvent for FSS as a consequence it has much less tendency to associate with the surfactant. Therefore, we do not expect that surfactant has any significant effect on the fluorescence activity of FSS by decreasing dye aggregation. We used same regression technique and calculate the fluorescence intensity at a constant
  for the different mass fractions of nanodroplets. Figure 13 shows that at a constant
  increasing the mass fraction leads to a decrease in the fluorescence intensity. We should note that the scattering center always increases by increasing mfdrop so part of the fluorescence intensity is scattered away from the detector. This can be the reason behind the lower fluorescence activity for FSS in the microemulsion system. However, in the case of RhB, the higher fluorescence activity due to less dye aggregation is a dominate factor in the comparison with the scattering losses.
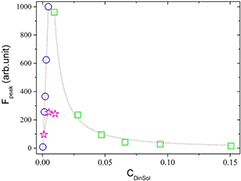
Figure 10. The peak of RhB fluorescence as a function of CDinSol, which is the amount of dye/solvent. Two of which show the intensity of fluorescence peak in microemulsion as solution with  = 6.5 × 10⁻² mM (circle) and
  = 2 mM (square)—two phase liquid (CDinSol when the solution is microemulsion is CDinMic). The intensity of fluorescence peak in water (stars) as solution—just one water phase liquid. The dotted lines are present to guide the eyes.
Download figure:
Standard image High-resolution image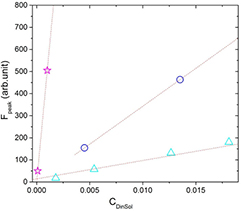
Figure 11. The peak of FSS fluorescence as a function of CDinSol, which is the amount of dye in the solvent. Two of which show the intensity of fluorescence peak in microemulsion as solution with  = 0.04 mM (open triangle) and
  = 0.1 mM (open circle)—two phase liquid (CDinSol when the solution is microemulsion is CDinMic). The intensity of fluorescence peak in water (stars) as solution—just one water phase liquid. The dotted lines are present to guide the eyes.
Download figure:
Standard image High-resolution image
Figure 12. The calculated Fpeak of RhB at a constant concentration of dye in microemulsion (constant CDinMic) for different mass fractions of nanodroplets.
Download figure:
Standard image High-resolution image
Figure 13. The calculated Fpeak of FSS at a constant concentration of dye in microemulsion (constant CDinMic) for different mass fractions of nanodroplets.
Download figure:
Standard image High-resolution image
5. Conclusion
Encapsulation of dyes is a way to modify dye properties for various applications. In this study, we confined RhB and FSS dyes in reverse microemulsion (water/AOT/decane). The fluorescence activity of RhB in the microemulsion is enhanced compared to water but FSS fluorescence intensity demonstrated an opposite behavior. We attributed this behavior to their hydrophilicity, due to the low solubility of RhB the aggregation probability in water is much higher than in FSS. Thus using microemulsion prevented dimerization of RhB molecules at an elevated concentration in the solution. But as FSS is hydrophilic microemulsion does not change its aggregation behavior. The fluorescence intensity of FSS decreases because nanodroplets act as a scattering source, which leads to a decrease in the amount of fluorescence light in the detector. In general, we showed that one can increase the fluorescence activity of less hydrophilic dye by simply dissolving it in a reverse microemulsion system and increasing the concentration of nanodroplets. In this approach, the concentration of dye in the solution remains constant but the fluorescence intensity increases by distributing them in different nanodroplets. This can provide an easy and practical way for a laser system or detecting a low amount of dyes in a solution (figure 12).