

Abstract
Intraocular pressure (IOP) is a crucial physiological indicator for the diagnosis and treatment of glaucoma. The current infrequent IOP measurement during an office visit is insufficient to characterize the symptoms. Here, an LC resonator strain sensor in a contact lens, composed of a stretchable inductance coil using liquid metal and a chip capacitor, was developed for real-time IOP monitoring. The lens sensor was operated on the basis of 'mechanical-electrical' principle. The rising IOP will increase the curvature radius of the cornea and stretch the inductance coils through the cornea and tear film, leading to a decrease in resonant frequency. The theoretical model of the whole process has been established and explored. The sensor has been scientifically designed and fabricated to be ultra-soft, comfortable, safe without leakage and has a stable signal. The sensor was calibrated on two silicone rubber model eyeballs, respectively, showing linear and stable responses. An experiment on porcine eyes in vitro was conducted. The sensor can track IOP changes and shows much higher sensitivity than the current mainstream lens sensors, which is even an order of magnitude higher than the existing inductive sensor. The high-sensitivity and ultra-flexible liquid-metal-based lens sensor is a promising approach for 24 h continuous IOP monitoring in clinics.
Export citation and abstract BibTeX RIS
1. Introduction
Intraocular pressure (IOP) is a crucial physiological indicator for the human visual system. It is a sign of glaucoma progression and also important evidence for glaucoma diagnosis and treatments [1, 2]. The excessively high IOP and abnormal IOP fluctuations can harm and damage the human optic nerve, leading to gradual irreversible blindness [3, 4]. Careful monitoring and lowering of IOP are of great significance to prevent further optic nerve injury or even blindness [5]. Currently, Goldmann tonometry, the gold standard for IOP measurement, can only provide snapshots of IOP profile [6]. Human IOP fluctuates during the day and night. It can be influenced by the person's routine activities (e.g. diet, exercise, etc). Peak IOP usually occurs at night during sleep [7, 8]. So, infrequent measurement during office hours is not sufficient to characterize the symptoms of diseases. A study has shown that 24 h IOP monitoring would lead to an advance in early clinical glaucoma detection, which could change the glaucoma treatment in almost 80% of cases [9]. This is of major significance and there is a great need for 24 h continuous IOP monitoring [10].
Some implantable MEMs devices have been developed for continuous and wireless IOP measurement, including passive and active methods. These devices [11–16] can measure IOP directly, but their implantation processes are invasive and require surgery, making them unacceptable to most people. On the other hand, non-invasive methods with embedding sensing elements on the contact lens have also been investigated, including microfluidic sensors with passive visual readout [17–19] and various electronic wireless sensors [20–24]. Since the electronic wireless contact lens sensors can achieve 24 h IOP monitoring without affecting sleep, they are closer to meeting actual demand. There are various electronic wireless sensor prototypes, such as a resistive-strain-based flexible contact lens produced in 2009 [20], a capacitive-based contact lens sensor in 2013 [21], a micro-capacitive-based contact lens sensor in 2016 [22], an inductive-based LC wireless contact lens sensor in 2015 and recently [23, 24]. These sensors are specially designed and exhibit stable sensing capabilities for IOP. However, their flexibility and sensitivity are very limited, mainly due to the high stiffness of the electronic sensitive elements.
In recent years, wearable soft electronics using room-temperature liquid metals (EGaIn and Galinstan) as sensitive materials have rapidly been produced and exhibit many promising applications [25, 26], for example, tactile sensors [27–29], pulse monitoring [30], motion attitude detecting [31], etc. Room-temperature liquid metals have excellent conductivity, low viscosity and high stability. In addition, they have ultra-low elastic modulus (approximately 0 KPa) due to their liquid property [32, 33]. These characteristics make the wearable electronics developed by them have many advantages, such as being ultra-flexible and extremely comfortable to wear, and having high sensitivity, high reliability, etc [30, 34].
Here, by using room-temperature liquid metal (Galinstan) as a sensitive material, a new inductive LC strain sensor in a contact lens is proposed for wireless and continuous IOP measurement. The sensing mechanism was theoretically modeled and explored. Based on the model, the sensor was scientifically and carefully designed and fabricated, to ensure its ultra-flexibility, safety and stability. Besides, a portable wireless measurement module, coupled with a sensor to form an IOP measuring system, was developed for continuous, low-cost and convenient response detecting. The sensing system was calibrated on silicone rubber model eyes and then tested on porcine eyes in vitro to demonstrate the adaptability and utility for clinical applications. The sensor could track IOP changes and showed excellent sensitivity.
2. Materials and methods
2.1. Modeling and design
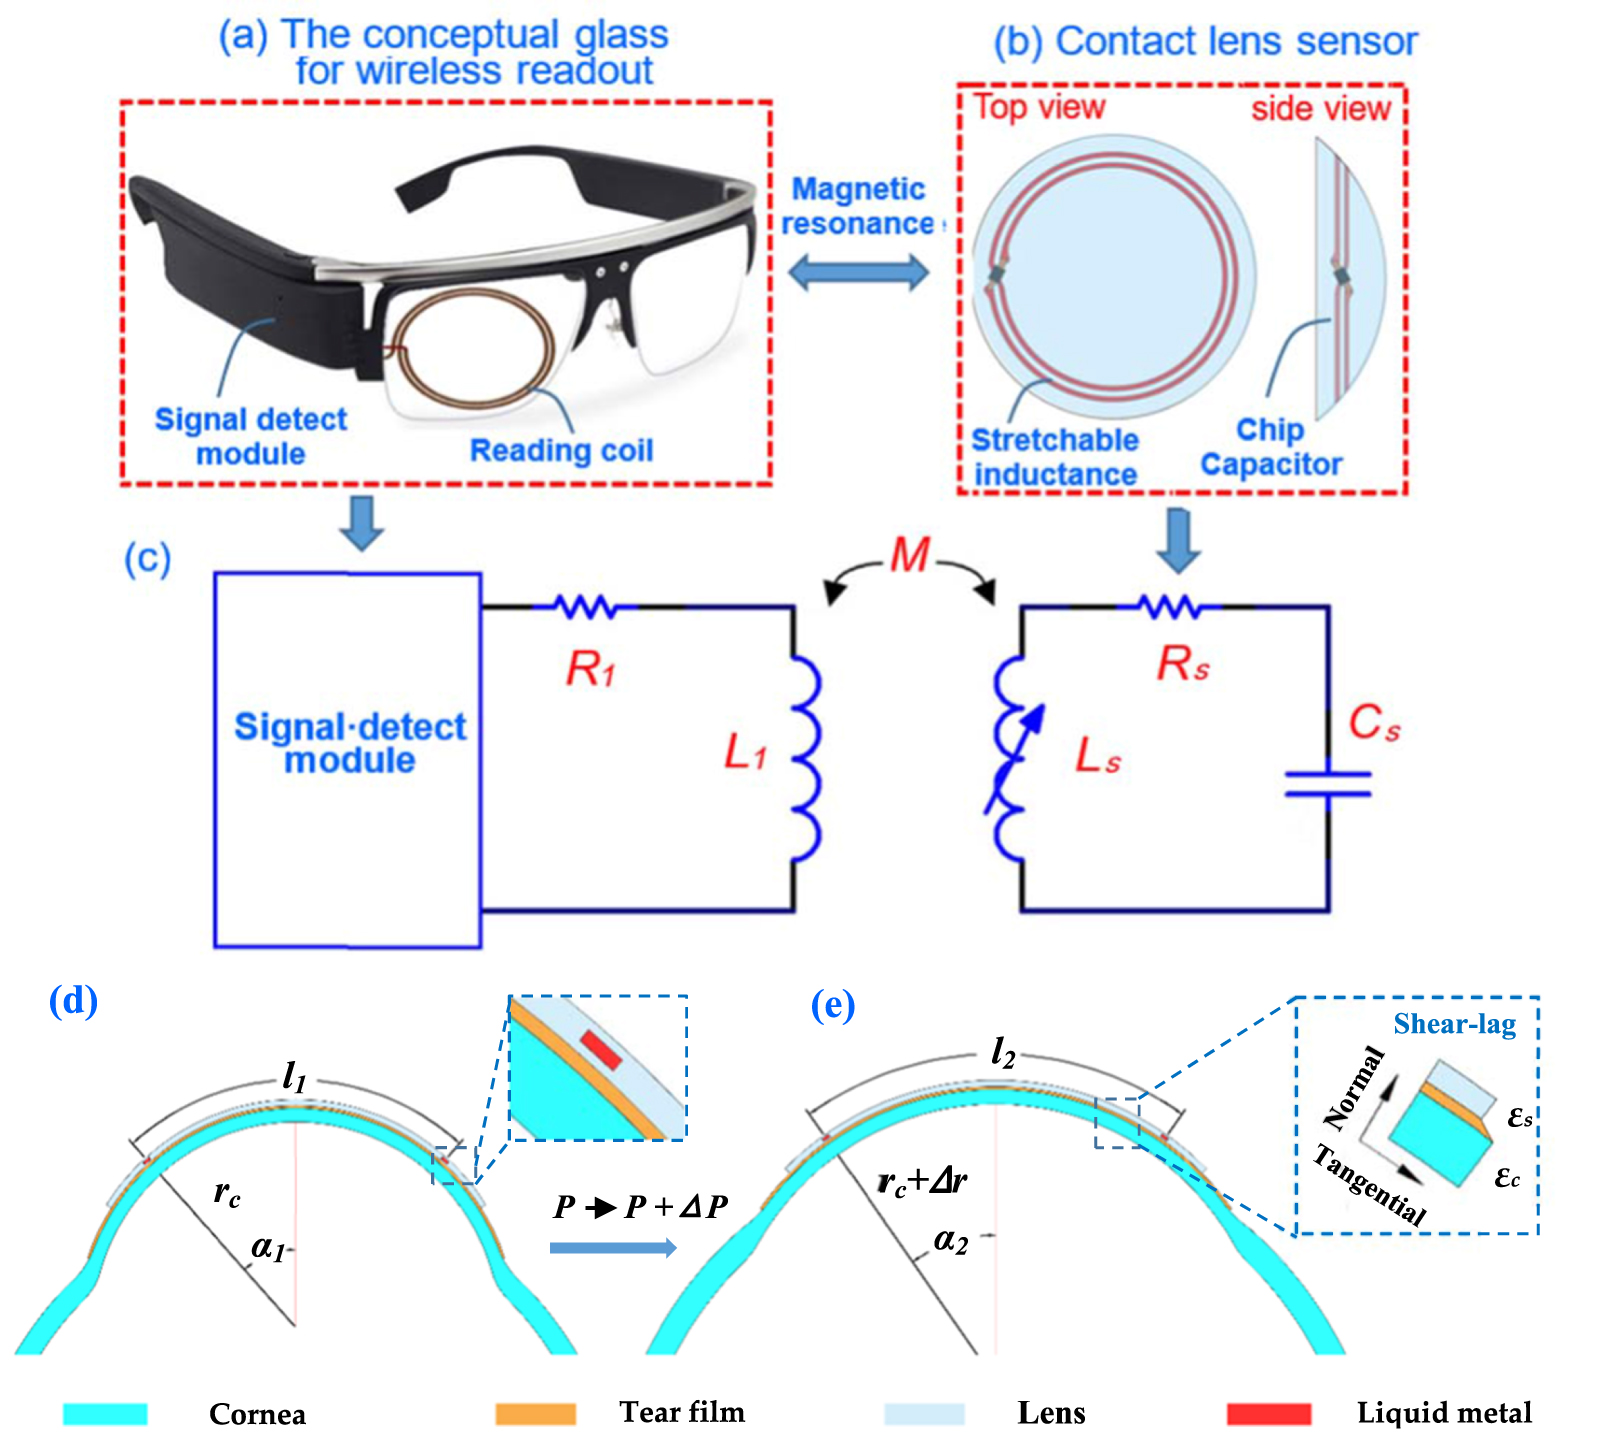
As shown in figures 1(a) and (b), the proposed IOP monitoring system consists of a lens sensor and conceptual glasses reader. The wireless reader comprises a reading coil and signal measuring module. The lens sensor was integrated with a stretchable inductance coil using liquid metal and a chip capacitor, which forms an LC resonator. A near-field magnetic coupling between the reading coils and sensor coils was formed, so the detect module could work to measure the signal of the LC resonator.
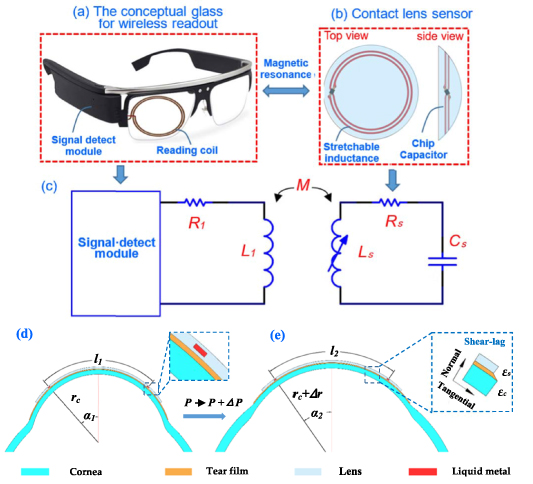
Figure 1. (a) Conceptual glass for wireless readout, (b) liquid-metal-based inductance sensor in a lens with top view and side view, (c) the equivalent circuit model of the whole wireless IOP sensing system, (d) and (e) diagrams illustrate the parameter changes of the 'corneal-tear film-contact lens' overall with IOP increase from  to
to  . Smaller changes illustrate the shear-lag in the tangential direction.
Download figure:
Standard image High-resolution imageFigure 1(c) shows the whole equivalent circuit model of the IOP sensing system, including the sensor circuit and reading coil circuit. The right-hand side represents the lens sensor and its resonance frequency can be expressed as:
if
where  ,
,  and
and  are the resistance, inductance and capacitance of the lens sensor, respectively, and
  represents its quality factor. The inductance
  can be calculated using a simple planar spiral coil model [35] as follows:
where  is the average diameter of the coils,
  is the fill ratio of the coils,
  is the outer coil diameter,
  is the inner coil diameter,
  is the magnetic permeability and
  is the number of turns of the coils.
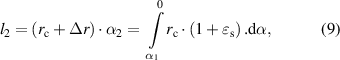
Figures 1(d) and (e) show the working principles of the lens sensor. For the 'corneal-tear film-contact lens' overall, when IOP is applied on the eyeball wall and increases from  to
to  , the corneal curvature radius will increase (from
  to
to  ) and tangential stretch deformation will occur. Using a spherical shell model [36, 37], the increment of the radius
  and tangential strain (
 ) of each point on the corneal spherical shell can be presented as follows:
where  ,
,  and
and  represent the elastic modulus, Poisson's ratio and thickness of the cornea, while
  and
and  are the elastic modulus and thickness of the contact lens.
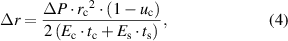
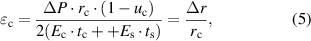
Tear film, covering the front surface of the cornea, is composed of a lipid layer (0.05–0.5 μm), an aqueous layer (6–10 μm) and a mucin layer (15–25 μm) from the outside to the inside [38]. Blinking and corneal dilation under IOP action will normally squeeze out the lipid and aqueous layer from the edge of the lens, due to their fluid properties. Then, the mucin layer in the tear film will connect the contact lens sensor and cornea. Mucin layer is a kind of protein hydrate with high viscosity. It can be modeled as a viscoelastic solid to transfer the corneal deformation to the lens [39]. So, the contact lens sensor follows to deform and stretch, and its curvature radius changes in the same way as the cornea (from  to
to  ). At the same time, the tangential strain of each point on it is
  . According to strain transfer theory [40, 41], the tangential strain of each point on the lens has a relationship with the tangential strain of the cornea
  as follows:
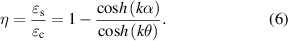
And
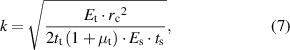
where  is the strain transfer efficiency,
  is the radian corresponding to the central axis of each point on the lens and
  is the arc of the lens edge to the central axis.
  ,
,  and
and  represent the elastic modulus, thickness and Poisson's ratio of the tear film.
  represents the stiffness of corresponding points on the lens. When the lens curvature radius changes from
  to
to  , the meridional arc length of inductance changes from
  to
to  . The radian of inductance changes from
  and
and  , and the diameter of the inductance coil changes from
  . They have geometric relationships as follows:


According to formula (3), the inductance change rate can be calculated as:
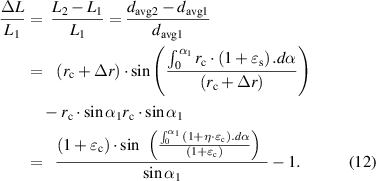
Furthermore, according to formula (1), the change rate of the resonance frequency ( ) and device sensitivity (
 ) can be as follows:
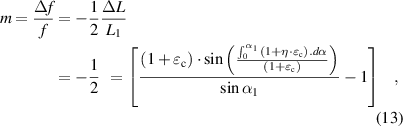
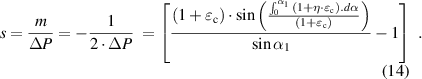
Formula (13) indicates that the frequency change rate is related to the corneal tangential strain , strain transfer efficiency (
 ) and initial arc of the inductance coil (
 ). On the basis of formulas (4)–(7) and (10),
  ,
,  and
and  are related to IOP, the cornea, tear film and lens sensor. So, referring to existing researches on material and dimension parameters of the human tear film and cornea [39], some parameters could be set as:
  ,
,  ,
,  , the frequency change rate can be explored on the influence of IOP (
 ), sensor stiffness (
 ), inductance coil diameter
  and corneal stiffness (
 ). The cross-section (its width and height) of the liquid-metal coil is much smaller than that of the lens. Meanwhile, the elastic modulus of liquid metal is small enough, so the stiffness of the liquid-metal coil is insignificant. Therefore, we consider the liquid-metal-filled area as a silicone material for calculation.
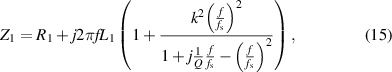
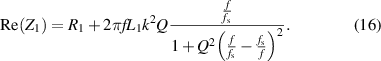
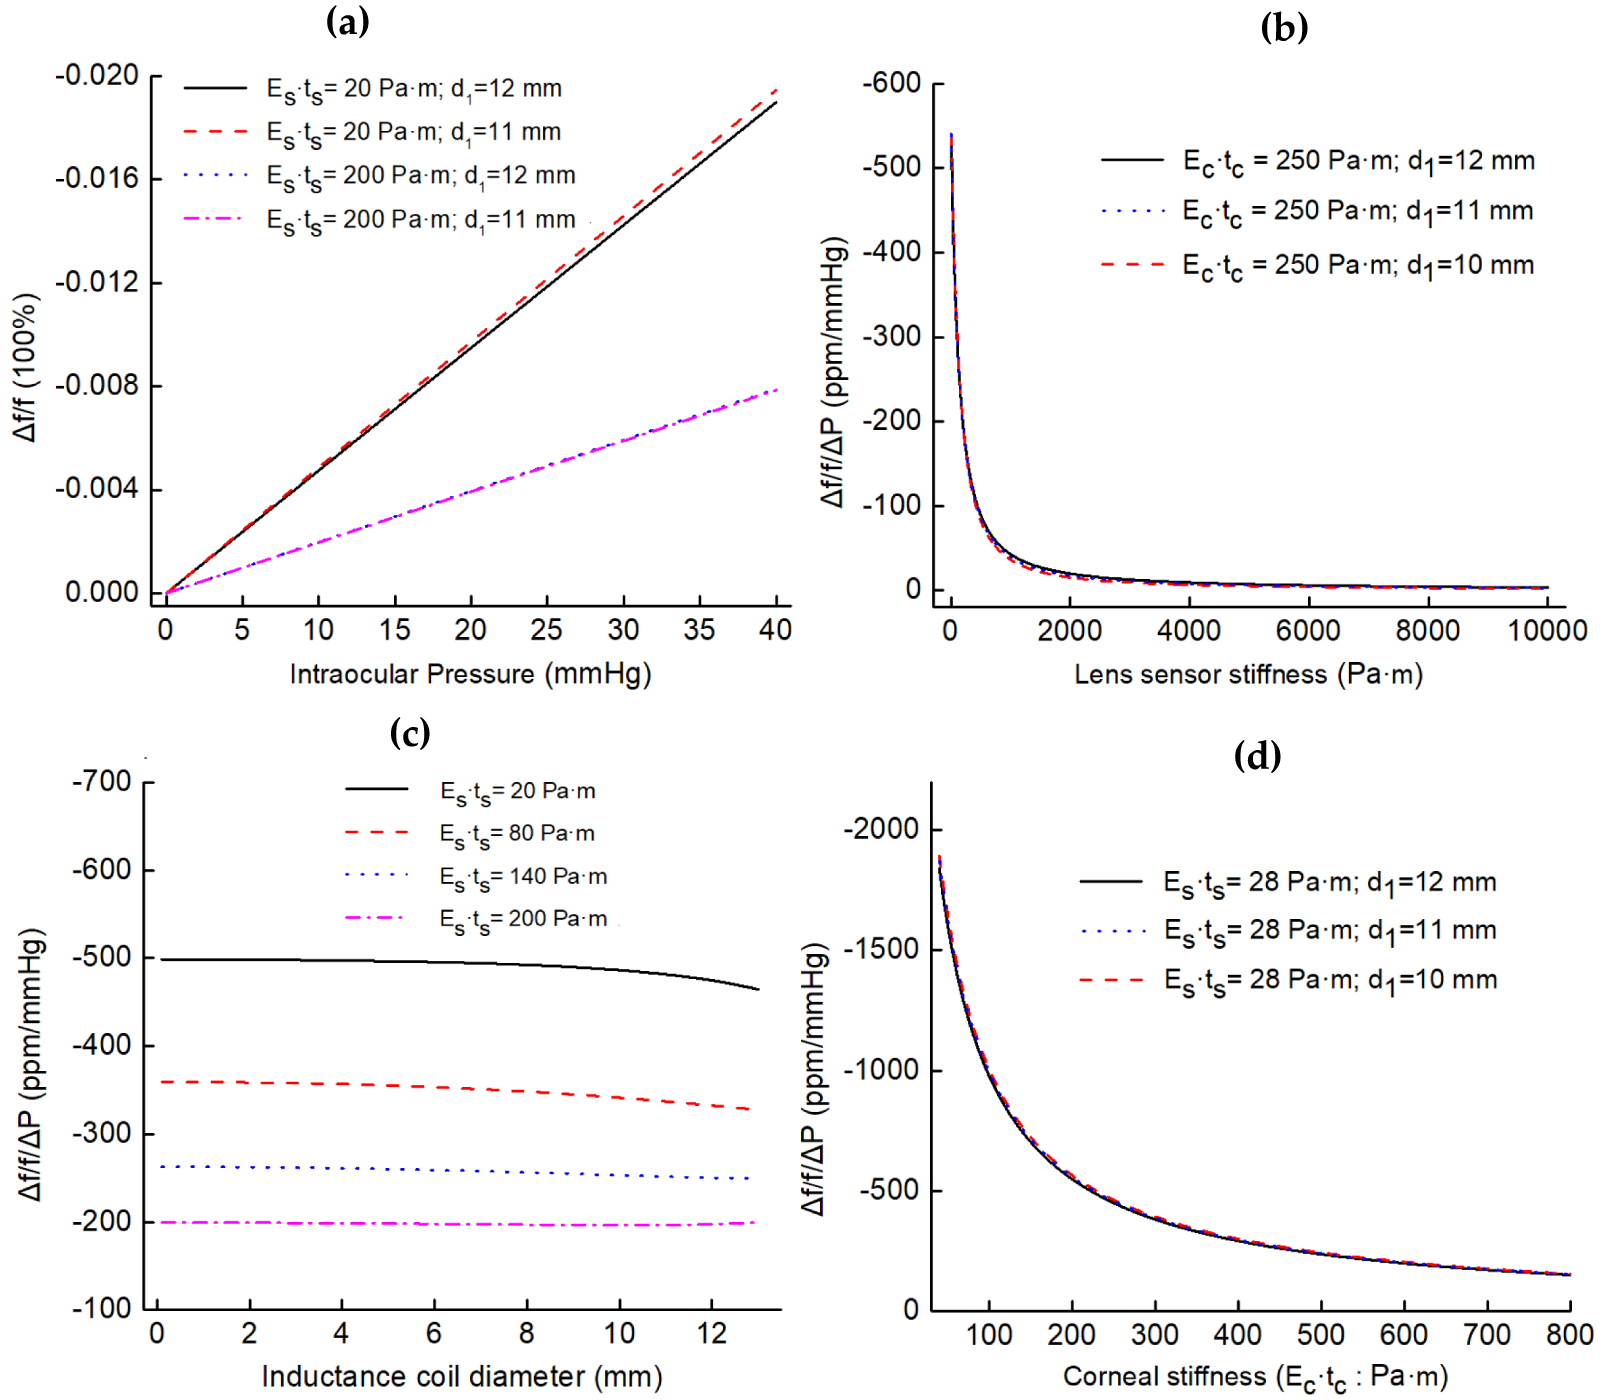
Figure 2 shows the theoretical simulation results. Figure 2(a) shows the IOP influence. The four lines indicate that, when the corneal stiffness ( ) remains stable, the change rate of resonance frequency varies linearly with pressure. Figure 2(b) shows the effects of lens sensor stiffness (
 ) on response (
 ); as the stiffness of the lens increases, the response decreases nonlinearly. Under low stiffness, the response decreases sharply with the increase of stiffness, while under high stiffness, the response basically does not change with the increase of stiffness. Reduced lens stiffness leads to increased sensitivity, so a transparent medical-grade silicone rubber (MED-4286, Nusil, America), which is ultra-soft, highly oxygen permeable and hydrophilic (after oxygen plasma surface treatment), has been chosen to encapsulate liquid metal in the lens. Figure 2(c) reveals the influence of the coil diameter. The four lines are basically flat, indicating that different inductance coil positions have little effect on sensor response. Therefore, it is better to design the coils close to the lens edge (this does not affect vision). Therefore, two loops of liquid-metal inductance are designed with diameters of 11 and 12 mm, respectively. The parameters of the lens sensor were designed as listed in table 1.
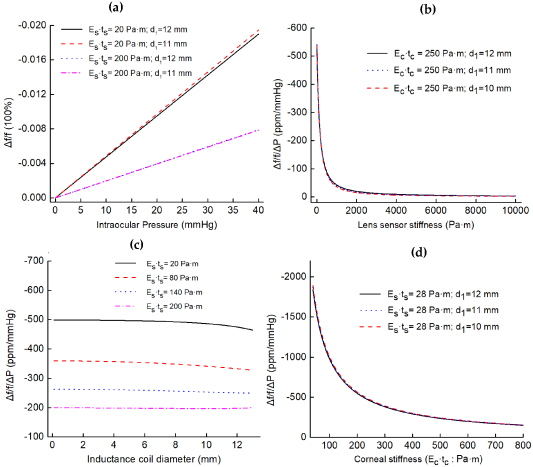
Figure 2. (a)–(c) Graphs show the effects of IOP ( ), lens sensor stiffness (
 ) and inductance coil positions (diameter:
  ), respectively, on the device response (
 ) with different settings, corneal stiffness setting the same as
  ; (d) graph shows the sensor responses vary with different corneal stiffness (
 ).
).
Download figure:
Standard image High-resolution imageTable 1. Design parameters of the liquid-metal-based inductance sensor in the lens.
| Parameters | Value |
|---|---|
| Contact lens diameter (mm) | 14.0 |
| Curvature radius (mm) | 8.0 |
| Thickness of contact lens (mm) | 0.4 |
| Elastic modulus of MED-4286 (MPa) | 0.07 |
| Diameter of inductance coils (mm) | 12.0 and 11.0 |
| Inductance (nH) | 116 |
| Capacitance (pF) | 6 |
| Quality coefficient | ∼150 |
| Resonance frequency (MHz) | ∼190 |
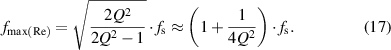
Figure 2(d) shows the influence of corneal stiffness ( ) on response. The three lines indicate that the device responses decrease with the increase of corneal stiffness, similar to the non-linear changes caused by lens stiffness. Furthermore, studies have shown that individual differences in corneal stiffness occur in different people, which may be affected by age, gender, disease, etc [42, 43]. With reference to the existing research on human cornea biomechanics [44], the average corneal elastic modulus of different people is calculated to be between 0.329–0.561 MPa (with IOP between 0–40 mmHg). In addition,
  is set to
  because the thickness of the human cornea is between 500–600
  . Therefore, within the pressure range, the average sensitivity can be calculated to be between 372.5–597.5 ppm mmHg−1.
2.2. Wireless readout
According to the overall circuit in figure 1(c), the equivalent impedance  can be expressed as:
where  and
and  are the resistance and inductance of the reading coils, respectively,
  is the excitation frequency exerted by the signal measuring module,
  is the coupling coefficient influenced by the distance and angle between the reading coils and lens sensor coils, and
  is the resonance frequency modulated by IOP. The real part of equivalent impedance can be expressed as:
To detect the resonant frequency by searching for the peak value of  , the derivative of
  is set to zero and yields an expression for
  . A Taylor series expansion provides a simple approximate relationship between
  and
and  .
.
The result indicates that  is only related to the intrinsic parameters of the LC sensor,
  and
and  . Generally,
  , so the term
  can be neglected and
  can be used for analysis.
Based on the above, a vector network analyzer (VNA; Ceyear 3656D, China) was first adopted to detect the signal. But the VNA does not meet the future need for portability. So, a portable measurement circuit module has been developed. In the measurement module, the signal acquisition circuit has been integrated into two small PCBs and can detect the impedance real part. It can distinguish the resonant frequency automatically and transmit it to the host computer through Bluetooth. Two loops of reading coil (diameters of 20 and 22 mm) are integrated into the eye mask. The maximum reading distance between the developed measuring module ande sensor is 10 mm, consistent with the wearing distance of glasses. The RMS current of the reading circuit is 1.6 mA (<40 mA), satisfying the human RF standard [45]. These ensure continuous, low-cost and convenient IOP monitoring.
2.3. Fabrication of the lens sensor
Figure 3 illustrates the three steps to fabricate the liquid-metal lens sensor.
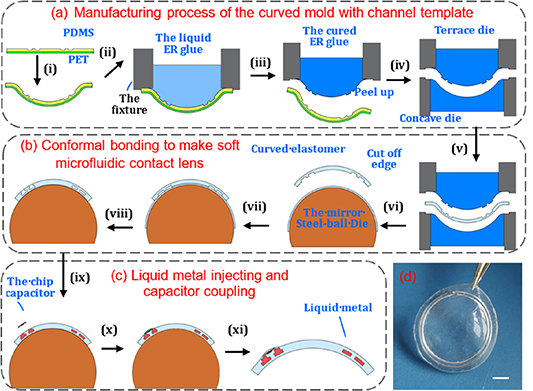
Figure 3. Schematic illustration of the lens sensor fabrication. (a) Schematic of the process flow for manufacturing the curved mold with a channel template; (b) conformal bonding process flow for making a soft microfluidic lens; (c) schematic of the liquid-metal injecting and capacitor coupling; (d) picture shows the real device with a scale bar of 2 mm.
Download figure:
Standard image High-resolution imageFirst, a curved mold with a channel template (figure 3(a)) was fabricated. A patterned PET-PDMS was assembly thermoformed into a spherical cap (its curvature radius is 8.0), in which the microchannel-free side of the PDMS film (fabricated by using soft lithography, thickness: 0.5 mm) was irreversibly bonded with a PET membrane (thickness: 0.1 mm). The channels would stretch and deform after being thermoformed. According to the results of our previous study [46], the channel sizes had been adjusted in plane to 300 × 115 and 280 ×119 μm for two loops, respectively. Then, the channel sizes of the device changed close to the designed 400 ×100 μm after being thermoformed. The thermoformed device was fastened to a fixture tube. Then, the tube was filled with a transparent liquid epoxy resin (H0656-Y, Jitian Chemical Industry, Shenzhen, China) after being mixed (A:B = 3:1) and degassed. The liquid epoxy resin solidified naturally at room temperature for 24 h. After the patterned PET-PDMS assembly was taken away, a spherical cap (a curved mold, the curved epoxy resin) was made successfully. It was used as the terrace mold. The silicone rubber can be easily peeled off from the epoxy resin surface, so the curved mold can be remanufactured. Another channel-free mold with a curvature radius of 8.25 mm was manufactured in the same way and served as a concave mold.
Second, conformal bonding was used to make the microfluidic lens [47] (as shown in figure 3(b)). The concave mold and terrace mold were made up to fabricate the curved soft elastomer (MED-4286) by thermosetting. The curved soft elastomer, which contained the channel patterns, was prepared with a thickness of 0.25 mm. Its edge was cut off after being peeled off from the terrace die. Moreover, another curved film of soft elastomer (thickness: about 0.15 mm, without channel patterns) was prepared on a super smooth steel-ball die (curvature radius: 8.0) through a series of dropping, spinning and curing operations. After that, corona treatment was used to modify the surface, and then the cut soft elastomer was immediately put on the super smooth die to bond conformably with the smooth film. After being heated to form irreversible bonding, the device edge was cut off (with a diameter of 14.0 mm) and holes punched by a laser. Then, a soft microfluidic lens with an enclosed channel was prepared.
The final step is illustrated in figure 3(c), in which Galinstan (from Zhongxuan Company, Yunnan, China) was first injected into the channel with a syringe pump. Then, a chip capacitor (size 0.6 × 0.3 × 0.23 mm, was welded with copper wires with a diameter of 50 μm at two ends) was connected with the Galinstan coils by inserting the wires into the channel ports. Then, a little drop of liquid silicone was added to the coupling region and cured to encapsulate the capacitor. After being peeled off, the device was finally fabricated, as shown in figure 3(d). (The characteristics of every step are shown in figure S1 (available online at stacks.iop.org/JMM/31/035006/mmedia)) The fabricated lens has a thickness of 400 μm, which is thinner than the Triggerfish® lens sensor with a thickness of 585 μm [20].
Unlike Hg, Galinstan is a non-toxic or low-toxic liquid conductive material [48, 49]. Usually, it is packaged in silicone rubber to avoid direct contact with human skin. Since the liquid-metal alloy composed of gallium will form a Ga-oxide layer at the moment of being exposed to the atmosphere [48], this oxide layer will easily adhere to the skin, making it difficult to remove [32, 49]. For the application in ophthalmology, it is particularly necessary to consider that liquid metal encapsulated in the lens would not leak out. So, injecting and burst tests [50] were conducted. The device can withstand high-speed liquid influx (the flow rate per minute is 1038 times the volume of the channels, video S1) and have a bonding strength of 258 ± 15.5 KPa (shown in figure S2). The bonding strength is sufficient to meet the necessary packaging [51]. Therefore, the liquid metal would not leak out, unless it is under destructive conditions such as extreme stretching and extreme expansion, etc (video S2 shows a tensile test. The sensor exhibits excellent stretchability mainly due to the ultra-flexibility of silicone and liquid metal.) At the same time, no leakage occurred under a certain tensile strain. Since lens deformation caused by IOP or the wearing process is small enough, the liquid metal in the lens is basically non-threatening. In addition, after several intermittent IOP response tests and storage for nearly a year, the device still has a good signal (shown in figure S3). Its resonant frequency can be quickly identified through the portable readout module, although its quality coefficient has decreased (about 18%), which is mainly due to the increase of liquid-metal resistance caused by oxidation.
3. Tests, results and discussions
3.1. Performance on silicone rubber model eyeballs
The lens sensor was firsty calibrated on two silicone rubber model eyeballs (the designs of the model eyes and testing set-up detail are shown in figure S4). The two model eyeballs had the same dimensions and were fabricated by PDMS material at different mixing ratios of 25:1 and 35:1, respectively. They had measured Young's modulus of about 0.54 and 0.37 MPa, respectively (uniaxial stretching; shown in figure S5). During the tests, the lens sensor was attached to the eyeball without bubbles. Because there is no tear film between the lens and model eyeball ( ), according to formulas (6) and (7), the result is that coefficient
  approaches infinity and strain transfer efficiency
  . That is to say, the corneal strain is completely passed on to the lens. Finite element mechanical (FEM; COMSOL software) simulation was first used to verify this. In the simulations, the liquid metal filling area was set as the cavity due to its ultra-low modulus. The transverse displacement of the cavity center was calculated as the diameter changes of the coil. Figure 4(a) reveals the stress nephogram under the pressure of 40 mmHg. Figure 4(b) shows the comparison of FEM results with theoretical results. The FEM lines show that the change rate of the coil diameter increases linearly with IOP, which is the same as the theoretical results. At the same time, the theoretical model results are larger than FEM (deviations < 3%). This may be caused by the fact that the liquid-metal-filled area was treated as a silicone material or the shear lag of the cornea and contact lens was ignored in the theoretical model.
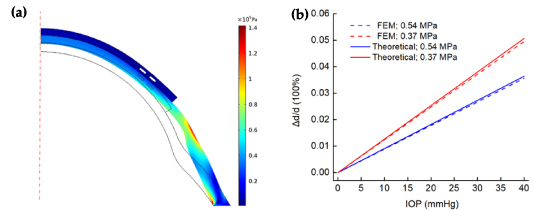
Figure 4. (a) Stress nephogram under the pressure of 40 mmHg (eyeball 0.37 MPa); (b) comparison of the FEM results with theoretical model results.
Download figure:
Standard image High-resolution imageThe experiment results from the model eyeballs are presented as figure 5. Figure 5(a) shows the recorded results of the reflection coefficient output from the network analyzer when IOP fluctuates (video S3 shows the changing process of resonant frequency). The resonant frequency of the sensor decreases along with the increase of pressure, which is consistent with the previous theoretical analysis. Figures 5(b) and (c) show the tracking curves (three) that are pressurized by slow IOP stair-case stimulus of approximately 2.5 mmHg per step (detailed change process can be found in video S4). The red curve represents pressure changes and the blue one represents resonance frequency response. The results indicate that the frequency response magnitude meets IOP changes well at each step.
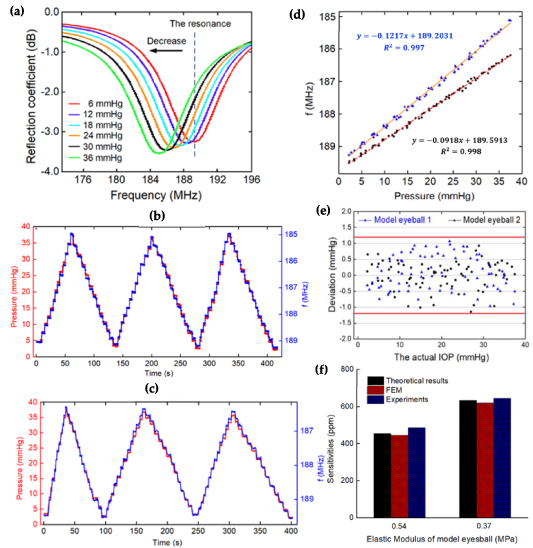
Figure 5. (a) Recorded output data from the network analyzer when changing IOP; (b) and (c) variation of resonance frequency and IOP during three cycles; (d) analysis of the static response on two eyeballs; (e) deviations between the calculated pressure values and the actual; (f) comparison of sensitivities between experiment, theoretical model and FEM.
Download figure:
Standard image High-resolution imageFigure 5(d) shows the analysis of static response characteristics, in which every point is extracted from the stabilized values in each step of figures 5(b) and (c). It is shown that the resonance frequency of the sensor on two model eyeballs varied linearly from 189.2–185.1 MHz and 189.6–186.25 MHz, respectively. The responses (slopes) were separately calculated to be −0.1217 and −0.0918 MHz mmHg−1, with  and
and  , respectively. Their initial resonance frequencies are different, which is mainly caused by the deviation of the position of the sensor attached to the artificial eyes. Moreover, the sensitivities were calculated to be 644 and 486 ppm mmHg−1, respectively. According to the results of fitting calibration, the deviations between the inverse calculated pressure value and the actual can be calculated. The result is shown in figure 5(e). The extreme deviations of the liquid-metal-based lens sensor on the two model eyeballs are 1.068 and −1.145 mmHg, respectively, which indicate an IOP measurement accuracy of
  mmHg. Figure 5(f) compares the sensitivities between experiment, theoretical model and FEM. The deviation between the experimental result and FEM is larger, with a maximum of 9.1%. This may be caused by the fact that the elastic modulus of the experimental model eyeballs is different to that of the theoretical model and FEM.
3.2. Demonstration of the lens sensor on porcine eyes in vitro
To demonstrate the adaptability and utility of the lens sensor on a real eye, the device was separately tested on three fresh porcine eyes in vitro for continuous IOP monitoring. A BD-24G needle connected to a pressurizing device was inserted into the eye to load pressure. At the beginning of the test, each eyeball in vitro was pressurized three times to stabilize the whole system. Then, slowly, stair-case stimulus was adopted to change its inner pressure. The pressure value and the sensor's resonance frequency value were recorded after stabilization at each step.
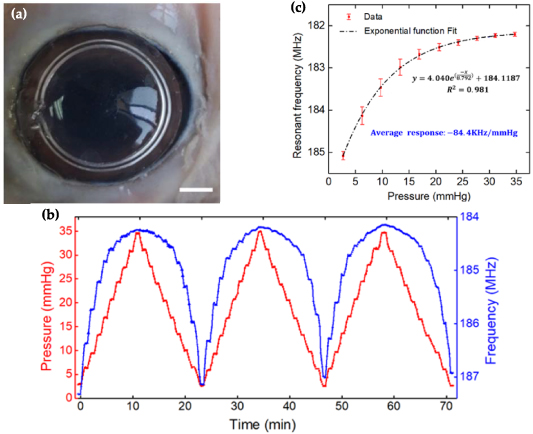
Figure 6 shows the results on one of the fresh porcine eyes in vitro. Figure 6(a) shows the lens sensor attaching well to the porcine eye surface (video S5 intuitively shows the signal changing process of the sensor on the network analyzer). The resonance frequency declines while the pressure of the porcine eye increases. Figure 6(b) shows three cycles of pressure fluctuation between 0–36 mmHg during pressurization experiments, in which the resonance frequency was detected continuously by using the developed portable module. The blue line represents IOP and the red line represents the resonance frequency of the sensor. The lines show that, as the IOP increases at each step, the resonance frequency decreases gradually. The results indicate that the sensor can track IOP changes and exhibits good response repeatability. But, on the other hand, the frequency change range is not the same under the same IOP increment, which is different to the phenomenon on the model eyeball. The frequency changes rapidly in a lower pressure region (lower than 10 mmHg) but smoothly in a higher pressure region (higher than 20 mmHg). This is mainly due to the biomechanical characteristics of the porcine eye. Medical studies [52–54] have shown that biological cornea and sclera are non-linear, viscoelastic and anisotropic materials. The elastic modulus of porcine eyes is not constant but increases with IOP. According to formulas (4) and (5), the increased modulus ( ) caused a small response of corneal curvature radius and meridional strain, leading to the small response of resonant frequency at high pressure.
Figure 6. (a) Contact lens sensor worn on a porcine eye in vitro, scale bar: 3 mm; (b) variation of resonant frequency and IOP during three cycles of increasing and decreasing processes; (c) the static response of resonant frequency.
Download figure:
Standard image High-resolution image
Figure 6(c) shows the static variation of output resonance frequency to the input IOP at pressurizing steps. Because the resonance frequency response is nonlinear, an exponential function was used to fit the data. The fitting equation is  , with a good determination coefficient of
  . The average response (
 ) was calculated to be −84.4 kHz mmHg−1 (the results on the other two porcine eyeballs are shown in figure S6). They also show similar nonlinear changes, with the average responses being −86.7 and −78.9 kHz mmHg−1, respectively. The results are slightly different, mainly due to their differences in mechanical properties.
3.3. Discussion
Table 2 shows the comparisons of the liquid-metal-based lens sensor with the existing electrical lens sensors [20, 21, 23]. For the sensor in this paper, the use of liquid metal (Galinstan) enables it to be integrated with ultra-soft media silicone rubber, which ensures the ultra-flexibility of the lens and reduces rigidity. While for other lens sensors, the solid metal film must be encapsulated with a tough hard polymer film before being integrated into the lens. Although the solid sensitive films (the metal and plastic film) are very thin, their stiffness is still very high because of their extremely high elastic modulus (about 2–3 orders of magnitude higher than the silicone lenses). Furthermore, these solid sensitive films were initially prepared by a planar process and high-rigidity silicone rubber was required to bind them to form the curved lenses. All these factors make their overall stiffness much larger than that of the liquid-metal-based lens sensor.
Table 2. Comparison of this study with other electrical lens sensors.
| Category | This paper | [20] | [21] | [23] |
|---|---|---|---|---|
| Sensor type | Inductance | Resistive | Capacitive | Inductance |
| Materials: elastic modulus (MPa) and thickness (mm) | Silicone rubber: 0.07 MPa, 0.4 mm | PDMS: 2 MPa, average 0.25 mm | Silicone rubber: 1.5 MPa, 0.1 mm | Silicone rubber: 1.5 MPa, 0.1 mm |
| Liquid metal: 0 MPa, 0.1 mm; | PI polymer: 3 GPa, 2 μm; | Parylene-c: 3.2 GPa, 2 μm; | Parylene-c: 3.2 GPa, 2 μm | |
| Pt/Ti: 168 GPa, 0.2 μm; | Electroplated Cu: 27 GPa, 2 μm; | Electroplated Cu: 27 GPa, 2 μm; | ||
Stiffness 
| Silicone rubber: 28 Pa·m | PDMS: 500 Pa·m | Silicone rubber: 150 Pa·m | Silicone rubber: 150 Pa·m |
| Liquid metal: 0 Pa·m; | PI polymer: 6000 Pa·m; | Parylene-c: 6400 Pa·m; | Parylene-c: 6400 Pa·m; | |
| Pt/Ti: 33 600 Pa·m; | Electroplated Cu: 54 000 Pa·m; | Electroplated Cu: 54 000 Pa·m; | ||
| Response | 78.9–86.7 KHz mmHg−1 | 113 μV mmHg−1 | 23 KHz mmHg−1 | 8 KHz mmHg−1 |
| (0–36 mmHg) | (11–30 mmHg) | (0–40 mmHg) | (0–40 mmHg) | |
| Sensitivity | 416–458 ppm mmHg−1 | 74 ppm mmHg−1 | 200 ppm mmHg−1 | 37 ppm mmHg−1 |
Note: In the theory of shell mechanics, the unit width is usually assumed to calculate the stiffness.
Low stiffness makes the liquid-metal-based lens sensor more comfortable to wear and guarantees further tremendous improvement in response and sensitivity. Its frequency response is 3.4–3.8, which is 9.8–10.8 times higher than LC lens sensors. Its sensitivity is 415–458 ppm mmHg−1, which is approximately 5.8, 2.2 and 11.5 times higher than resistive, capacitive and inductance sensors, respectively.
In the future, the sensor could be further optimized. For example, liquid-metal printing technology [55, 56] could be used to achieve faster and more inductive coil manufacturing. In addition, theoretical analysis has shown that the sensor response varies from human to human because of their difference in corneal stiffness. This would eventually lead to inaccurate IOP measurement. Some related ophthalmic instruments (such as an eye response analyzer) could be combined with the liquid-metal-based lens sensors. Ophthalmic instruments could be used to measure corneal biomechanical parameters [57] and then adjust the response relationship of the sensors. Moreover, clinical trials (after approval) could be conducted to obtain the response data and then the sensor responses could be calibrated in different categories of people by means of an advanced algorithm such as machine learning neural networks, etc.
In general, the works presented here provide a useful, effective and promising approach to 24 h IOP monitoring.
4. Conclusion
In this paper, a liquid-metal-based contact lens sensor for IOP monitoring has been presented. The lens is integrated with an LC resonator strain sensor, composed of a stretchable inductance coil of liquid metal and a chip capacitor. IOP measuring is operated on the basis of 'mechanical-electrical' principle. The fluctuation of IOP changes the curvature radius of the cornea and stretches the inductance coils through the cornea and tear film, which then leads to a change in resonant frequency. The model of the whole process has been established and explored. The sensor was designed and fabricated scientifically, which makes it ultra-soft, comfortable, safe without leakage and has a stable signal.
The lens sensor was first calibrated on silicone rubber model eyeballs, showing a linear response of −0.1217 and −0.0918 MHz mmHg−1, respectively. The numerical results of sensitivity from the experiments all agree well with the theoretical model and FEM. A test on fresh porcine eyes in vitro for continuous IOP monitoring was also conducted. The sensor could track IOP changes and showed nonlinear responses, which is mainly due to the nonlinear biomechanical characteristics of porcine eyes. The average responses on three eyes were calculated to be −84.4, −86.7 and −78.9 kHz mmHg−1, respectively. The sensor shows higher sensitivity than other current wireless lens IOP sensors, which is even an order of magnitude higher than existing inductive sensors. The high-sensitivity liquid-metal-based lens sensor provides a promising approach for non-invasive and 24 h continuous IOP monitoring in clinics or at home.
Acknowledgments
This research is financially supported by the Hubei Natural Science Foundation (Grant No. 2019CFB576) and the National Natural Science Foundation of China (Grant Nos. 51375198, 81471744 and 51575216). The authors would like to thank the Wuhan National Research Center for Optoelectronic and Flexible Electronics (HUST) for providing processing equipment to fabricate the contact lens sensor devices.
Conflicts of interest
The authors declare no conflict of interest.