
Abstract
Heart rate variability is a useful clinical tool for autonomic function assessment and cardiovascular disease diagnosis. To investigate the dynamic changes of sympathetic and parasympathetic activities during the cold pressor test, we used a time-varying autoregressive model for the time-frequency analysis of heart rate variability in 101 healthy subjects. We found that there were two sympathetic peaks (or two parasympathetic valleys) when the abrupt changes of temperature (ACT) occurred at the beginning and the end of the cold stimulus and that the sympathetic and parasympathetic activities returned to normal in about the last 2 min of the cold stimulus. These findings suggested that the ACT rather than the low temperature was the major cause of the sympathetic excitation and parasympathetic withdrawal. We also found that the onsets of the sympathetic peaks were 4–26 s prior to the ACT and the returns to normal were 54–57 s after the ACT, which could be interpreted as the feedforward and adaptation of the autonomic regulation process in the human body, respectively. These results might be helpful for understanding the regulatory mechanisms of the autonomic system and its effects on the cardiovascular system.
Export citation and abstract BibTeX RIS

Content from this work may be used under the terms of the Creative Commons Attribution 3.0 licence. Any further distribution of this work must maintain attribution to the author(s) and the title of the work, journal citation and DOI.
1. Introduction
Heart rate variability (HRV) is the tiny fluctuations of the time intervals between heartbeats. It reflects the tenseness and the balance of the sympathetic and the parasympathetic nerve activities and their effects on cardiovascular motion (Camm et al 1996). The high frequency power (HF) of HRV generally reflects the parasympathetic activity and the low frequency power (LF) is considered to include both sympathetic and parasympathetic influences. The ratio of LF to HF (LF/HF) is usually regarded as a marker of the sympatho-parasympathetic balance or a reflection of the sympathetic modulations (Camm et al 1996, Berntson et al 1997). The abnormal changes of HRV are related to several cardiological and non-cardiological diseases, such as myocardial infarction, diabetic neuropathy, myocardial dysfunction and tetraplegia (Camm et al 1996).Therefore, the analysis of HRV is a useful noninvasive method for assessing the autonomic functions and has been widely used in clinical applications.
The power spectrum of HRV is traditionally estimated by fast Fourier transform (FFT) or autoregressive (AR) model in frequency domain based on the hypothesis of its stationarity (Camm et al 1996, Berntson et al 1997). However, HRV is intrinsically non-stationary, varying over time, especially in some situations like postural changes (van Steenis et al 2002, Chan et al 2007), physical exercises (Martinmaki and Rusko 2008, Blain et al 2009, Pecanha et al 2013), general anaesthesia (Huang et al 1997) and cold pressor tests (Weise et al 1993, Goldstein et al 1994), where HRV may change dramatically within a short time. Therefore, the traditional FFT and AR methods are inappropriate to present the dynamic changes of the HRV and some time-frequency technologies are required, such as short time Fourier transform, Wigner–Ville distribution, Wavelet transform, Hilbert–Huang transform and time-varying autoregressive (TVAR) model (Bianchi et al 2000, Mainardi 2009, Wacker and Witte 2013). In particular, the TVAR model can calculate a new set of AR parameters each time a new sample is available (Bianchi et al 1993) and has the advantage of providing smooth spectral components and accurate estimation of the power spectrum as the AR model has. It has already been employed for the investigation of beat-to-beat spectra of HRV analysis during transient ischemic attacks (Bianchi et al 1993), dobutamine echocardiographic test (Bianchi et al 2000) and before and after physical exercise (Liu et al 2011).
In the present study, we focused on the time-frequency analysis of HRV during the cold pressor test. The cold pressor test is a commonly-used sympathetic activation test that measures blood pressure response to the stimulus of external cold for the evaluation of cardiovascular reactivity (Zhang et al 2013). A high blood pressure response is usually associated with hypertension (Wood et al 1984, Menkes et al 1989, Kasagi et al 1995) and coronary disease (Nabel et al 1988). However, to our best knowledge, most of the previous literature about the cold pressor test studied on the cardiovascular response to the cold stimulus and its clinical significance. Few of them investigated the HRV analysis (Weise et al 1993, Goldstein et al 1994, Liu et al 2013), especially the time-frequency analysis of HRV. Herein we employed the TVAR model for the time-frequency analysis of HRV in order to present the dynamic change of autonomic function during the cold pressor test. We found an interesting phenomenon that there were two sympathetic peaks (or two parasympathetic valleys) when the abrupt changes of temperature (ACT) occurred at the beginning and the end of the cold stimulus. We carefully examined the sympathetic peaks and gave some possible interpretations.
2. Methods
2.1. Cold pressor test
The experiment was approved by the Institutional Review Board of Shenzhen Institutes of Advanced Technology (registration number: SIAT-IRB-120515-H0009). A total of 101 subjects participated in the experiment (63 males and 38 females, age 20–32 years, height 150–185 cm, weight 40–90 kg). All the subjects were healthy without any known diseases and provided their written informed consent. They were asked to refrain from caffeine, alcohol, cigarette or strenuous exercise for 2 h prior to the experiment.
In the experiment, all the subjects were instructed to lie in the supine position on a mattress and to keep as still as possible throughout the recording period. A Finometer® MIDI (Model II, Finapres Medical Systems B. V., The Netherlands) was used to collect the electrocardiogram (ECG) signals at a sampling rate of 200 Hz and these signals were automatically stored in a personal computer by a BeatScope® Easy software (Finapres Medical Systems B.V., The Netherlands). As shown in figure 1, the experimental procedure of the cold pressor test lasted 13 min for each subject, including 5 min resting (room temperature 26 °C), 3 min cold stimulus for immersion of the left hand in cold water (10 °C) and 5 min recovering for the hand out of water.

Figure 1. The procedure of the cold pressor test.
Download figure:
Standard image High-resolution image2.2. Signal processing
The ECG signals were passed through a low-pass filter with the cutoff frequency of 11 Hz cascaded a high-pass filter with the cutoff frequency of 5 Hz to reduce the influence of muscle noise, powerline interference and baseline wander (Pan and Tompkins 1985). Then the filtered ECG signals were interpolated to 800 Hz with cubic spline to increase the temporal resolution. R-wave peak detection was performed using Pan and Tomkins' algorithm (Pan and Tompkins, 1985) and R–R intervals (RRI) were calculated as the difference of successive R-wave peak locations. Missed beats and false detected beats were manually identified and adjusted by visual inspection on the computer screen. Thereafter, the RRI series were linearly interpolated to 4 Hz in order to obtain evenly sampled signals and then detrended using a zero-phase high-pass Butterworth filter with the cutoff frequency of 0.02 Hz before time-frequency analysis.
2.3. Time-frequency analysis
Let x(n) denote a zero-mean non-stationary time series. The TVAR model (Bianchi et al 1993, Bianchi et al 2000) of x(n) can be expressed as

where ak are the model coefficients, e(n) is a zero-mean, white Gaussian noise with variance σ2, n is the index number of time and p is the model order.
The least square (LS) method is usually adopted to evaluate the parameters ak by minimizing the figure of merit:

where

is the forward prediction error estimated from a set of N data points.
If x(n) is a long data sequence, a forgetting factor ω is introduced to place more weight on recent data than the old ones, then the figure of merit is exponentially weighted and modified as:
where ω is a positive real scalar satisfying 0 < ω ≤ 1 and N is the index of the last sample considered. Then the parameters ak can be evaluated by updating the previous ones using a recursive LS algorithm (Bianchi et al 1993) written by


where cp − 1, N is the gain vector, xp(n) = [x(n), x(n − 1),..., x(n − p)]T, PN is the inverse of the autocorrelation matrix of xp(n), I is the identity matrix, ef,N(N + 1) is the filtered residual and ap,N = [ap,N (1), ap,N (2),..., ap,N (p)]T are the model coefficients of TVAR.
The value of ω is important to the performance of the recursive LS algorithm (Bianchi et al 1993). The smaller the ω is, the estimation adapts at a faster rate, but is more sensitive to local variations due to the superimposed noise. The larger the ω is, the estimation is less sensitive to noise but has a slower adaptation to different characteristics of the signal.
From the obtained ak, the time-varying power spectra of x(n) can be expressed as a function of time index N:
where T is the sample interval and σ2(N) is the variance of the input white noise at time index N.
We employed the TVAR model for the time-varying power spectra estimation of RRI series. The forgetting factor ω was set to 0.98 and the model order p was set to 12 according to the literature (Bianchi et al 1993). Afterwards, the HRV parameters nLF (normalized low frequency power), nHF (normalized high frequency power) and LF/HF (the ratio of low frequency power to high frequency power) were calculated over time for each subject. The frequency bands of these parameters were in accordance with the recommended standard (Camm et al 1996). For a statistic analysis, we averaged the nLF, nHF and LF/HF for all subjects, as well as for males and for females to compare the gender difference. The 'average' here means averaging the other values after excluding the five largest ones and the five smallest ones.
3. Results
Typical time-varying power spectra of HRV during the cold pressor test were shown in figure 2. It was obvious that the power spectra were changing slowly over the time. The central frequencies of the LF band and HF band could be easily identified as the dark parts of the diagrams (or the red parts of the color version).

Figure 2. Typical time-varying power spectra of heart rate variability during the cold pressor test. (a) Subject #003, male, 27 years old. (b) Subject #088, female, 24 years old.
Download figure:
Standard image High-resolution imageTwo examples of the calculated time-varying nLF, nHF and LF/HF of HRV during the cold pressor test were given in figure 3. The vertical dotted lines denoted the 'start' and 'stop' of the cold stimulus. It was clear that there were two peaks for nLF and LF/HF and two valleys for nHF right after the vertical lines, indicating that the abrupt changes of temperature (ACT, i.e. the 'start' or 'stop' of the cold stimulus) could increase the sympathetic activity and decrease the parasympathetic activity. For the sake of simplicity, we named the two peaks or two valleys 'sympathetic peaks'.
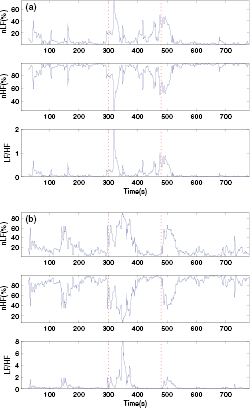
Figure 3. Typical time-varying nLF, nHF and LF/HF of heart rate variability during the cold pressor test. (a) Subject #040, male, 25 years old. (b) Subject #024, female, 27 years old. The vertical dotted lines indicate the beginning and the end of the cold stimulus. nLF, normalized low frequency power. nHF, normalized high frequency power. LF/HF, the ratio of low frequency power to high frequency power.
Download figure:
Standard image High-resolution imageFor further investigation, we averaged the nLF, nHF and LF/HF for all subjects. As shown in figure 4, the two sympathetic peaks were much clearer after averaged for all the subjects and the curves were smoother with less noise. It was also observed that the nLF, nHF and LF/HF of the last 2 min of the cold stimulus (i.e. time axis 360–480 s) were approximately equal to those of the resting period (i.e. time axis 0–300 s) and the last 4 min of recovering period (i.e. time axis 540–780 s), indicating that the low temperature was not the cause of the sympathetic excitation and parasympathetic withdrawal.

Figure 4. The averaged nLF, nHF and LF/HF for all the 101 subjects during the cold pressor test. The dotted curves indicate the 'mean ± standard deviation'. The vertical lines indicate the beginning and the end of the cold stimulus. nLF, normalized low frequency power. nHF, normalized high frequency power. LF/HF, the ratio of low frequency power to high frequency power.
Download figure:
Standard image High-resolution imageAveraging was also performed both for males and for females to compare the gender difference. As shown in figure 5, the two sympathetic peaks still existed at the beginning and the end of the cold stimulus after averaged for males and for females. It is worth noting that the widths of the peaks for females were a bit larger than those for males, suggesting that females were more sensitive to the ACT.
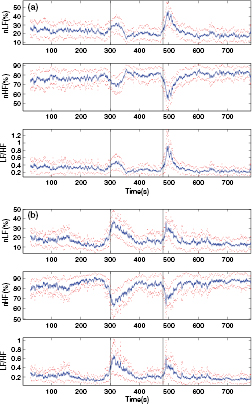
Figure 5. The averaged nLF, nHF and LF/HF (a) for 63 males and (b) for 38 females during the cold pressor test. The dotted curves indicate the 'average ± standard deviation'. The vertical lines indicate the beginning and the end of the cold stimulus. nLF, normalized low frequency power. nHF, normalized high frequency power. LF/HF, the ratio of low frequency power to high frequency power.
Download figure:
Standard image High-resolution imageTo extract the timing characteristics of the sympathetic peaks, we smoothed each single nLF curve using a wavelet filter and detected the onset, the vertex and the offset for each single subject. As shown in figure 6, the vertex is defined as the position of the maximum of the peak and the onset (offset) is defined as the position when the curve exceeds (falls below) 1.0% of the height of the peak before (after) the vertex. These definitions are modified from an open-source algorithm used for detection of arterial blood pressure pulses (Zong et al 2003). Then we calculated the temporal distances of the onset, the vertex and the offset from the ACT, as well as the width of the peak determined as the temporal distance of the offset from the onset. Statistically, Student t-tests were performed to compare the difference between males and females, also the difference between the first peak and the second peak values.

Figure 6. The definition of the onset, the vertex and the offset.
Download figure:
Standard image High-resolution image
As presented in table 1, the first sympathetic peaks rose up about 26 s prior to the ACT, then reached the vertices about 16 s after the ACT and returned to normal about 54 s after the ACT. The second sympathetic peaks rose up about 4 s prior to the ACT, then reached the vertices about 26 s after the ACT and returned to normal about 57 s after the ACT. The first peaks had earlier onsets and larger widths than the second peaks (p < 0.05), indicating that subjects were more sensitive to the ACT of normal-to-cold than the ACT of cold-to-normal. Additionally, no significant differences were found between genders, although females had wider sympathetic peaks with earlier onsets and later offsets than males.
Table 1. The timing characteristics of the two sympathetic peaks in nLF curves.
| Subjects | Peak | Onset(s) | Vertex(s) | Offset(s) | Width(s) |
|---|---|---|---|---|---|
| All | 1st peak | −26.01 ± 25.99 |
16.47 ± 23.25 |
54.09 ± 26.62 | 80.10 ± 28.10 |
| Males | 1st peak | −25.37 ± 26.67 |
13.42 ± 24.84 |
52.34 ± 26.04 | 77.71 ± 27.13 |
| Females | 1st peak | −27.06 ± 25.12 |
21.53 ± 19.61 | 57.00 ± 27.66 | 84.06 ± 29.59 |
| All | 2nd peak | −4.19 ± 27.08 |
25.98 ± 26.37 |
56.72 ± 27.27 | 60.91 ± 18.59 |
| Males | 2nd peak | −2.67 ± 28.74 |
26.93 ± 28.19 |
56.31 ± 28.49 | 58.99 ± 19.22 |
| Females | 2nd peak | −6.70 ± 24.26 |
24.41 ± 23.32 | 57.38 ± 25.49 | 64.09 ± 17.25 |
Data are presented as mean ± standard deviation. No gender differences are statistically significant. aThe difference between the 1st peak and the 2nd peak is statistically significant (p < 0.05).
4. Discussion
The results revealed that there were two sympathetic peaks and two parasympathetic valleys when the ACT occurred at the beginning and the end of the cold stimulus and that the sympathetic and parasympathetic activities returned to normal in the last 2 min of the cold stimulus, suggesting that the ACT rather than the low temperature was the major cause of the sympathetic excitation and parasympathetic withdrawal, which was indirectly supported by previous researches (Nagaoka et al 2002, Korhonen 2006). Korhonen compared the effects of different types of cold exposure on blood pressure and heart rate and the results in his study indicated that a sudden local exposure to severe cold would be more stressful than a long-lasting milder exposure to cold (Korhonen 2006). Nagaoka et al investigated the response of the retinal arteriole to a 5 min cold stimulus and found that the retinal blood flow had a transient increase after the cold stimulus began and rapidly returned to baseline (Nagaoka et al 2002). In addition, it is commonly believed that the large indoor–outdoor temperature difference can trigger heart attacks when cardiovascular patients go in or out of an air-conditioned room, for which our results provide corroborating evidence that the ACT activates the sympathetic nerves and increases the heart rate and blood pressure, then the heart has to work harder, increasing the risk of heart attacks. Therefore, we suggest cardiovascular patients avoiding ACT situations such as entering a cooled room from hot outside in summer.
Our results further revealed that the sympathetic peaks increased to the vertices about 16–26 s after the ACT and then decreased to normal about 54–57 s after the ACT, reflecting the regulation process of the autonomic nervous system to adapt to the environmental change. When the human body was stimulated by the ACT, the sympathetic nerves were activated to produce a release of norepinephrine and epinephrine with an elevation in both heart rate and arterial blood pressure (Robertson et al 1979). Then the heart rate and blood pressure returned to normal when the body was adapted to the stimulus. Our results confirmed a previous study which reported that the heart rate increased maximally during the first 30 s of the cold pressor test and returned to baseline during the second minute (Victor et al 1987). The results also explained the subjects' complaints that they had a sensation of pain at the first minute of the cold stimulus and subsequently the pain disappeared after the cold adaptation. In addition, some other studies reported that sympathetic activation response to the cold pressor test was blunted after adaptation of cold exposure training (Makinen et al 2008, Brandstrom et al 2013) and that whole-body cryotherapies had similar effect on the autonomic system compared to exercise training(Westerlund et al 2006). We thus speculate that features of the sympathetic peaks like the vertex and the offset might be related to the adaptability of the subjects.
The onsets' advance of the ACT is likely to be interpreted as the feedforward control of physiological systems. In the experiment of the cold pressor test, we counted down the time and instructed the subject to get ready for putting the left hand into or out of the cold water when the preset ACT time was drawing near. It may be the countdown that induced the subjects' mental stress and provoked the sympathetic tension before the ACT occurred. Similar results have been found in a previous study that awareness of hypertension increased blood pressure and sympathetic responses to the cold pressor test (Rostrup et al 1990). Accordingly, it is inferred that the autonomic system may be intricately influenced by mental factors and other confounders.
One of the limitations of our study is the large variations among subjects (see figures 4, 5 and table 1). Although most of the subjects had two sympathetic peaks during the cold pressor test, the positions (e.g. the onset, the offset) and the morphologies (e.g. the width, the height) of the peaks for each subject varied markedly due to individual differences. It is not surprising that previous studies have reported large variations of blood pressure (Fasano et al 1996) and heart rate power spectrum (Goldstein et al 1994) during the cold pressor test. However, reasons for these individual differences are still unclear. We suppose that personalized characteristics of the peaks might be related to cardiovascular features and could be used for assessment of personal health conditions. Another limitation is that all the subjects investigated were young healthy adults without any known diseases. It needs further investigation whether similar results could be found in population of different age groups or with certain cardiovascular diseases.
5. Conclusion
The TVAR model is a useful tool for time-frequency analysis of HRV. It can present the dynamic changes of sympathetic and parasympathetic activities during the cold pressor test. After statistic analyses, we found that there were two sympathetic peaks at the beginning and the end of the cold stimulus and that the sympathetic and parasympathetic activities returned to normal in the last 2 min of the cold stimulus. These results suggested that the ACT rather than the low temperature was the major cause of the sympathetic tension. We think that these results might be helpful for understanding the regulatory mechanisms of the autonomic system and its effects on the cardiovascular system and that these results might provide useful suggestions for clinical practice and personal healthcare.
Acknowledgment
This work was supported in part by the National Basic Research Program 973 (NO.2010CB732606), the Guangdong Innovation Research Team Fund for Low-cost Healthcare Technologies in China, the External Cooperation Program of Chinese Academy of Sciences (NO.GJHZ1212), the Key Lab for Health Informatics of Chinese Academy of Sciences, the Peacock Program to Attract Overseas High-Caliber Talents to Shenzhen, the National Natural Science Foundation of China (NO.61401453) and the Shenzhen Municipal Government (NO. KFJ-EW-STS-097 and NO. KFJ-EWSTS-095).
Conflict of interest
The authors declare that they have no conflict of interest.