

Abstract
A fast 2D axisymmetric fluid-analytical multifrequency capacitively coupled plasma (CCP) reactor code is used to study center high nonuniformity in a low pressure electronegative chlorine discharge. In the code, a time-independent Helmholtz wave equation is used to solve for the capacitive fields in the linearized frequency domain. This eliminates the time dependence from the electromagnetic (EM) solve, greatly speeding up the simulations at the cost of neglecting higher harmonics. However, since the code allows up to three driving frequencies, we can add the two most important harmonics to the CCP simulations as the second and third input frequencies. The amplitude and phase of these harmonics are estimated by using a recently developed 1D radial nonlinear transmission line (TL) model of a highly asymmetric cylindrical discharge (Lieberman et al 2015 Plasma Sources Sci. Technol. 24 055011). We find that at higher applied frequencies, the higher harmonics contribute significantly to the center high nonuniformity due to their shorter plasma wavelengths.
Export citation and abstract BibTeX RIS
1. Introduction
Large area, high frequency capacitively coupled plasma (CCP) reactors with electronegative (EN) feed gases are widely used for reactive ion etching in the semiconductor processing industry. Larger area sources allow larger wafers and increased production. In capacitive discharges at fixed power, the fraction of power depositon into electrons (as opposed to ions) increases with increasing frequency [2], leading to an increase in plasma density and hence ion flux at the wafer target. Increasing the frequency also results in decreasing the sheath widths and sheath voltages, leading to a decrease in ion bombarding energy which may be desirable for processing integrated circuits with smaller dimensions. However, at larger areas or higher frequencies, electromagnetic (EM) effects such as standing wave and skin effects come into play and can negatively affect the plasma uniformity [3, 4]. Previous works have modeled EM effects in large area, high frequency CCPs by either solving Maxwell's equations in the frequency domain [5–10] and neglecting harmonics, or solving in the time domain [11–18] and capturing nonlinear effects. The main conclusion is that at higher frequencies or larger areas, the wavelength  of the EM surface wave in the plasma can become significantly shorter than the reactor dimensions, leading to center-high plasma uniformities. But these studies did not investigate specific non-linear effects that can strongly enhance center-high excitations even at frequencies for which the fundamental
  is much larger than the reactor dimensions.
In a typical asymmetric cylindrical CCP reactor, various nonlinear effects become important. In particular, at high applied frequencies, harmonics are generated by sheath nonlinearities which can strongly couple to the series resonance, and may also be spatially resonant. The latter effect is particularly important if the source impedance is small such that the device is essentially voltage-driven. In fully nonlinear EM codes, which investigate complex geometries and chemistries, the generation of enhanced harmonics from the series resonance, and its effect in creating spatial resonances that enhance nonuniformities may have been overlooked. This is especially true at higher pressures which tend to damp out harmonic enhancements [19, 20]. In a recent paper [1], we specifically examined the generation of enhanced harmonics by using a simplified 1D radial nonlinear EM transmission line (TL) model of a highly asymmetric cylindrical discharge. The model was not self-consistent, as Maxwell's equations were solved for a specified uniform electron density ne and specified uniform electron temperature  .
.
In this paper, we use the amplitudes and phases of the harmonics generated in the simplified 1D non-linear transmission line model as inputs to a previously developed multifrequency, self-consistent 2D hybrid fluid-analytical model [10] of a typical asymmetric cylindrical discharge. In the 2D fluid-analytical model, the field solve is conducted in the linearized frequency domain so that higher harmonics are neglected. However, since the model allows up to three input frequencies, we can first run the 1D nonlinear TL model to estimate the amplitude and phases of the higher harmonics, and then explicitly add the most important harmonics as the second and third input frequencies in the 2D multifrequency fluid-analytical simulations.
The paper is divided into the following sections. In section 2, we briefly describe the multifrequency 2D fluid-analytical model of an axisymmetric cylindrical CCP reactor, and then present and discuss the results of simulations of a low pressure electronegative Cl2 discharge over a range of applied frequencies from 30 to 90 MHz. In section 3, we briefly describe the 1D radial nonlinear transmission line model and use it to estimate the amplitude and phase of the harmonics that would be generated in the configurations of section 2. In section 4, two of the 2D fluid-analytical simulations of section 2 are repeated in multifrequency mode by expicitly adding the harmonics estimated by the nonlinear TL model in section 3. Conclusions and further discussion are given in section 5.
2. 2D fluid-analytical CCP model
2.1. Model description
A fast 2D fluid-analytical multifrequency CCP reactor model was developed using the finite elements simulation tool COMSOL in the MATLAB numerical computing environment. Since this model has been fully described in reference [10], we only give a brief description below. As shown in figure 1, the CCP model has an axisymmetric cylindrical geometry with center of symmetry at r = 0 (z-axis). For this study, the plasma chamber is 5 cm in height and 25 cm in radius. There is a 15 cm radius showerhead gas inlet at the top and radial center, and a 3 cm width gas outlet at the bottom and radial edge. The wafer electrode has a radius of 15 cm, and is insulated from other conducting surfaces by a 2.5 cm wide quartz dielectric spacer. The bulk plasma region is surrounded by a sheath region with a nominal width of s0 = 0.5 cm. The feedstock gas in the simulations was Cl2, and we used the chlorine reaction rate set compiled by Thorsteinsson and Gudmundsson [21].

Figure 1. The model geometry of the 2D axisymmetric CCP reactor.
Download figure:
Standard image High-resolution imageThe model treats each region of the reactor as a dielectric slab. The free-space magnetic permeability  is assumed everywhere while
  depends on the relative dielectric constant κ of each region. The sheath relative dielectric constant
  is initially set to one but is actually a function of the local electric field and plasma parameters as discussed in [10, 22]. The quartz dielectric spacer has
  . In the plasma region, the relative dielectric constant is
where ω is the applied radian rf frequency,  is the electron-neutral momentum transfer collision frequency, and
  is the electron plasma frequency with ne and me the electron density and mass respectively. Note that
  is complex with a dissipative imaginary component, so that our model treats the plasma region as a lossy dielectric.
The simulation consists of four basic parts: (1) an EM model which uses the time-independent Helmholtz equation to solve for the capacitive fields in the linearized frequency domain; (2) an ambipolar, quasineutral bulk plasma model which solves the time-dependent fluid equations for ion continuity and electron energy balance; (3) an analytical sheath model which solves for the sheath parameters (i.e. sheath voltage, sheath width and  ); (4) a gas flow model which solves for the steady-state composition, pressure, temperature and velocity of a reactive gas. A flow chart depicting the CCP model simulation is shown in figure 2. The total simulation time for Cl2 is about 60–90 min on a moderate workstation with 2.7 GHZ CPU and 12 GB of memory. The finite elements mesh used in the simulation consisted of 5846 triangular elements and 3108 mesh points.
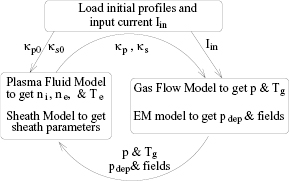
Figure 2. Flow chart of 2D fluid-analytic CCP simulation procedure.
Download figure:
Standard image High-resolution imagePlasma reactors are typically run at fixed input power Prf rather than fixed input current Irf. To do this with our code, we used a method proposed in [8]. After every EM solve, we calculate the rf input power Prf and compare it to the desired power Pset. Then, the applied rf current amplitude Irf at the source is adjusted, the EM field solve is repeated and Prf is calculated again. These steps are repeated until Prf and Pset agree with each other within a specified relative tolerance of 4%. If there are multiple frequencies, then the above procedure is done for each of the driving frequencies.
2.2. Single frequency chlorine CCP simulations
In this section we show and discuss the results of single frequency 2D fluid-analytical simulations of the CCP reactor shown in figure 1 for a range of frequencies from 30 to 90 MHz. In each case, we assume a 500 sccm Cl2 gas flow from the showerhead and set the pressure p at the outlet surface to 10 mTorr. For each frequency f, the input power Prf is chosen to produce a central electron density of about  m−3. The 1D TL model is not self-consistent, but solves the EM equations for a given ne and Te. Since we chose an input ne of
  m−3 for the TL model, we did the same for the 2D fluid model. Since ne depends primarily on Pe (power absorbed by the electrons), fixing ne is essentially equivalent to fixing Pe. Both axially symmetric and antisymmetric radially-propagating wave modes exist in asymmetrically excited capacitively discharges [7]. The upper and lower axial sheath fields (Ez) are aligned (in phase) for the symmetric mode while they are opposed (180 degrees out of phase) for the antisymmetric mode.
At a frequency of f = 30 MHz, an rf input power of  W gives the base case electron density of about
  m−3. In figure 3, we show the contour plots for (a) the electron density ne, (b) the Cl− density n−, and (c) the electron temperature Te. The central electronegativity
  for this chlorine discharge. Due to the fairly high α, ne is fairly uniform above the wafer electrode. In a highly electronegative plasma with
  , quasineutrality in the bulk is maintained mostly by the negative ions rather than the electrons. Since the less mobile negative ions have a much smaller temperature than the electrons, only a small ambipolar field with
  Te is required to confine the negative ions to the plasma core. The electrons are in Boltzmann equilibrium with this small field so that
  , where
  . Note that we have chosen the zero of the potential to be at the radial center so that
  and
and  . Since
  Te,
Te,  , and the electrons are approximately uniform in a highly electronegative plasma.
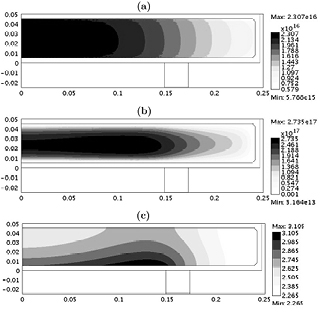
Figure 3. 2D fluid-analytical results for a 500 sccm, 10 mTorr Cl2 discharge with  W and f = 30 MHz, showing contour plots of (a) ne (m−3), (b) n−(r) (m−3), and (c)
  (V).
(V).
Download figure:
Standard image High-resolution imageAs expected, Te is highest near the wafer edge where the potential gradient and fields are high, leading to high radial field ohmic heating (electrostatic edge effect [8]). In figure 4, we show the results of the 30 MHz case for (a) the midplane electron density  , (b) the midplane positive and negative ion densities n+(r) and n−(r), (c) the rf (black) and dc (grey) sheath voltages along the plasma-sheath boundary, and (d) the sheath width along the plasma-sheath boundary. The abscissa x in plots (c) and (d) is measured starting from the radial center of the lower wafer electrode and going around the plasma-sheath boundary until it reaches the radial center of the larger grounded electrode. So, from x = 0 to 15 cm, the plasma-sheath boundary is along the smaller wafer electrode; from x = 15 to 17.5 cm, it is along the dielectric spacer, and from x = 17.5 to 52.6 cm, it is along the larger grounded electrode. The spikes prominent in the plots indicate the corners at the radial edges. The dielectric spacer region is also the source region as all the voltage drop between the powered and grounded electrodes falls across it. As expected at this low frequency, the sheath voltage and sheath width are much larger between the plasma and the smaller wafer electrode than between the plasma and the larger grounded electrode. For this configuration, the symmetric mode excitation would dominate, and we expect the the axial sheath fields (Ezs) of the wafer and grounded electrodes to be nearly in phase. The sheath voltage is fairly uniform along each electrode, indicating that at 30 MHz, the wavelengths
  of the symmetric mode surface waves are much larger than the system size. Figure 5(a) shows the imaginary (solid) and real (dotted) parts of the complex axial sheath field amplitude Ezs at the bottom (black) and top (grey) electrodes for the 30 MHz case. For both electrodes, the imaginary parts of Ezs point in the same axial direction and dominate over their respective real parts, indicating that at any point in time, the Ezs of the bottom and top electrodes are aligned and nearly in phase.

Figure 4. 2D fluid-analytical results for a 500 sccm, 10 mTorr Cl2 discharge with  W@30MHz, showing (a) the midplane (a)
  (m−3), (b) the midplane n+(r) (solid) and n−(r) (dashed) (m−3), (c) the rf (black) and dc (grey) sheath voltages (V), and (d) the sheath width (m). The abscissa x in (c) and (d) is measured starting from the radial center of the bottom electrode and going around the plasma-sheath boundary until it reaches the radial center of the upper electrode.
Download figure:
Standard image High-resolution image
Figure 5. 2D fluid-analytical results for a 500 sccm, 10 mTorr Cl2 discharge, showing the imaginary (solid) and real (dotted) parts of the axial sheath electric field Ezs for the bottom (black) and top (grey) electrodes at (a) 1150W@30MHz, and (b) 394W@72.5MHz.
Download figure:
Standard image High-resolution imageThe wavenumber of radially propagating symmetric surface waves in the plasma of a highly asymmetric discharge is given by [5]

where  is the vacuum wavenumber, c is the speed of light, s is the sheath width of the dominant sheath, leff is an effective discharge width, including the skin effect, and we assume
  . If l is the actual discharge width and
  is the skin depth, then

Thus, at higher ne, the skin depth δ and the effective plasma width leff decrease. At  m−3,
m−3,  cm. From (2), if the frequency f increases or the ratio
  decreases, then
  also decreases, making wave effects more visible. An expected spatial resonance condition for the symmetric mode is

where  cm is the discharge radius, and
  is the first zero of the zero-order Bessel function
  .
.
In figures 6 and 7, we show the same plots as in figures 3 and 4, but for a higher frequency of 45 MHz. At this higher frequency, a smaller drive power of 750 W gives approximately the same base case electron density with accompanying smaller sheath voltages and sheath widths. As with the 30 MHz case, the discharge is highly electronegative with  , and ne is fairly uniform above the wafer electrode while
  is largest near the wafer electrode edge due to the electrostatic edge effect. The smaller wafer electrode dominates with sheath voltages and sheath widths much larger than that of the larger grounded electrode. The sheath voltage and sheath width are fairly uniform, but slightly center-peaked along the wafer electrode when compared to the 30 MHz case due to the reduced
  at the higher frequency.
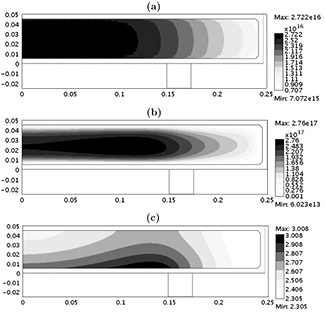
Figure 6. 2D fluid-analytical results for a 500 sccm, 10 mTorr Cl2 discharge with  W@45MHz, showing contour plots of the same diagnostics as in figure 3. (a) ne (m−3), (b)
  , and (c) Te (V).
Download figure:
Standard image High-resolution image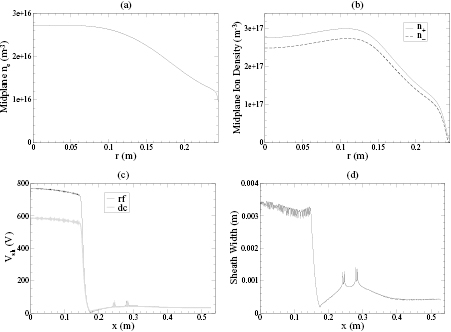
Figure 7. 2D fluid-analytical results for a 500 sccm, 10 mTorr Cl2 discharge with  W@45 MHz, showing the same diagnostics as in figure 4.
Download figure:
Standard image High-resolution imageAt 60 MHz (as seen in figure 8), a smaller drive power of 500 W gives about the same base case electron density, but with smaller sheath voltages and sheath widths than at 45 MHz. Due to the reduction in  with increasing f and decreasing sheath width s, the wave effects are larger than at 45 MHz, with the sheath voltage and sheath width noticeably center-peaked along the wafer electrode. There are also visible wave effects along the larger grounded electrode.

Figure 8. 2D fluid-analytical results for a 500 sccm, 10 mTorr Cl2 discharge with  W@60MHz, showing the same diagnostics as in figure 4.
Download figure:
Standard image High-resolution imageIn figure 9, we present results as in figure 8 at a higher frequency of 72.5 MHz. For this case, a smaller drive power of 394 W gives the same base case electron density. In contrast to the previous lower frequency cases, the smaller wafer electrode sheath no longer dominates, but instead, the peak sheath voltages and sheath widths at the radial center are nearly equal for the smaller and larger electrodes. Figure 5(b) shows the imaginary (solid) and real (dotted) parts of the complex axial sheath field amplitude Ezs at the bottom (black) and top (grey) electrodes for the 72.5 MHz case. For the bottom electrode the imaginary part of Ezs dominates and points in the negative axial direction, while for the top electrode, the real part of Ezs dominates and points in the positive axial direction. Thus, at any point in time, the axial sheath fields of the bottom and top electrodes point in opposite directions and are nearly 90 degrees out of phase, indicating the presence of a strong antisymmetric component. Also, the voltage drop across the dielectric spacer drops sharply from about 220 V at 60 MHz to about 29 V at 72.5 MHz, indicating that the antisymmetric mode is nearly spatially resonant. Note that even near an antisymmetric mode resonance, we don't have a pure antisymmetric mode, but a linear combination of both symmetric and antisymmetric modes.
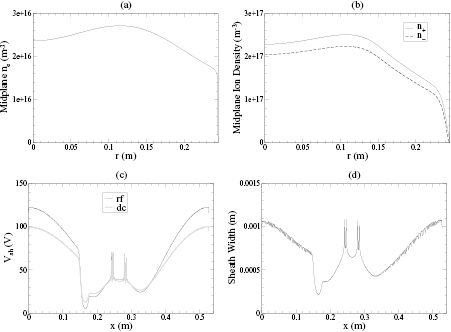
Figure 9. 2D fluid-analytical results for a 500 sccm, 10 mTorr Cl2 discharge with  W@72.5MHz, showing the same diagnostics as in figure 4.
Download figure:
Standard image High-resolution imageThe wavenumber of an antisymmetric mode surface wave is given by [7]

The first spatial resonance for the anti-symmetric mode would be at

where  is the first zero of the first-order Bessel function
  . For the 72.5 MHz case, using
  mm and
  cm in (6), we obtain
  .
.
In figure 10, we present results at 90 MHz near the first symmetric resonance, where a smaller drive power of 350 W gives approximately the same base case electron density. In this case, the wafer electrode sheath is again dominant, with significantly larger average sheath voltages than the grounded electrode, indicating a return to a primarily symmetric mode. However, a pure symmetric mode has no net current entering the exterior region, so there must still be a significant antisymmetric component, and the symmetric mode resonance condition (4) is not completely satisfied.

Figure 10. 2D fluid-analytical results for a 500 sccm, 10 mTorr Cl2 discharge with  W@90 MHz, showing the same diagnostics as in figure 4.
Download figure:
Standard image High-resolution imageAt 30 MHz, the midplane electron and ion densities are fairly uniform across the wafer with the electrons slightly peaked and the ions slightly depressed at the radial center. In highly electronegative discharges with high ion densities, the recombination rate starts to exceed the ionization rate at the radial center, causing the ion densities to become depressed in the center; this in turn, increases the ion density gradients and diffusive ion fluxes towards the center until a steady-state is achieved. As discussed above, the electrons in a highly electronegative plasma are fairly uniform with a slight maximum at the center where  goes to zero. At 45 MHz, the electrons and ions behave much as in the 30 MHz case, but the slight center high of ne is less noticeable at 45 MHz. For the same ne and Pe, the sheath widths and voltages are smaller at 45 MHz compared to 30 MHz. So, the bulk ambipolar field required to confine the negative ions to the core is smaller for the 45 MHz case, making the center electron peak less noticeable. At 60 MHz, the behavior of the midplane ion densities are similar to the lower frequency cases, but now the electrons are slightly peaked at the radial edge of the wafer electrode rather than at the radial center. As the frequency increases to 60 MHz, the system approaches the antisymmetric mode resonance near 72.5 MHz. In this case, not only the bottom wafer electrode, but also the top electrode exhibits a large radial potential gradient (high Er field) near the radial wafer edge at r = 15 cm. Thus, the bulk Ohmic heating and Te(r) become increasingly peaked at this radius, leading to an increased ionization rate and an
  peak near the radial wafer edge. This enhancement of the edge effect reaches its maximum at the antisymmetric mode resonance near 72.5 MHz. Once the frequency increases to 90 MHz, the system approaches the symmetric mode resonance, leading to increased fields and electron Te(r) heating at the radial center, which flattens the
  profile.
3. The 1D nonlinear transmission line (TL) model
In the 2D fluid-analytical model, all the field components are assumed to be proportional to  for a given frequency ω. This eliminates the time-dependence from the EM equations, greatly speeding up the EM solve, but at the cost of ignoring the generation of harmonics. Nevertheless, we can still observe the effect of harmonics by explicitly adding the important harmonics as the second and third input frequencies in the multifrequency discharge. In order to estimate the amplitude and phases of the generated harmonics, we use a 1D radial nonlinear transmission line (TL) model which we describe briefly below. A full description of the model is given in [1].
3.1. Model description
The model nonlinearly couples azimuthally symmetric waves and series resonance harmonics in a CCP consisting of two circular conducting electrodes of radius R separated by a gap width l, as shown in figure 11. All the rf quantities are assumed to be functions of radius r and time t. The discharge is driven at r = R by a source having resistance RT and voltage  through a large blocking capacitor CB. The discharge is assumed to be highly asymmetric with the sheath at the bottom wafer electrode much larger than that of the upper grounded electrode so that the grounded electrode sheath can be neglected. The sheath width s is also assumed to be much smaller than the bulk plasma width d so that
  . In addition to the rf voltage, a dc voltage appears across CB, placing a dc bias voltage
  across the electrodes. The model is not self-consistent since it solves for the discharge currents, voltages and sheath widths as a function of r and t assuming a specified uniform and constant ne and Te.

Figure 11. Schematic of the 1D radial nonlinear transmission line model of a highly asymmetric cylindrical discharge.
Download figure:
Standard image High-resolution imageThe nonlinearity of the charge-voltage relation generates harmonics which may be enhanced by series resonance. The series resonance between the plasma inductance and the sheath capacitance occurs at a frequency [23–26]
For a typical rf drive frequency ω,  . However since the sheath width s oscillates with time,
  sweeps across harmonics
  of the driving frequency so that
For a given ne (which determines  ), (8) defines the sheath widths that excite the various series-resonance enhanced harmonics of the driving frequency.
From (2), the wavenumber  of radially-propagating surface waves in the plasma is given by
where  is the surface wave frequency. For a voltage driven discharge (source resistance RT much smaller than discharge impedance), we expect to observe spatial resonances at

where  is the mth zero of the zero-order Bessel function
  . We expect the strongest spatial excitations to occur at the first resonance m = 1. Equating (9) with (10), we obtain
As the sheath width s oscillates with time,  sweeps across harmonics
  of the driving frequency, leading to
For a given ne (which determines leff), (12), defines the sheath widths that excite the various m = 1 spatial resonance enhanced harmonics of the driving frequency.
In summary, the oscillating sheath traverses a number of values of the series resonance corresponding to harmonics of the driving frequency. These interactions lead to harmonic powers well above those that would exist in the absence of the resonances. We look for the interaction of these harmonic resonances with the spatial wave resonances that can occur at the driving frequency and at higher harmonics of the driving frequency.
3.2. Simulations of chlorine CCP
The 1D nonlinear TL model is used to estimate the amplitude and phases of the harmonics that would have been generated in the 2D fluid-analytical simulations of section 2. Since the TL model assumes that the sheath of the bottom powered electrode is much larger than that of the upper grounded electrode, we are able to apply it to all the cases discussed in section 2 with the exception of the 72.5 MHz case, where there was no dominant electrode. In accordance to the configuration in section 2, we set l = 5 cm, R = 15 cm, p = 10 mTorr,  m−3,
m−3,  V, and the electron-neutral scattering rate coefficient
  m3 s−1 for the 1D nonlinear TL simulations. The last quantity (Kel) is obtained from [21] for a Cl2 discharge, assuming a gas temperature of 300 K and an electron temperature of 2.5 V. In order to take the skin effect into account, we calculate leff from the input l and ne, and use it in place of l in the 1D TL calculations. As with typical etching CCP reactors, we assume that the source resistance RT is small (i.e.
  ) so that the discharge is essentially voltage-driven, and that the wafer electrode is coated with an insulating dielectric.
From the series and spatial resonance conditions, (8) and (12), we see that is important to match the sheath widths rather than the sheath voltages. So, for each applied frequency f, the magnitude of the voltage source Vrf0 in the 1D nonlinear TL simulation is chosen to keep the maximum sheath width sm at the source (r = R) to be the same as that of the corresponding 2D fluid-analytical simulation in section 2. In the TL simulations,  is the maximum value of the time-varying sheath width s(R, t). For the 2D fluid-analytical simulations,
  is related to the time-averaged sheath width s(R) by
  [10, 22]. For the four cases with applied frequency f = 30, 45, 60, 90 MHz, the corresponding
  and Vrf0 values are
  , 3.7, 1.9, 0.55 mm, and
  , 1400, 350, 50 V respectively.
Figure 12 shows the TL simulation results of the electron power of the N harmonics PeN relative to the electron power of the fundamental frequency Pe1 for (a) 5000V@30MHz, (b) 1400V@45MHz, (c) 350V@60MHz, and (d) 50V@90MHz. For the 5000V@30MHz case, due to the high voltage, the nonlinearities generate small harmonic powers over a broad spectrum [1]. However, at this relatively low frequency, the fundamental dominates over the higher harmonics, as expected. For both the 1400V@45MHz and 350V@60MHz cases, we see significant higher harmonics that may be near spatial resonances which lead to center-high nonuniformities. For 50V@90 MHz, the fundamental dominates over the harmonics again since at 90 MHz, the fundamental is near the first symmetric spatial resonance, leading to center-high nonuniformities, as seen in the 2D fluid-analytical simulation at 90 MHz in section 2.

Figure 12. 1D nonlinear TL model results showing PeN relative to Pe1 for a 10 mTorr Cl2 discharge with  m−3 and
  V driven at (a) 5000V@30MHz, (b) 1400V@45MHz, (c) 350V@60MHz, and (d) 50V@90MHz.
Download figure:
Standard image High-resolution image4. 2D fluid-analytical simulations with harmonics
In this section, we reexamine two of the single frequency 2D fluid-analytical simulations in section 2 by adding harmonics as the second and third input frequencies of a multifrequency discharge. The relative amplitude and phases of the harmonics are estimated from the results of the corresponding 1D nonlinear TL simulations in section 3. We reran the 45 and 60 MHz cases with added harmonics since as seen in figure 12, they are the two cases with the most significant harmonic content.
For the single frequency 2D fluid-analytical simulations in section 2.2, the discharges are run at fixed rf input power Prf, as described in section 2.1. However, since the 1D nonlinear TL model calculates the electron power Pe, the multifrequency 2D fluid-analytical simulations in this section are run at fixed Pe. So, for each frequency  , the magnitude of the applied current IN at the source is adjusted after each EM solve to keep the corresponding electron power PeN fixed. The relative phases of the applied currents IN at the source are held fixed at the values determined in the corresponding 1D nonlinear TL simulation. The relative magnitudes of the PeN are also detemined by the corresponding 1D nonlinear TL simulation. The total electron power
  is set to keep the central ne approximately equal to the base case electron density of
  m−3.
m−3.
Figure 13(a) shows the 1D TL simulation results at 45 MHz for the normalized power deposition profile  per harmonic with
  . The 5th, 8th and 9th harmonics have the most center-peaked profiles. Thus, we ran with the 5th harmonic as the second input frequency and a combination of the 8th and 9th harmonic as the third input frequency. We added the amplitudes of the 8th and 9th harmonics and used the phase and frequency of the 9th harmonic as it appears to be more center-peaked and spatially resonant than the 8th harmonic. From figure 12(b),
  and
and  . A total
  W gives the base case electron density at 45 MHz. Thus, we set
  W,
W,  W, and
  W. In figures 14 and 15, we show the same information as in figures 6 and 7, but for the multifrequency case. Comparing the single to the multifrequency case, we see that the higher harmonics contribute significantly to the center nonuniformity. The electron temperature which was peaked at the wafer edge due to the electrostatic edge effect, now has an additional peak at the radial center due to the higher harmonics. In contrast to the fairly radially uniform sheath voltage of the fundamental, the sheath voltages of the harmonics are distinctly center-peaked. As a consequence of the enhanced heating at the center from the standing wave effect of the higher harmonics, the electron and ion densities, which were fairly radially uniform above the wafer electrode for the single frequency case, are now all distinctly center-peaked. The 2D fluid-analytical CCP model assumes an analytical Child–Langmuir sheath in which the sheath width
  . In the single frequency case,
  is fairly uniform over the wafer, and
  is slightly center-peaked, leading to a slightly center-peaked sheath width s. In the multi-frequency case,
  and
and  are both center-peaked so as r increases, the decrease in ne compensates for the decrease in Vsh to keep s fairly constant above the wafer. In order to test if the relative phases of the harmonics mattered, we also did a parallel run with the same conditions as above but setting all the phases of the applied input currents to zero. We found that changing the relative phases had no significant effect on the results.

Figure 13. 1D nonlinear TL model results showing normalized power deposition profile  for a 10 mTorr Cl2 discharge with
  m−3 and
  V driven at (a) 1400V@45MHz and (b) 350V@60MHz.
Download figure:
Standard image High-resolution image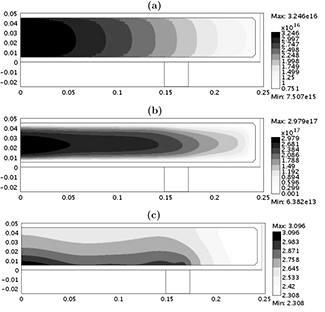
Figure 14. 2D fluid-analytical results for a multifrequency 500 sccm, 10 mTorr Cl2 discharge with Pe 139W@45MHz, 50W@225MHz, and 48W@405MHz, showing contour plots of the same diagnostics as in figure 3. (a) ne (m−3), (b)  , and (c) Te (V).
Download figure:
Standard image High-resolution image
Figure 15. 2D fluid-analytical results for a multifrequency 500 sccm, 10 mTorr Cl2 discharge with  W@45MHz, 50W@225MHz, and 48W@405MHz, showing the same diagnostics as in figure 4.
Download figure:
Standard image High-resolution imageFor the 60 MHz case, we see from figure 13(b) that the 3rd, 4th and 5th harmonics (180 MHz, 240 MHz and 300 MHz respectively) appear to have the most center-peaked profiles. So, we decided to use the 3rd harmonic as the second input frequency and a combination of the 4th and 5th harmonic as the third input frequency. We added the amplitudes of the 4th and 5th harmonics and used the phase and frequency of the 4th harmonic as it appears to be more center-peaked and spatially resonant than the 5th harmonic. From figure 12(c),  and
and  . A total
  W gives the base case electron density at 60 MHz. Thus, we set
  W,
W,  W, and
  W. In figure 16, we show the same diagnostics as in figure 8, but for the multifrequency case. Comparing the single frequency to the multifrequency case, we see that the higher harmonics contribute significantly to the powers and sheath voltages. As at 45 MHz, since the higher harmonics have shorter
  than the fundamental, the corresponding sheath voltages are more center-peaked, significantly increasing the center nonuniformity of the discharge. For the 45 MHz case, the series resonance harmonics generated by the 1D non-linear TL model are at 225 and 405 MHz, while for the 60 MHz case the series resonance harmonics are at the lower frequencies of 180 and 240 MHz respectively. Thus, the wave effects due to the higher harmonics are more visible in the 45 MHz driving frequency case than the 60 MHz driving frequency case.

Figure 16. 2D fluid-analytical results for a multifrequency 500 sccm, 10 mTorr Cl2 discharge with  W@60MHz, 48W@180MHz, and 51W@240MHz, showing the same diagnostics as in figure 4.
Download figure:
Standard image High-resolution image
5. Conclusions
A 2D fluid-analytical code [10] is used to study EM effects in an asymmetric, cylindrical CCP configuration (see figure 1) similar to those used in industry. The EM field solve was conducted in the linearized frequency domain so that the generation of harmonics due to nonlinearities was not included. However, since the code allows up to three driving frequencies, harmonics can be added to the code as the second and third input frequencies. The amplitude and phases of the harmonics used in these simulations were estimated using a recently developed 1D radial nonlinear transmission line model [1]. The harmonics can strongly couple to the series resonance and may also be spatially resonant. The latter effect is particularly important if the source impedance is small so that the device is essentially voltage-driven, which amplifies the generation of a centrally peaked voltage [1]. We conducted both single (fundamental only) and multifrequency (fundamental + harmonics) 2D fluid-analytical CCP simulations and compared the results.
For each case, a Cl2 gas flow of 500 sccm was set at the showerhead inlet, and a low pressure of 10 mTorr was set at the outlet. The midpoint ne was kept at a base case value of about  m−3 by adjusting the source power at each frequency. The discharge was highly electronegative with
  for all cases. Other runs (not discussed in this paper) were done at higher electonegativity by artificially enhancing the attachment rate. We found that for the same applied power, the positive ion density remains about the same but the electron density is inversely proportional to the electronegativity.
We first conducted a set of single frequency 2D fluid-analytical CCP simulations for a range of frequencies from 30 to 90 MHz. At the lowest simulated frequency of 30 MHz, the smaller wafer electrode was dominant with much higher sheath voltages and sheath widths compared to the larger grounded electrode, as expected. The discharge was quite radially uniform above the wafer electrode at this relatively low frequency, indicating that the plasma wavelength  at 30 MHz was much larger than the device dimensions. The electron temperature did show some enhancement at the wafer edge, but this was due to an electrostatic edge effect and not a wave effect. At higher frequencies of 45 and 60 MHz, lower source powers were required to maintain the base case electron density with accompanying lower sheath voltages and sheath widths. Although the discharges were still fairly uniform, the reduced
  at higher frequencies made wave effects more visible, especially for the 60 MHz case, where the sheath voltages and sheath widths became noticeably center-peaked. As with the 30 MHz case, the smaller wafer electrode was dominant.
At a higher frequency of 72.5 MHz, the system approaches its first spatial resonance with the sheath voltage at the radial center of the grounded electrode approximately equal to the sheath voltage at the radial center of the wafer electrode. There is also a change from a dominantly symmetric to dominantly antisymmetric mode. At the highest simulated frequency of 90 MHz, the wafer electrode becomes dominant again, and the system returns to a primarily symmetric mode.
For the cases with a dominant sheath (i.e. the 30, 45, 60 and 90 MHz cases), we applied the 1D nonlinear transmission line model to estimate the amplitudes and phases of harmonics that would be generated due to the nonlinearities. The 1D TL model assumes a uniform plasma density and Te, which as the 2D fluid model shows, are only approximations. Thus, the amplitude and phases of the harmonics generated in the 1D TL model are qualitative estimates that are inputed into the 2D fluid code in order to illustrate the various effects which may occur due to nonlinearities. For the 30 and 90 MHz cases, we found that the fundamental dominated over the harmonics, while for the 45 and 60 MHz cases, significant higher harmonics were generated. Thus we reran the 2D fluid-analytical CCP simulations for the 45 and 60 MHz cases with three frequencies, using two harmonics computed from the corresponding 1D nonlinear TL simulations. In both of these multifrequency simulations, the higher harmonics with their reduced  values contributed significantly to the center nonuniformity.
Acknowledgments
This work was supported by a gift from Lam Research Corporation and by the Department of Energy Office of Fusion Energy Science Contract DE-SC0001939.