
Abstract
The resurgence of infectious diseases and associated issues related to antibiotic resistance has raised enormous challenges which may possibly be confronted primarily by nanotechnology routes. One key need of critical significance in this context is the development of an agent capable of inhibiting quorum sensing mediated biofilm formation in pathogenic organisms. In this work we examine the possible use of a nanocomposite, CdTe–TiO2, as an impeder of growth and biofilm. In the presence of CdTe–TiO2, scanning electron microscopy (SEM) analysis shows exposed cells without the surrounding matrix. Confocal laser scanning microscopy shows spatially distributed fluorescence, a typical indication of an impeded biofilm, as opposed to the control which shows matrix-covered cells and continuous fluorescence, typical of biofilm formation. Quantitatively, the inhibition of biofilm was ∼57%. CdTe–TiO2 also exhibits good antibacterial properties against Gram positive and Gram negative organisms by virtue of the generation of reactive oxygen species inside the cells, reflected by a ruptured appearance in the SEM analysis.
Export citation and abstract BibTeX RIS
1. Introduction
Over use or misuse of antibiotics is inviting resistance amongst a variety of disease-causing bacteria, leading to the re-emergence of infectious diseases, thus posing a serious threat to public health [1]. Although various antimicrobial agents have been continuously developed and introduced as treatments, the morbidity and mortality associated with bacterial infections still remain high. This situation calls for novel strategies to identify and develop next generation drugs or agents to control and contain such bacterial infections.
One of the reasons why pathogenic organisms develop a resistance against therapeutics agents is their ability to form biofilm. Biofilms are defined as conglomerations of bacterial cells protected by a self-synthesized extra-polymeric substance (EPS) [2]. Although biofilm has been shown to play an important role in the pathogenesis of bacteria, there is debate on the role of the quorum sensing (QS) phenomenon in the formation of biofilm [3, 4]. The QS is an inter-cell communication aided by released chemical signals when the cell density reaches a critical concentration. A number of pathogenic bacteria have been shown to employ QS virulence determinants, for example, biofilm formation in Pseudomonas aeruginosa [5]. Biofilm's formation ability of pathogenic organisms has been implicated in a wide range of hospital infections [2]. As microorganisms are protected inside the biofilm, they show an increased resistance to antimicrobial agents, including antibiotics, compared to free-floating cells [6]. In the medical sector, biofilms have been implicated as the cause of serious infections; up to 60% of all human infections are caused by biofilms [7]. Biofilms protect their constituent cells in various ways, which makes it difficult to treat both clinical and industrial contaminations. Bacterial biofilm formation also causes significant economic loss in the industrial sector [8]. In industry, biofilms have been implicated in the contamination of installations in the food industry, decreased passage through pipelines by colonization of the interior of pipes, and resistance of vessels by initiation of 'biofouling' on the vessel hulls. The yearly economic loss caused by 'biofouling' in the marine industry is estimated at $ 6.5 billion [9].
Several strategies have been proposed to create bacteria-resistant surfaces to inhibit biofilm growth [10]; however, there are only a few reports on the use of nanoparticles as antibiofilm agents [11, 12].
Recent advances in the field of nanotechnology, particularly the ability to manipulate the phase, size, shape and functionality of inorganic, organic and hybrid nanosystems, have led to the development of new biocidal agents [13]. Titanium oxide (TiO2) is one of the promising candidates since it is inert and relatively nontoxic to humans as compared to several other oxides. Since the first report on the microbiocidal effect of TiO2 photocatalytic reactions [14], research interest in TiO2 in the biomedical context has grown dramatically, and many reports have appeared in the literature demonstrating the use of TiO2 as an antimicrobial agent [15–20]. In recent years, TiO2 sensitized nanostructures have been reported as microbial agents, particularly for disinfection of primary wastewater effluents [21]. Unfortunately, as TiO2 is a wide band gap material (3.2 eV), it does not absorb the visible or infrared portion of sunlight with photon energy below its band gap. UV light, on the other hand, can be absorbed by TiO2, but it can induce damage to human cells, prohibiting its use in living environments. A promising solution to this problem is to combine TiO2 with either dye molecules or narrow band gap semiconductors having appropriate HOMO–LUMO separation or band gap values, respectively, and align them with TiO2 electronic states, to effectively extend the absorption range of TiO2 for the desired photocatalytic function. As compared to dye molecules or polymeric sensitizers, semiconductor quantum dots (QDs) have two specific advantages as partners in nanocomposites with metal oxides. First, the band gap of the QDs can be tuned rather easily by varying their size, thereby allowing manipulation of their visible light response. Second, QDs can be used to harness hot electrons, generating multiple charge carriers by excitation with a single high-energy photon [22].
In light of the absence of any reports on the use of TiO2 or CdTe sensitized TiO2 as an antibiofilm agent, we have focused our attention on this issue in this work.
2. Experimental details
2.1. Materials and methods
Analytical grade mercaptopropionic acid (MPA) (SRL Chemicals), tellurium powder (Te), cadmium chloride (CdCl2) (SD Fine Chemicals), sodium borohydride (NaBH4) and titanium isopropoxide (TIP) (Merck Laboratories) were used as obtained. Deionized water was acquired from a Millipure Milli-Q system with resistivity greater than 18 MΩ cm. All biological studies were performed under ordinary laboratory light (70–90 Lux).
2.2. Synthesis of CdTe QDs and CdTe–TiO2 nanocomposite
CdTe nanoparticles capped with mercaptopropionic acid (MPA) were synthesized by an organometallic route [23]. Briefly, the colloidal CdTe QDs were prepared by a reaction between CdCl2 and NaHTe with MPA as a stabilizer. Under vigorous stirring, freshly prepared oxygen-free NaHTe was injected into a solution of CdCl2 and MPA. The resulting solution mixture was heated and refluxed under nitrogen flow at 100 °C for 2 h. All the steps in the above synthesis were carried out under inert conditions. CdTe QDs were then precipitated out from the growth solution after cooling by the addition of 2-propanol. Further purification was performed by centrifuging and reprecipitating from 2-propanol three times. The colloidal CdTe–TiO2 nanocomposite was prepared in the same way as stated above. Initially, as synthesized TiO2 nanoparticles were added to the reaction mixture. Then, CdTe QDs were synthesized as stated above in this reaction mixture. CdTe–TiO2 nanocomposite was then precipitated out from the growth solution after cooling by the addition of 2-propanol and further purified in the same way as stated above. The synthesis and the biological part of this study have been described in detail in the supporting information (SI, available at stacks.iop.org/Nano/24/195101/mmedia—1: detailed synthesis and biological part of the study). It is useful to mention here that the data were subjected to statistical analysis using GraphPad Prism (Version 6.0, USA). The data are expressed as mean ± SD. The mean values are compared with test and control samples. For antibacterial and antibiofilm assays, the means were compared with ANOVA and Dunnett's multiple comparison test. The level of significance was considered at p < 0.01.
3. Results and discussion
Various semiconductor QDs, such as CdS [24], PbS [25], CdSe [26], etc have been investigated as nanocomposite conjugates with TiO2 for effective visible light absorbance. However, CdTe QDs in conjugation with TiO2 nanoparticles are exploited for solar cells [27–31], photocatalysis [32] and photoelectrochemical studies [33]. We have chosen the CdTe–TiO2 nanocomposite because CdTe absorbs in the visible region (band gap 1.54–2.53 eV), and as the conduction band of CdTe is above that of TiO2, efficient electron transfer can occur from CdTe to TiO2 nanoparticles upon visible light excitation of the nanocomposite. It is possible to form a CdTe–TiO2 nanocomposite by employing a ligand consisting of a thiol group at one end and a carboxyl group at the other end. The use of bifunctional bridging ligands to form a more robust binding of TiO2 nanoparticles with CdTe QDs is, therefore, very promising [34]. TiO2 has a strong affinity for the carboxylate group, while thiol binds strongly with CdTe. Hence, a bifunctional linker molecule such as mercaptopropionic acid (HOOC–R–SH) (figure 1) can facilitate the binding of CdTe QDs to TiO2. Indeed, such an approach has been used to link CdSe or CdS to TiO2 [35, 36] as well as Au nanoparticles to TiO2 [37]. The MPA capped CdTe QDs allow photoinduced electron transfer to TiO2. In this respect there are many reports on photoinduced electron transfer between MPA capped CdTe QDs and metal oxides or certain anthraquinone dyes [38].
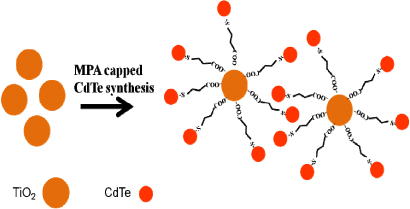
Figure 1. Schematic of bifunctional linking of CdTe QDs with TiO2 nanoparticles by MPA.
Download figure:
Standard imageFigure 2(A) shows the x-ray diffraction (XRD) patterns for the CdTe, TiO2 and CdTe–TiO2 nanocomposite. These patterns reflect cubic (zinc blende) crystal structure of CdTe, and tetragonal structure of the anatase phase of TiO2. The CdTe–TiO2 nanocomposite clearly shows the presence of both CdTe and TiO2. Figure 2(B) shows the UV–vis diffuse reflectance spectoscopy (DRS) spectra recorded for the CdTe, TiO2 and CdTe–TiO2 nanocomposite. The band edge of TiO2 appears at 393 nm (3.17 eV), while that for the CdTe nanoparticle appears at around 550 nm (2.25 eV). In the case of the CdTe–TiO2 nanocomposite, the band edge is observed to be close to that of the CdTe case and diffuse with band tailing character, possibly due to the interface states.

Figure 2. (A) XRD spectra of (a) CdTe QDs, (b) TiO2 nanoparticles and (c) CdTe–TiO2 nanocomposite; (B) UV–vis diffuse reflectance spectroscopy (DRS) spectra in the absorbance mode of CdTe (curve (a)), CdTe–TiO2 nanocomposite (curve (b)) and TiO2 (curve (c)); (C) photoluminescence spectra of CdTe (curve (a)) and CdTe–TiO2 nanocomposite (curve (b)); the inset of figure (C) chows the time dependent PL spectra of CdTe (curve (a)) and CdTe–TiO2 nanocomposite (curve (b)); (D) FTIR spectra of TiO2 (curve (a)), CdTe (curve (b)) and CdTe–TiO2 nanocomposite (curve (c)).
Download figure:
Standard imageIt is interesting to consider the energy level diagram of the CdTe–TiO2 nanocomposite. As shown in the schematic in figure 3, the conduction band edge of CdTe QDs is above that of the TiO2. When CdTe–TiO2 nanocomposite is exposed to visible light, excited electron–hole pairs are generated. Due to the specific nature of the band alignment at the TiO2/CdTe interface, the photogenerated electrons are transferred to the conduction band of TiO2, while the holes remain with the valence band of the CdTe QDs. These separated electrons and holes have a significantly enhanced recombination lifetime and are thus available for redox reactions and may play a role in the inhibition of growth/biofilm by the nanocomposite against bacteria, as discussed further in the text.
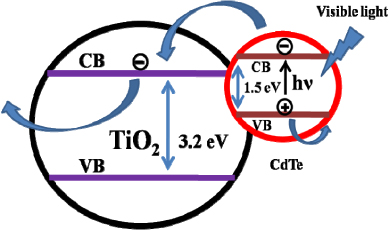
Figure 3. The energy level band alignment diagram of the CdTe–TiO2 nanocomposite.
Download figure:
Standard imageFigure 2(C) shows the photoluminescence (PL) spectra of the CdTe QDs and the CdTe–TiO2 nanocomposite. The excitation wavelength was the same for both the samples, namely 400 nm. The quantity of the two samples was taken to ensure that the CdTe content in the cases of only CdTe and CdTe–TiO2 composite was the same. Also, we ensured that the dispersion did not settle down in any significant way in the course of the quick PL measurement which took 20 s. Indeed, this was ensured by taking three successive readings and observing that the changes were not significant. The PL emission for CdTe is close to 540 nm while that for the CdTe–TiO2 nanocomposite is near 525 nm (blue shifted). The considerable (15 nm) blue shift of the PL peak could be due to surface oxidation of the samples [39], due to conjugation with TiO2. Also, it is noticeable that the emission intensity of the CdTe–TiO2 nanocomposite is significantly lower as compared to that of the CdTe QDs. This PL quenching reveals that there is a significant decrease in the number of excited electrons in the conduction band which can recombine radiatively with valence band holes in CdTe, due to transfer of these electrons to TiO2 attached to CdTe. Therefore, it can be concluded that most of the excited electrons are successfully injected into the TiO2 conduction band and are available for surface reactions.
Since the electron transfer in the CdTe–TiO2 composite assembly is likely to occur in a picosecond time frame (e.g. the electron transfer in the CdSe–TiO2 system was reported to have an average lifetime of 83 ps with a rate constant of 1.2 × 10⁻¹⁰ s−1 [40, 41]), time resolved photoluminescence can certainly shed light on the photoinduced charge-transfer processes. We performed the time resolved PL study with 400 nm laser pulse excitation (pulsed width 60 ps) and the results are shown in figure 2(C) (inset). The emission was measured at 560 nm. By fitting the data from the figure above (which clearly shows a dramatic difference between the two cases) the average lifetime in the case of the CdTe–TiO2 system was observed to be only 1.16 ns, much smaller than that in the case of the CdTe QDs, showing an average lifetime of 12.05 ns. The observed decrease in lifetime of the CdTe QDs is due to the charge transfer from the CdTe QDs to the TiO2. The charge-transfer rate constant can be estimated by the expression [42]
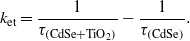
The electron-transfer rate constant calculated from the observed lifetime measurement is ∼7.7 × 10⁸ s−1. The data on just CdTe nanoparticles imply that for this case there is a distribution of lifetimes from the picosecond (prompt) to the nanosecond (delayed) time regime. The prompt component can be attributed to direct excitonic recombination while the delayed one can be attributed to the recombination via low lying trap states. Interestingly, in the case of the CdTe–TiO2 composite, the delayed lifetime component is clearly and fully quenched. This confirms that the excited electrons are transferred to TiO2 and hence do not get an opportunity to access low lying trap states [43, 44].
Figure 2(D) shows the Fourier transform infrared spectroscopy (FTIR) spectra of the CdTe, TiO2 and CdTe–TiO2 nanocomposite. In the case of TiO2, one broad band is seen near 3190 cm−1 and another one near 1642 cm−1, which correspond to surface-adsorbed water and hydroxyl groups [45]. These peaks are also present in the CdTe and CdTe–TiO2 nanocomposite. The IR absorption in the spectral range of 600–1200 cm−1 has been assigned to the surface vibrations of the Ti–O bonds, and signatures in this range are present in both the TiO2 and the CdTe–TiO2 nanocomposite [46]. In the case of the CdTe QDs the peak at 1575 cm−1 corresponds to symmetric vibration of the carboxyl group (COO−) of the MPA. This peak shifts to 1550 cm−1 in the case of the CdTe–TiO2 nanocomposite, indicating binding of the carboxyl group to TiO2 as COO–Ti linkage [47].
In figure 4(a) TEM and high resolution transmission electron microscopy (HRTEM) images of the CdTe–TiO2 nanocomposite are shown. These reveal the presence of both the particles, i.e. TiO2 and CdTe. Also, it is clear from figure 4(a) that there is a homogeneous distribution of TiO2 and CdTe QDs. The average size of the CdTe QDs is ∼3–4 nm and that of the TiO2 nanoparticles is 10–12 nm. The HRTEM image shows well defined lattice fringes with a d-spacing of ∼0.37 nm corresponding to the (111) planes of cubic CdTe crystal structure and lattice fringes with d-spacing of ∼0.35 nm, corresponding to the (101) planes of anatase TiO2 crystal structure. Figure 4(b) also clearly shows the attachment of CdTe QDs to TiO2 nanoparticles (marked). Also, some images of pure CdTe QDs and TiO2 nanoparticles are given in the supporting information (SI, available at stacks.iop.org/Nano/24/195101/mmedia 2a: HRTEM images of CdTe QDs and 2b: HRTEM images of TiO2 nanoparticles).

Figure 4. (a) TEM (scale bar 10 nm) and (b) HRTEM (scale bar 5 nm) images of the CdTe–TiO2 nanocomposite, (c) SAED patterns of three cases of interest ((A) corresponds to CdTe–TiO2 nanocomposite, (B) corresponds to TiO2, (C) corresponds to CdTe, * corresponds to brookite phase).
Download figure:
Standard imageFigures 4(A)–(C) represent the SAED patterns of the CdTe–TiO2, TiO2 and CdTe, which establish the presence of the desired phases. The rings for TiO2 are sharper, indicating a larger size of the nanoparticles (with the presence of dots showing good crystallinity), while those of CdTe are diffuse, reflecting a much smaller size. Interestingly, due to the overlap of lattice parameters for different planes of TiO2 and CdTe (as indicated in the SAED of the composite), the attachment of CdTe occurs along specific planes, leading to coherence in their reflection.
In this work we have explored the biological application of the CdTe–TiO2 nanocomposite (as discussed below) to inhibit/kill the growth of Gram positive and Gram negative types of bacteria, and to impede QS mediated formation of biofilm in a P. aeruginosa. We have studied the antibacterial action of the said nanocomposite by determining the minimum inhibitory concentration (MIC) by a dye reduction method and the minimum bactericidal concentration (MBC) by counting the number of viable organisms as colony forming units per milliliter (cfu ml−1), which are respectively the lowest concentrations of a compound that inhibit bacterium growth and kill 99.9% of organisms (3log), respectively, vis a vis the control (initial number of inoculated cells). In the MIC determination by the dye reduction method one uses a redox dye, resazurine, which shows a deep blue color in its oxidized state and a purple color in its reduced state. When the bacterial cells are viable and metabolically active (i.e., in the growing stage) oxidative enzymes present inside the cells reduce the dye to a purple color. On the other hand, when the cells are metabolically inactive (e.g., in the presence of NPs), the deep blue color of the dye remains unchanged. During the determination of MIC, when the cells of the test organism (approximately 1 × 10⁷ cells ml−1) were subjected to an increasing concentration of NPs in Muller–Hinton (MH) broth and incubated for 12 h under visible light (70–90 Lux), a gradual decrease in the pink coloration of the dye was observed in contrast to the control, indicating inhibition of the growth of the test organisms. The break point, the first concentration at which there was a change in the color of the dye from pink to blue (the MIC value), was obtained as 125 μg ml−1 for B. subtilis and for E. coli in the presence of CdTe–TiO2 nanocomposite, and it was more than 250 μg ml−1 for B. subtilis and E. coli in the presence of TiO2 NPs. Thus, the CdTe–TiO2 nanocomposite was seen to act on both Gram positive and Gram negative organisms, while TiO2 was less effective or non-active on both types of organism. It is useful to point out that in the dark and under similar laboratory conditions, TiO2 did not show inhibition of either group of bacterium, whereas CdTe–TiO2 showed a marginal inhibition of both the groups of bacteria. As the nanocomposite showed an antibacterial activity in the presence of light, we also explored the dependence of the antibacterial activity on the intensity of the light by changing the distance between the source of the light and the antibacterial assay plate. When the cells of B. subtilis and E. coli (approximately 1 × 10⁷ cells ml−1) were subjected to the respective MIC of the nanocomposite under increasing light intensities, namely 160, 305, 624 Lux, it was observed that the number of viable cells remained nearly the same; thus, it seems that increase of the intensity of light above the base background intensity of 72 Lux did not affect the antibacterial activity of the nanocomposite any further. Thus, all subsequent studies were performed at 72 Lux intensity of light.
While the MIC determination yields information about the compound as a bacteriostatic agent, it does not give any information regarding the bactericidal nature of the particles. Knowledge on the bactericidal property of compounds is highly desirable over that of the bacteriostatic property, as the former property inhibits the growth of bacteria irreversibly.
When aliquots from all MIC-wells were spread on an MH agar plate, and incubated for 24 h to develop colonies, if any, it was found that there was a reduction in the number of viable cells as the concentration of the compound increased, in comparison to the control (initial number of inoculated cells, approximately 1 × 10⁷ cells ml−1).
The first concentration of the CdTe–TiO2 nanocomposite that reduced the number of viable cells to 99.9% or more (3log or more than 3log) was the same as (in fact slightly less than) the MIC, and the scenario with the TiO2 NPs was similar, as seen in figure 5. The colony forming units per milliliter (cfu ml−1) of B. subtilis decreased from approximately 107 to 104.8 (125 μg ml−1) in the presence of CdTe–TiO2, while in the presence of TiO2 they decreased negligibly, thus indicating that the CdTe–TiO2 nanocomposite is bactericidal in nature, whereas the TiO2 NPs are almost non-active.
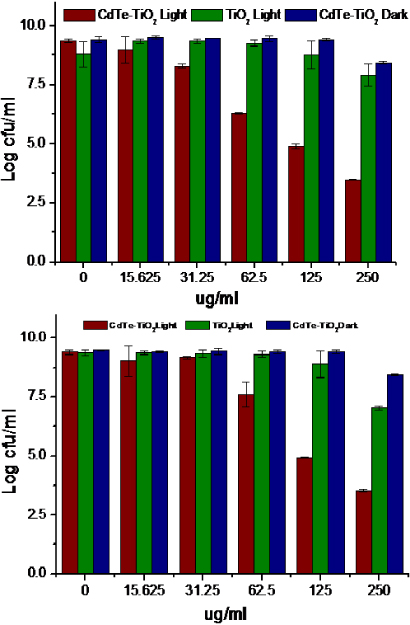
Figure 5. Determination of the minimum bactericidal concentration of the CdTe–TiO2 nanocomposite against (A) B. subtilis and (B) E. coli. The cells of the microorganisms after being subjected to various concentrations of composite showed a reduction in the number of cells. CdTe–TiO2 showed a 3log reduction (99.9% reduction) at 125 μg ml−1 against B. subtilis while TiO2 NPs required a higher concentration to achieve the same results. CdTe–TiO2 and TiO2 showed similar results against E. coli. The error bars represent the standard deviation (n = 3).
Download figure:
Standard imageThe inhibition of growth by TiO2 could be because of the fact that a normal laboratory environment has fluorescent lighting, with conventional fluorescent lamps emitting 4% UV light. Thus, there is a possibility that TiO2 is 'activated' by this small amount of UV component or by the visible light prevalent in the laboratory [20]. Given the photocatalytical usefulness of TiO2 and its derivatives, it is not surprising to find numerous reports of the antibacterial activity of TiO2-based nanocomposites [21]. To the best of our knowledge, there are no reports of the use of CdTe–TiO2 nanocomposite as an antimicrobial agent. Our study finds significance as it provides a new perspective for the application of CdTe–TiO2 in the field of nanobiotechnology.
The toxic effects of CdTe QDs against bacteria are limited and the origins of the same are under debate [48, 49]. In an effort to study the toxicity of CdTe QDs towards bacteria, Dumas et al [50, 51] quantified the toxicity of CdTe QDs against four test strains of bacteria (two Gram negative and two Gram positive) as a function of time and QD concentration, and argued that Gram positive strains show a direct electron transfer to CdTe, leading to changes in the membrane potential upon nanoparticle binding, while Gram negative strains do not show these effects. Not only bare CdTe QDs, but also capped QDs were shown to possess antimicrobial activity. Li et al [52] have shown the biological effect of mercaptoacetic acid (MPA)-capped CdTe QDs on Halobacterium halobium R1 and suggested that the bacterial survivability and the degree of damage are dependent on the concentration of QDs. The mechanism of cyto-toxicity of QDs was also related to the decomposition of QDs and release of cadmium ions. Han et al [53] have prepared water-soluble N-acetylcysteine (NAC)-capped CdTe QDs and shown the size dependent toxicity of CdTe QDs on Saccharomyces cerevisiae. In order to quantify the growth of test organisms in the presence of a nanocomposite with time, the growth kinetics of model organisms was examined by measuring the specific growth rate as a (μ) from the slope of the semi-logarithm of the exponential phase. Cells of B. subtilis and E. coli were grown until the initial log phase (cfu ml−1,1 × 10⁷) and then added with the MIC value of the nanocomposite and incubated at 37 °C, with periodic determination of viable count after every 15 min. During the exponential growth phase, the bacterial culture mimics a first-order chemical reaction, i.e. the rate of increase/decrease of cells is proportional to the number of bacteria present at that time, and the constant of proportionality, μ, is represented as an index of the growth/death. The rate of change of cell number= μ × number of cells.
The value of μ can be determined from the following equation:

or alternatively

where μ is the growth/death rate, N is the number of cells (as cfu ml−1) after time t = tn minutes, N0 is the initial number of cells (as cfu ml−1) at time t = t0 minutes, T is the time in minutes at which number of cells was N and T0 is the time in minutes at which number of cells was N0.
Thus, by measuring the change in the number of cells during a certain time period, the growth/death rate constant (μ) can be calculated. When cells of B. subtilis and E. coli (in the logarithmic growth phase) were subjected to the MIC value of the CdTe–TiO2 nanocomposite, the growth rate was seen to decrease (figure 6). In other words, death of the model organisms was observed. Therefore, μ in the present context denotes the specific death rate. As expected, the specific death rates of the test organisms in the presence of TiO2 NPs were slightly affected. We restricted the death rate measurements to three hours as the decrease in the growth was linear thereafter. While E. coli showed a linear increase in the death rate of 0.58 h−1, two distinct death rates could be observed in B. subtilis: 0.40 h−1 from 0 to 60 min and 6.5 h−1 from 60 to 180 min. As the cells of the model organisms were in the initial logarithmic phase, they were all in a similar physiological state, so upon addition of CdTe QDs there was a linear decrease in the growth rate. However, the linear decrease in growth rate was drastic after 60 min in B. subtilis. During an initial interaction of the nanocomposite with the cells, some of the nanocomposite adheres to the cell wall while the rest penetrates the cell surfaces. As the mechanism of action of the nanocomposite on cells of model organisms was shown to be via the generation of reactive oxygen species (ROS) (see the following section) and since the generation of ROS is a time dependent process, it was likely that the maximum repertoire of ROS was produced after 60 min; hence the observation of a drastic decrease in the growth rate of B. subtilis. Unlike our microbiological method, the quantitative index of microbial activity of S. cerevisiae in the presence of CdTe QDs has been studied by microcalorimetric methods [53]. However, the linear decrease in the growth rate of B. subtilis and E. coli observed in the present study was different from that in S. cerevisiae, because the cells of the inoculums that were seeded with the nanocomposite were in the logarithmic phase. In fact, the CdTe QDs were so effective that an inherent mechanism of adaptive response of the organism to stress [54], a general mechanism, was not observed in our case. Despite the differences in the methods of measuring the growth rates of the model organisms in the presence of the nanocomposite, a common feature noted was that when QDs were added to the system, the multiplying metabolism of the microorganism was affected, which resulted in change of the rate constant, μ. The antibacterial activity of CdTe QDs has been shown to occur by the generation of ROS [55]. Hence, in order to verify the CdTe–TiO2 mediated generation of ROS, we carried out detection of ROS inside cells of B. subtilis and E. coli by a fluorescent dye-based spectroscopy method, using 5-(and-6)-carboxy-2,7-dihydrodifluorofluorescein diacetate (H2DFFDA). In this assay, hydrophobic DCFH-DA molecules readily penetrate cellular membranes and are hydrolyzed by intracellular esterases to yield dichlorofluorescein (DCFH), a nonfluorescent compound. DCFH can then be oxidized by ROS to the fluorescent compound dichlorofluorescein, DCF (see figure 8).

Figure 6. Determination of the growth rate (μ) of (A) B. subtilis and (B) E. coli in the presence of CdTe–TiO2 nanocomposite. Cells in the logarithmic phase were added at the MIC values of the nanocomposite, and colony forming units were calculated after certain specific time intervals. Growth rates (μ) were calculated from the linear portion of the growth kinetics curve obtained by plotting cfu ml−1 on the x-axis and time on the y-axis. The error bars represent the SD (n = 3). ∗∗ denotes p < 0.01.
Download figure:
Standard image
Figure 7. The cell surfaces of B. subtilis and E. coli in the presence of CdTe–TiO2 nanocomposite. The corresponding fluorescent microscopy images of (upper) B. subtilis and (lower) E. coli for the detection of intracellular ROS generation (H2DFFDA staining) showed generation of ROS inside the cells of B. subtilis .
Download figure:
Standard image
Figure 8. Pictorial representation of the interaction of CdTe–TiO2 with bacterial cells: the CdTe–TiO2 nanocomposite interacts with the cell membrane and the cytosolic content of the cells and upon illumination with visible light generates ROS which attacks the membrane and cellular DNA and proteins, ultimately leading to cell death.
Download figure:
Standard imageWhen the cells of B. subtilis and E. coli (approximately 1 × 10⁷ cells ml−1) were subjected to sub-inhibitory concentrations of CdTe–TiO2 nanocomposite and TiO2 NPs in the presence of visible light, the generation of green fluorescence inside cells could be observed only in the presence of CdTe–TiO2, while no such fluorescence was observed in the case of TiO2 NP treated cells, or in the control. As seen in figure 7, the fluorescence inside the cells is a clear indication of the generation of ROS and the associated antibacterial property observed for the nanocomposite case. As the generated ROS acts on the cell membrane and damages the cell, as is observed in CdTe QDs [55], it is likely that the generation of ROS damages the cell membranes of model organisms.
As the initial interaction of the nanocomposite with the bacterial cells occurs through the cell walls, the difference in the chemical structure of the latter is a crucial factor in determining the generation of ROS and antibacterial activity. Due to the fact that the cell membrane of a Gram negative organism possesses an additional outermost layer of lipopolysaccharides, and the observation that the antibacterial action of the nanocomposite on the model organisms was time dependent (figure 6), the number of nanocomposites reaching and attacking the cell membrane of the Gram positive organisms was greater as compared to the Gram negative organisms; thus, a larger amount of ROS was produced in the Gram positive organisms during the time of assay, as is evident from figure 7. Our finding is in agreement with Premanathan et al and Azam et al who reported that nanoparticles of ZnO, CuO and Fe2O3 have a more pronounced effect against Gram positive bacterial organisms than Gram negative bacterial strains [56, 57].
Thus, in an effort to further prove the ROS dependent damage of the cell membrane, if any, we carried out SEM analysis of cells of the model organisms in the presence of an inhibitory concentration of nanocomposite. If the nanoparticles act on the cell membrane, the cell wall will be ruptured and thus will be seen as an irregular/rough shaped structure under SEM. In the presence of the CdTe–TiO2 nanocomposite, while the cells of B. subtilis were seen with ruptured morphology with cytoplasm content oozing out, the cells of E. coli were seen with a wrinkled appearance, although the cell morphology was entire (figure 9). This was in contrast to the case of the corresponding control which showed a typical structural shape with a smooth surface and entire margin, as seen in figure 9. Thus, we not only studied the antibacterial activity to CdTe sensitized TiO2, but also in effect tested the generally proposed theory of ROS mediated antibacterial action, with fluorescence and scanning electron microscopy.

Figure 9. SEM images of cells of B. subtilis (left) and E. coli (right). The cell surfaces of B. subtilis and E. coli in the presence of CdTe–TiO2 nanocomposite, at the respective MIC values, under SEM show the presence of ruptures and pits. The cell surfaces of B. subtilis and E. coli were unaltered in the presence in TiO2. In contrast, the corresponding control cells under similar conditions show a smooth surface with an entire margin, typical of a rod shape.
Download figure:
Standard imageThree different mechanisms have been postulated for the entry of nanoparticles, nanocomposites and QDs inside the cells of prokaryotes: (a) nonspecific diffusion, (b) nonspecific membrane damage and (c) specific uptake. In this study, the entry of QDs inside the cells could not occur by nonspecific diffusion as the mean estimate of the effective hole radius in the walls of E. coli is 2.06 nm (2.12 nm for B. subtilis) [58] which is smaller than a typical 2–10 nm QD. Specific uptake by the permease system is also not thought to occur as the pore size in the wall is 6 nm [59] smaller than the average size of the nanocomposite (10–15 nm). Nonspecific membrane damage could be the mechanism of entry for QDs inside the cells of the model organisms as QDs generate ROS in the system, which damages the cell membrane (see the following section). In fact, nonspecific membrane damage has also been observed for the entry of halogenated QDs inside cells [13].
The second application that we have proposed in this study is the use of nanocomposites as an antibiofilm agent (anti-QS). The primary trigger for the evolution of antimicrobial resistance in microorganisms is the selection pressure owing to overuse and misuse of antibiotics [60]. It has been reported that microorganisms subjected to nanoparticle based antimicrobial therapies have generated resistance [61], thus, there is a need to devise a strategy that will not trigger evolution pressure in the target organism against the nanoparticles. In an effort to search for strategies that are neither antimicrobial nor add a selection pressure on target organisms to develop resistance and virulent attributes of the organisms, which are growth independent, QS mediated biofilm inhibition approaches have been explored [62–68]. In this instance, it has been shown that a QS mediated process, for example, biofilm formation, is not essential for growth and survival, but is required to gain an advantage in an organism to become established as an infection or colonize an area; its inhibition was shown to make an organism susceptible to antibiotics and to not give the organism an attribute to colonize surfaces. Previous studies using light activated antimicrobial material have shown an inhibition of biofilm [69]. Therefore, with this purpose, we decided to explore the possibility of the nanocomposite as an impeder of biofilm in P. aeruginosa. Under the influence of visible light, when cells of P. aeruginosa (approximately 1 × 10⁶ cells ml−1) were subjected to various concentrations of nanocomposite, it was observed that only CdTe–TiO2 nanocomposite inhibited the biofilm formation; TiO2 was very much less effective. In the dark, the inhibition of the biofilm was less than 5%. Quantitative determination of the inhibition of the biofilm was carried out by crystal violet retention assay (since crystal violet has a high affinity towards the polysaccharides) in 24 well microtitre polypropylene plates under static conditions. When P. aeruginosa was grown in different concentrations of the CdTe–TiO2 nanocomposite (31.25–250 μg ml−1), it was found that at 62.5–125 μg ml−1 there was a decrease in the formation of biofilm by approximately 50–60%, as compared to the control, which can be clearly seen in figure 10. Therefore, until 125 μg ml−1 the nanocomposite significantly arrested biofilm formation without affecting viability, whereas at concentrations above this value, the growth of the organism itself was inhibited. A quantitative small decrease in the biofilm formation in the presence of TiO2 can be explained on similar lines to the antibacterial activity of TiO2. A clear picture of the inhibition of biofilm emerged under SEM; this is shown in figure 11 (left).

Figure 10. Quantification of biofilm formation. Cells of P. aeruginosa at various concentrations of nanocomposite showed a reduction in formation of biofilm by 57% until 62.5–125 μg ml−1 in the presence of CdTe–TiO2 nanocomposite; however, TiO2 did not show an inhibition of biofilm. The error bars represents the standard deviation (n = 3).
Download figure:
Standard image
Figure 11. SEM (left) and CLSM (right) analysis of biofilm. Under SEM, cells of P. aeruginosa in the presence of 125 μg ml−1 of CdTe–TiO2 nanocomposite were seen as profusely distributed without the outer covering of matrix (biofilm), and there was barely an inhibition in the presence of TiO2, as opposed to control wherein the cells were all embedded and covered by a matrix, a biofilm. Under CLSM, cells of P. aeruginosa in the presence of 125 μg ml−1 of CdTe–TiO2 nanocomposite were seen with a continuous fluorescence, typical of intact biofilm. However, in the presence of the composite, the fluorescence was spatially distributed, indicating a truncated formation of biofilm. Also note the decrease in the depth of the biofilm in the presence of CdTe–TiO2 nanocomposite, in comparison to the control. (The scale bars in all SEM figures correspond to 10 μm.)
Download figure:
Standard imageWhen the cells of P. aeruginosa (1 × 10⁶ cells ml−1) were seen under SEM, a smooth layer with covered uniform cells was observed i.e., cells embedded in polysaccharides, typical of biofilm structure. However, in the presence of the CdTe–TiO2 nanocomposite, cells of P. aeruginosa were seen as uncovered structures, with exposed cells. A biofilm observed under SEM is a complex of polysaccharides, synthesized by growing cells in response to QS; however, in the presence of nanocomposite, it is likely that the QS is disturbed, and hence an intact structure of biofilm was not observed under SEM. The present finding can be supported by the observation of Jagtap et al [70], wherein silver nanowires were shown to impede the formation of biofilm in P. aeruginosa.
A three-dimensional image of the formation of biofilm in the presence of nanocomposite by confocal laser scanning microscopy (CLSM) also confirms the SEM results and is shown in figure 11 (right). We used concanavalin A alexaflour 488, since it has affinity towards mannopyranosyl and glucopyranosyl residues of the biofilm. The CLSM images showed a continuous intense green fluorescence in the control as opposed to spatially distributed fluorescence in the presence of CdTe–TiO2, indicating a truncated/impeded formation of biofilm in P. aeruginosa. In fact, the depth of the fluorescence (biofilm) in the presence of CdTe–TiO2 decreased by 5–6 μm in comparison to the control. Thus, CdTe–TiO2 may find a promising place as an antibiofilm material against various clinically relevant bacteria.
Nanoparticles of zinc, copper, titanium, iron oxide, magnesium fluoride and silver have been reported to inhibit biofilm formation on various medical devices [71]; however, CdTe–TiO2 outsmarts these materials as a novel material because CdTe QDs of two different surface chemistries (carboxyl [−COOH] and polyethylene glycol [PEG] modified) have been shown to colocalize with extracellular proteins [72], and thus could have been the reason for the biofilm inhibition in P. aeruginosa. There have been contrasting reports on the efficacy of TiO2 based photocatalytical inhibition of biofilm formation. While the available report [73] did not show a TiO2-based photocatalytic inhibition of the biofilm in P. aeruginosa, our study introduces an application of CdTe–TiO2 as an impeder of biofilm formation in P. aeruginosa. This could have been possible, presumably, by overcoming the difficulties associated with the generation and subsequent action of ROS on the cells of P. aeruginosa, as reported in [73]. In light of a recent study [74], wherein an inhibition of biofilm was shown by generation of ROS species, it can be hypothesized that in the present study generation of ROS is also playing a similar role in the inhibition of biofilm formation in P. aeruginosa.
Fundamentally important is the fact that the concentration value at which there is a reduction in the formation of biofilm did not inhibit or kill the growth of bacteria by more than 15–20%. This is a critical factor, as it indicates that the inhibition of the biofilm may not be only due to reduction in the number of viable cells. This can be explained by the fact that biofilm formation in P. aeruginosa is partially dependent on the QS phenomenon [4, 5, 75, 76], and it can be speculated that the nanocomposite in the present study is inhibiting the QS phenomenon (although further validation is required to prove this). Thus, given the importance of the QS mediated biofilm inhibition by CdTe–TiO2 in P. aeruginosa, it is not surprising that there are many reports on the use of synthetic/natural compounds to control biofilm formation. However, these agents are organic in nature, have less stability and may not find sustainable use in medical and environmental applications. The synthesis of CdTe–TiO2 nanocomposite is important as it may attenuate the pathogenicity of organisms without imposing the level of selective pressure associated with antibacterial treatments. Indeed, there is proof-of-concept from studies that the virulence of the pathogenic organisms can be partially attenuated in vivo by the inhibition of biofilm [77]. The cyto-toxicity of QDs is mainly dependent on their surface molecules, provided of course that the attachment of the capping agent is robust and stays intact in the biofluid [78]. In this regard, it is important to mention that there were no effects of the capping agent, either on antimicrobial activity or on biofilm formation, thus ruling out the possibility of the observed effect being due to the material of the capping agent (MPA). Given the fact that pre-treatment of cells with antioxidant [79] protects the cells from the toxicity of QDs, it can be affirmed that the as-prepared QDs can be tailored to tackle the cyto-toxicity, if any, so that they can act as promising alternative therapeutics to tackle the menace of biofilm forming organisms.
4. Conclusions
On the basis of our results we can conclude that the CdTe–TiO2 nanocomposite is a promising candidate for the photocatalytic destruction of bacterial cells. In experiments with B. subtilis and E. coli, the enhancement in antibacterial property by CdTe–TiO2 was concentration and time dependent. We propose that the enhanced antibacterial property by CdTe–TiO2 is attributable to the light-induced production of greater quantities of reactive oxygen species. The decrease in the formation of biofilm in P. aeruginosa in the presence of CdTe–TiO2 implies that it is one of the favorable materials for the inhibition of the QS phenomenon in other clinically pathogenic bacteria. Since there was no appreciable reduction in the number of viable cells of P. aeruginosa in the presence of CdTe–TiO2, the latter does not add selection pressure for the evolution of antibiotic resistance in pathogens.
Acknowledgments
Haribhau Gholap acknowledges research funding from the University Grant Commission (UGC), India, providing a Teacher Fellowship under the Faculty Improvement Programme (FIP), and the National Chemical Laboratory (CSIR-NCL), Pune and Fergusson College, Pune, India for the research facility. SBO acknowledges funding support from CSIR and DST, Govt of India. WNG acknowledges funding support from a Departmental Research and Development Grant, University of Pune, and a University for Potential Excellence programme phase I.