
Abstract
A chemical defect healing of reduced graphene oxide (RGO) was carried out via intramolecular cross-dehydrogenative coupling (ICDC) with FeCl3 at room temperature. The Raman intensity ratio of the G-band to the D-band, the IG/ID ratio, of the RGO was increased from 0.77 to 1.64 after the ICDC reaction. From XPS measurements, the AC=C/AC−C ratio, where the peak intensities from the C=C and C–C bonds are abbreviated as AC=C and AC−C, of the RGO was increased from 2.88 to 3.79. These results demonstrate that the relative amount of sp2-hybridized carbon atoms is increased by the ICDC reaction. It is of great interest that after the ICDC reaction the electrical conductivity of the RGO was improved to 71 S cm−1, which is 14 times higher than that of as-prepared RGO (5 S cm−1).
Export citation and abstract BibTeX RIS
1. Introduction
Graphene is defined as a two-dimensional carbon material comprising sp2-hybridized carbon atoms arranged on a hexagonal lattice [1, 2]. It is a unique material due to its extraordinary properties which include high electrical and thermal conductivity, high charge carrier density, carrier mobility, optical properties, thermal stability, and mechanical properties [3–6]. Since its discovery [1, 2], the variety of physical phenomena of graphene has expanded at a remarkably fast pace and inspired a wide variety of novel technological applications [7–9]. Large-scale processing of graphene using chemical exfoliation methods has attracted intense interest. The chemical exfoliation method is versatile because it is low cost, scalable, and capable of depositing graphene on a wide variety of substrates; this is not possible using other processes such as cleavage or chemical vapor deposition. Furthermore, this method can be extended to produce graphene-based composites for special applications. The large-scale production of graphene sheet involves the following steps: oxidation of graphite to graphene oxide (GO) followed by chemical exfoliation and reduction via thermal heating [10] or a reducing agent such as hydrazine [11]. In this manner, reduced GO (RGO) is obtained. The reduction of GO with hydrazine utilizes the solution process, which enables simple processing and large-scale production. This reduction method removes the oxygen atoms from the GO and converts sp3- to sp2-hybridized carbon atoms. However, it is difficult to repair the defect sites that occur on the GO as a result of the corrosive chemical oxidation, as shown in scheme 1.
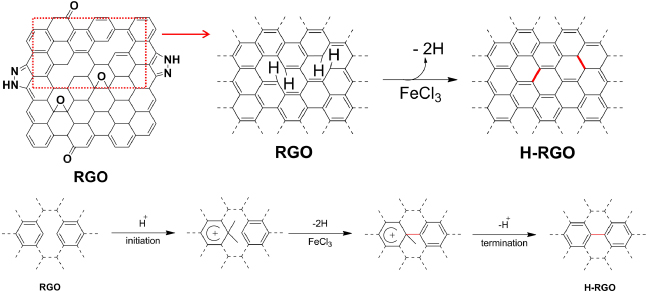
Scheme 1. Schematic representation of the chemical defect healing of reduced graphene oxide (RGO) (top) and the chemical mechanism of intramolecular cross-dehydrogenative coupling (ICDC) with FeCl3 (bottom).
Download figure:
Standard imageDue to the presence of the defect sites, RGO does not possess the dramatic physicochemical properties of graphene; e.g., the electrical conductivity of graphene made by mechanical exfoliation of highly oriented pyrolytic graphite is greater than 700 S cm−1, while the conductivity of RGO is only 5 S cm−1 [12, 13]. The electrical properties are significantly influenced by the disorder and defect sites on RGO. To date, significant effort has been made toward recovering the defect sites of RGO by various methods such as chemical doping [14, 15], thermal annealing with hydrocarbon [14, 16], plasma treatment [17], and absorption of highly conductive noble nanoparticles such as platinum and gold [18]. Thermal annealing with hydrocarbon and plasma treatment is a good way to restore defect sites on the graphene surface. However, this kind of method requires high temperature. The absorption of highly conductive noble nanoparticles is also known to be an effective way to improve the electrical conductivity of graphene. However, this method just fills the RGO with highly conductive nanoparticles. It does not change the chemical bonds from sp3-hybrid carbon to sp2-hybrid carbon. Hence, as time goes by, the electrical conductivity of nanoparticle filled graphene decreases due to detachment of the substituted nanoparticles. Thus, it is essential to improve the electrical conductivity of RGO by developing an effective chemical healing method that forms intramolecular aryl–aryl bonds. Since graphenes and graphene nanoribbons have been successfully synthesized from non-planar oligophenylene and polyphenylene precursors, cyclodehydrogenation using FeCl3 is currently focused on as a versatile method to produce planarization and form polycyclic structures via intramolecular cross-dehydrogenative coupling (ICDC) [19–22]. In this report, we adapt the ICDC reaction using a FeCl3 catalyst to increase the electrical conductivity of RGO by means of healing the defect sites. Scheme 1 shows the basic concept of the chemical healing of RGO with FeCl3 to produce healed RGO. We have abbreviated the healed RGO after the ICDC reaction as H-RGO. It should be mentioned that FeCl3 has been used as a catalyst for oxidative cationic polymerization of benzene to poly(p-phenylene) [23]. The ICDC reaction using FeCl3 is similar to the synthesis of poly(p-phenylene). The reaction sequence of ICDC is shown in scheme 1. The ICDC reaction is initiated by the formation of a benzonium ion which then undergoes oxidative coupling induced by the FeCl3.
2. Methods
GO was prepared using a modified Hummers method [24]. RGO was then obtained by reducing the GO with hydrazine [25]. The detailed experimental procedures for GO and RGO are described in the supplementary information section (available at stacks.iop.org/Nano/24/185604/mmedia). H-RGO was prepared from the RGO as follows. RGO (0.2 g) was dispersed in dichloromethane (100 ml); the mixture was then purged with nitrogen gas for 30 min. A solution of 5 equivalents of FeCl3 in nitromethane was added dropwise to the reaction mixture at room temperature in a nitrogen atmosphere over 2 h. The flask was sealed and the reaction was stirred at room temperature for 24, 48, or 72 h before being stopped by the addition of methanol (100 ml). The product was isolated by filtration, washed with methanol, and dried in a vacuum oven. Details of the characterization methods are described in the supplementary information (available at stacks.iop.org/Nano/24/185604/mmedia). The electrical conductivity of the RGO and H-RGO was determined by a four-point probe method by using pressed pellets. For consistent thickness of the pellets, 0.05 g of RGO or H-RGO was compressed under a constant pressure of 8000 psi and the sample thickness was maintained at about 100 μm. The thickness of the pellet was measured using a micrometer.
3. Results and discussion
To confirm the generation of carbon bonds in the RGO due to the ICDC using a FeCl3 catalyst, Raman and x-ray photoelectron spectroscopy (XPS) were performed. The obtained Raman spectra are shown in figure 1. Raman spectroscopy plays a significant role in the structural characterization of graphite materials [26]. The Raman spectra of graphite and other carbon materials can provide significant information regarding the carbon materials such as the phonon structure, electronic structure, and defect structure. The spectra of highly ordered graphite only feature a couple of Raman active bands: the in-phase vibration of the graphite lattice (G-band) at 1575 cm−1 and the disorder band caused by the graphite edges (D-band) at approximately 1355 cm−1. The G-band originates from in-plane vibrations of sp2-carbon atoms and is a doubly degenerate phonon mode (E2g symmetry) at the Brillouin zone center [27] while the D-band arises from the defective carbon structure [28, 29]. Therefore, the intensity ratio of the G-band to the D-band (i.e., IG/ID) reflects the relative amount of sp2-hybridized carbon atoms on the surface of the graphene [30, 31]. Therefore, changes in the relative amount of sp2-hybridized carbon atoms in the sample can be estimated by determining the IG/ID ratio. Figure 1(a) shows the change in the Raman spectra of the RGO and H-RGO with increasing healing time. The corresponding calculated IG/ID ratios, which are shown in figure 1(b), significantly increase with healing time. Specifically, the IG/ID ratio of the RGO of 0.77 increased to 1.64 after chemical healing. It is thought that the IG/ID ratio of the H-RGO increased due to the restoration of the carbon network during the aryl–aryl cross-coupling reaction using FeCl3. The Raman spectra also reveal that the full-width at half maximum (FWHM) decreased with increasing healing time. Table 1 shows the calculated FWHM values for the RGO and H-RGO with healing times between 24 and 72 h, and reveals that the FWHM of H-RGO decreases with increasing healing time. Currently, the crystallinity of carbon materials is usually evaluated from the FWHM of the Raman peak: a smaller FWHM value implies better crystallinity [22]. According to the IG/ID ratios and FWHM values, it is confirmed that the sp2-hybridized carbon structure and crystallinity of the RGO were improved after the ICDC reaction.
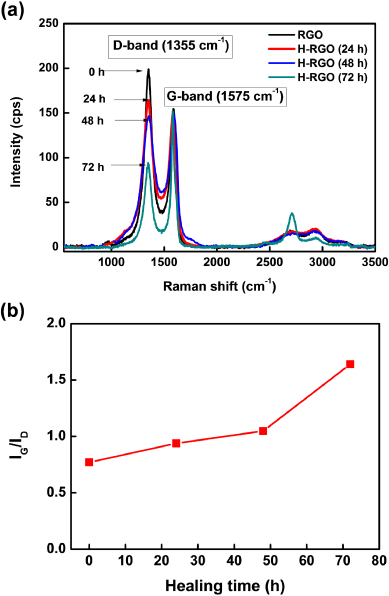
Figure 1. (a) Raman spectra of the RGO and H-RGO with different healing times, and (b) changes in the IG/ID ratio of H-RGO as a function of the healing time.
Download figure:
Standard imageTable 1. Change of the FWHM values in the Raman spectra of the H-RGO with increasing healing time.
| Sample | Healing time (h) | FWHM (cm−1) | |
|---|---|---|---|
| D-band | G-band | ||
| RGO | — | 138.6 | 108.9 |
| H-RGO | 24 | 125.2 | 91.4 |
| 48 | 104.8 | 90.5 | |
| 72 | 83.2 | 43 | |
Figures 2(a) and (b) show the deconvoluted XPS C 1s spectra of the RGO and H-RGO, respectively. To identify changes in the surface chemistry, the deconvoluted XPS C 1s spectra were fitted to a Gaussian–Lorentzian peak shape after performing a Shirley background correction. The deconvoluted XPS C 1s spectra of the RGO and H-RGO (after 72 h of healing) showed five characteristics peaks at 284.5, 385.6, 286.7, 287.8, and 288.8 eV that correspond to sp2-hybridized carbon [32], sp3-hybridized carbon [31], C–O, C=O, and COO moieties, respectively [33, 34]. The measured areas of the peaks corresponding to each chemical bond are listed in table 2. After healing, the intensity of the sp3-hybridized carbon peak (AC−C) decreased and the peak area of the sp2-hybridized carbon (AC=C) peak increased. Consequently, the AC=C/AC−C ratio of the H-RGO (after 72 h of healing) increased from 2.88 to 3.79. It should be noted that the ICDC reaction with FeCl3 creates intramolecular aryl–aryl bonds on the H-RGO. As a result, it is considered that the amount of sp2-hybridized carbon on the H-RGO is increased relative to the as-prepared RGO.
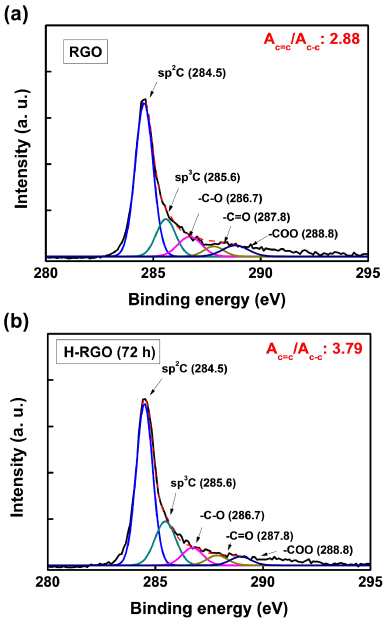
Figure 2. Deconvoluted XPS spectra of the C 1s of (a) the RGO and (b) the H-RGO.
Download figure:
Standard imageTable 2. Calculated peak area for each chemical bond from the XPS C 1s spectra of the RGO and H-RGO.
| Sample | Peak area of each chemical bond | ||||
|---|---|---|---|---|---|
| sp2 C | sp3 C | C–O | C=O | COO | |
| RGO | 6620 | 2298 | 919 | 517 | 459 |
| H-RGO | 6898 | 1820 | 1189 | 510 | 726 |
The effect of the ICDC on the crystallinity was investigated via an electron diffraction study using transmission electron microscopy (TEM). To prepare the samples for TEM, the RGO was suspended in ethanol and placed on Cu-TEM grids. To avoid electron radiation damage during TEM, the electron-exposure time was minimized. The selected area diffraction (SAD) patterns taken from the RGO and H-RGO showed the  type of reflection (figure 3). However, on comparing the relative intensity of the
  between the RGO and the H-RGO in figures 3(a) and (b), the H-RGO exhibited a more intense peak [35]. The sharp spots in figure 3(a) reveal the presence of a graphene sheet with hexagonal symmetry spots, which is typical for graphene. Similar multiple-hexagonal patterns are commonly caused by multiple graphene sheets. From these observations, it is easy to distinguish crystalline H-RGO and RGO. It should be mentioned that to compare the degree of healing in the defect structure, the d-spacing of the RGO and H-RGO was investigated using x-ray diffraction (XRD, D/Max 2500 V/PC, Rigaku, Japan). The XRD profile of the RGO exhibited an intense peak at 2θ = 18°, corresponding to a d-spacing of 0.49 nm. The XRD profile of the H-RGO was slightly shifted to a higher 2θ angle of around 19.3° (d-spacing: 0.46 nm). This result indicated that there was slight improvement in crystallinity closer to ordered graphitic structure. However, the intensities of the XRD profiles did not show significant differences between the RGO and the H-RGO in sharpness either (see supporting information figure S1 available at stacks.iop.org/Nano/24/185604/mmedia).
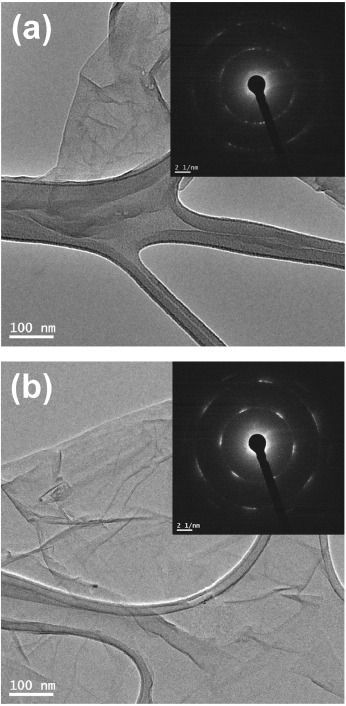
Figure 3. TEM and SAD (inset) images of (a) the RGO and (b) the H-RGO.
Download figure:
Standard imageWe used the N2 adsorption technique at 77 K to confirm the change of specific surface area (SSA) of the RGO and H-RGO. The N2 adsorption isotherm of the RGO is typical type II according to the IUPAC classification. After the ICDC reaction, the N2 adsorption amount of the H-RGO drastically decreased, as shown in figure S2 (available at stacks.iop.org/Nano/24/185604/mmedia). In order to elucidate the quantitative reduction in the SSA of the RGO and H-RGO, we calculated the SSA by the BET method for N2 adsorption isotherms. The RGO and H-RGO had SSA values of 310 and 17 m2 g−1, respectively. From the results of XRD of the RGO and H-RGO (see figure S1 available at stacks.iop.org/Nano/24/185604/mmedia), the interlayer d-spacing of the RGO was narrowed by the ICDC reaction. Thus, the SSA of the H-RGO was drastically decreased compared with that of the RGO.
The thermal stability of the RGO and H-RGO was investigated by thermogravimetric analysis (TGA). TGA was performed on a TGA Q50 (TA instrument, USA) at a heating rate of 5 °C min−1 in an air atmosphere. The RGO showed a rapid weight loss with a decomposition temperature of 480 °C. However, the decomposition temperature of the H-RGO was shown to be 550 °C. It might be that the enhanced thermal stability of the H-RGO can be attributed to the restoration of the carbon network during the aryl–aryl cross-coupling reaction using FeCl3.
We also measured the electrical conductivities of the RGO and H-RGO. Although the C/O atomic concentrations of the RGO and H-RGO (after 72 h of healing) did not change dramatically (table 3), the electrical conductivity of the H-RGO increased with increasing healing time (figure 5). This is rationalized by the restoration of the π-conjugated system of the RGO. That is, the electrical conductivity of graphene is critically dependent on the π-conjugation of the graphene lattice. By virtue of the healing process using FeCl3, the defective sites of the RGO were successfully restored by the ICDC. As a result, the π-conjugated structure of the H-RGO was expanded beyond that of the RGO. Eventually, the electrical conductivity of the H-RGO reached 71 S cm−1, which was ∼14 times larger than that of the RGO (5 S cm−1). For further analysis, we fabricated two terminal devices on pellet type samples by varying the channel length (15 μm) between the source and drain electrodes. From the current–voltage characteristics, we identified that the resistance value of the H-RGO (∼4 Ω) was lower than that of the RGO (∼9 Ω) by calculating the slope of each I–V curve, as shown in the inset of figure 4. This result is in good agreement with the electrical conductivity test, indicating that this enhanced electrical property of the H-RGO comes from the healing process using FeCl3.
Table 3. Atomic concentrations of C, O, and Fe in the RGO and H-RGO.
| Sample | Atomic concentration (%) | ||
|---|---|---|---|
| C | O | Fe | |
| GO | 74.12 | 25.35 | 0 |
| H-GO | 66.28 | 32.82 | 0.36 |
| R-GO | 83.96 | 12.75 | 0 |
| H-RGO | 85.66 | 11.76 | 0.001 |
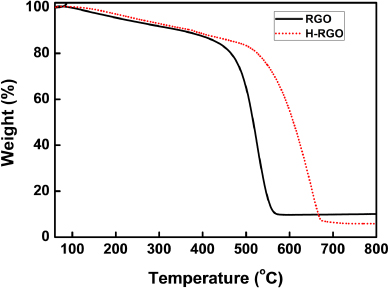
Figure 4. TGA thermograms of the RGO and H-RGO.
Download figure:
Standard image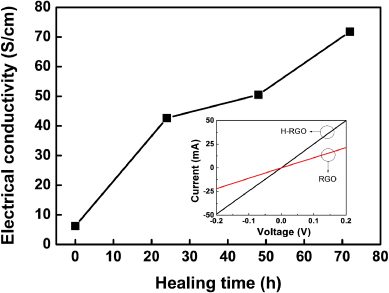
Figure 5. Change in the electrical conductivity of the RGO and H-RGO with healing time. The inset shows the I–V characteristics of both the H-RGO and the RGO. The channel length between the source and drain electrodes was 15 μm.
Download figure:
Standard imageHowever, one question remains: it is possible that the FeCl3 acts as a reducing agent rather than healing the defects in the RGO. To investigate the role of FeCl3 as a reducing agent, GO was treated with FeCl3 for 72 h to form healed GO (H-GO) via a procedure analogous to that to generate H-RGO. Figures 6(a) and (b) show the Raman and XPS spectra of the GO and H-GO, respectively. The atomic concentrations listed in table 3, which were calculated from XPS, show increased oxygen content of the H-GO compared to that of the GO. Furthermore, the Raman spectra of the GO and H-GO indicate that the IG/ID ratio does not change after the healing process (figure 6(a)), which provides direct evidence that the FeCl3 does not lead to reduction of the RGO. In addition, the electrical conductivities of the GO and H-GO (after 72 h of healing) are 4.5 × 10⁻⁵ and 2.4 × 10⁻⁵ S cm−1, respectively. From the XPS results and the electrical conductivity of the H-GO, we confirmed that FeCl3 does not act as a reducing agent.
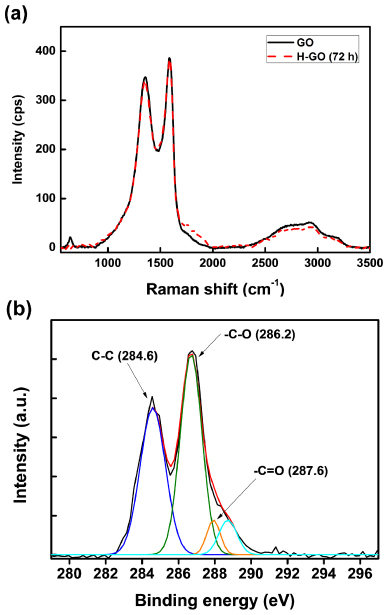
Figure 6. (a) Raman spectra of the GO and H-GO (after 72 h of healing) and (b) XPS C 1s fitting curves of the H-GO (after 72 h of healing).
Download figure:
Standard image4. Conclusion
In this study, an effective method for healing the defects of RGO using an ICDC reaction was investigated. This approach resulted in a significant increase in the IG/ID ratio with increasing healing time. In addition, the AC=C/AC−C ratio of the H-RGO (after 72 h of healing) also increased relative to that of the RGO. Consequently, the healing of the RGO with FeCl3 led to a further increase of the electrical conductivity to 71 S cm−1, which is ∼14 times that of as-prepared RGO; this increase was due to restoration of the sp2-hybridized carbon structure on the surface of the RGO. The intramolecular cross-dehydrogenative coupling reaction was carried out at room temperature. Furthermore, by virtue of restoration of aryl–aryl bonds, the FeCl3 treated H-RGO showed a better thermal stability than RGO. Consequently, our method provides a simple but effective defect healing method for graphene at room temperature. This healing method provides a potential method for large-scale and low-cost graphene production.
Acknowledgments
This work was supported by a grant from the Korea Institute of Science and Technology (KIST) Institutional Program and the Fundamental R&D Program for Core Technology of Materials funded by the Ministry of Knowledge Economy, Republic of Korea.