
Abstract
The decomposition of a nanoconfined mixture of lithium–magnesium borohydride, Li11BD4–Mg(11BD4)2, has been investigated and compared to the corresponding mixture in the bulk form. The systems were investigated by thermal analysis, small-angle neutron scattering, 11B nuclear magnetic resonance and transmission electron microscopy. The dehydrogenation temperatures decreased by up to 60 °C in the nanoconfined system, with gas evolution following different steps, compared to the behaviour of the bulk material under the same conditions. Most importantly, desorption from the nanoconfined hydride proceeds without formation of diborane, B2D6, which evolves from the bulk mixture. From small-angle neutron scattering, differences in morphology between the bulk and the nanoconfined systems are also demonstrated. Evidence of a complete decomposition has been found in the nanoconfined system, after heating up to 460 °C. Furthermore, 11B NMR data show that nanoconfinement inhibits the formation of dodecaborane, [B12D12]2−, during decomposition, a result which is important for practical applications of borohydrides.
Export citation and abstract BibTeX RIS
1. Introduction
Light element and complex anion hydrides, for example MgH2, MAlH4 (M = Li, Na, K) and especially light metal borohydrides such as Mg(BH4)2 and LiBH4, are attractive storage materials for vehicular applications because of their high gravimetric and volumetric hydrogen capacities. Unfortunately, practical utilization of these compounds for hydrogen storage applications is challenging because of their slow kinetics and high thermodynamic stability, with equilibrium pressures lower than 1 bar at 75 °C. To address these issues additives, mixed cation and anion hydrides and multiple phase hydride systems have been studied. Although these approaches have led to improved kinetics and many new storage materials, so far none of these materials satisfactorily meets the thermodynamic requirements imposed by proton exchange membrane (PEM) fuel cells (equilibrium pressures of 3–10 bar H2 at 75 °C). Furthermore, borohydrides give a concurrent evolution of toxic diborane (B2H6) during desorption, with a consequent decreased lifetime of the PEM.
Nanoconfinement of hydrides has lately been proposed as a promising approach to increase reaction rates and change equilibrium hydrogen pressures of hydrides [1, 2]. When hydrides are confined to dimensions less than 25 nm, decreases in dehydrogenation temperatures by up to 100 °C and increases of isothermal dehydrogenation rates by more than 50 times have been found[3–10]. Although these improvements are encouraging, they are still not sufficient for applications. For confinement to very small dimensions, less than 2–3 nm, changes in the equilibrium hydrogen pressure appear to occur. These changes can be linked to different reaction pathways as found for NaAlH4 [6, 11]. However, it can lead to the formation of undesirable products, such as Li2B12H12 in the case of nanoconfined LiBH4 [9] or increased production of ammonia from confined Li3BN2H8 [12].
Significant reductions in desorption temperatures were observed also with the nanoconfinement of multiple phases, such as LiBH4/MgH2 [13]. However, in this case it is not clear how the reaction pathway is influenced by the confinement of the combined hydride. Recently, a physical mixture of metal borohydrides, LiBH4–Mg(BH4)2, has been proposed as a hydrogen storage material [14]. The 1:1 mixture exhibited a eutectic melting at 180 °C and a decomposition temperature much lower than that of the pure borohydrides.
In the present work we investigated the effect of nanoconfinement on the desorption and morphological behaviour of this borohydride mixture, in the form of the double-labelled variant Li11BD4–Mg(11BD4)2, where hydrogen has been substituted by deuterium and natural boron by 11B in order to optimize the neutron scattering studies on this material [15].
2. Experimental details
The eutectic mixture of Li11BD4–Mg(11BD4)2 was synthesized with the isotopically enriched compounds using the same method as described elsewhere [14]. The nanocomposite sample was prepared by melt infiltration of a 1:1 (molar ratio) composition of Li11BD4–Mg(11BD4)2 into a carbon scaffold (IRH33, pore volume PV = 1.17 cm3 g−1, specific surface area of 2587 m2 g−1 and pore width from 0.5 to 4.5 nm, provided by the Institut de recherche sur l'hydrogène, Université du Quebec à Trois Rivières, Canada). Specifically, 65 mg of Li11BD4–Mg(11BD4)2 and 140 mg of IRH33 carbon material were mixed with mortar and pestle, then heated in an autoclave-type reactor at 190 °C under 40 bar D2 for 1 h. The infiltrated Li11BD4–Mg(11BD4)2/IRH33 composite does not show any diffraction peaks, which indicates that the material has been filled into the carbon pores and the particles are too small to be detected by powder x-ray diffraction (PXD). If we consider that all the hydride has been successfully infiltrated, the amount of Li11BD4–Mg(11BD4)2 in the composite is about 32%, calculated from the amount of borohydride added to the carbon scaffold. In order to obtain insight into the influence of nanoconfinement on the properties of the material, the bulk powder has also been treated under the same conditions as for melting infiltration, (namely, heating up to 190 °C under 40 bar of D2 for 1 h) before performing any other measurements.
Small-angle neutron scattering (SANS) experiments were carried out at the JEEP II reactor at IFE, Kjeller, Norway and performed on both the bulk Li11BD4–Mg(11BD4)2 and the Li11BD4–Mg(11BD4)2/IRH33 composite before and after ex situ heat treatment under vacuum up to 460 °C. The q range employed in the experiments was 0.008–0.25 Å−1. The samples were filled in 1 mm Hellma quartz cuvettes under argon atmosphere. For all samples it was ensured that the transmission was sufficiently high (>90%) to disregard multiple scattering. Standard reductions of the scattering data including transmission corrections were conducted by incorporating data collected from an empty cell, a beam without cell and blocked-beam background. The data were transformed to an absolute scale (coherent differential cross section (dΣ/dΩ)) by calculating the normalized scattered intensity from direct beam measurements [16].
Temperature-programmed desorption (TPD) was performed under dynamic vacuum up to 460 °C using an in-house-built set-up. A 5 °C min−1 heating rate and approximately 65 mg of sample were used for the measurement. Identification of the chemical species contained in the gas released during desorption was carried out by a mass spectrometer (MS), MKS Microvision-IP Rest Gas Analyzer, directly coupled to the TPD for analysis of the evolved gas.
Transmission electron microscopy (TEM) was performed with a JEOL JEM2010F microscope equipped with a Gatan Image Filter (GIF 200) and operated at 197 kV. Because of the high instability of hydrides, such as alanates and borohydrides, under the electron beam, only the desorbed nanocomposite up to 460 °C has been measured. Furthermore, as operating at this voltage will result in knock-on damage by the electron beam, for instance for boron [17], micrographs were obtained quickly in order to minimize damage to the specimen. The samples are highly sensitive to oxygen and water; hence a glove bag filled with argon was used for specimen preparation and transfer into the TEM column. The powdered sample was dispersed onto a 300-mesh 3 mm holey carbon grid (Agar) which was then mounted on the TEM sample holder. Finally, the glove bag was attached to the TEM goniometer so that the sample holder could be inserted into the TEM column. Electron energy loss spectroscopy (EELS) was done with the spectrometer (GIF) in image-coupled mode, a dispersion of 0.2 eV per channel and an energy spread of ΔE = 1.6 eV (i.e. FWHM of the zero loss peak). Spectra were averaged from a circular area (d ≈ 440 nm), as determined by the effective radius of the selected-area aperture.
11B NMR data were collected on a Bruker Advance III 500 MHz spectrometer operating at a frequency of 160.455 MHz. The spectra were obtained using a 4.0 mm MAS probe spinning at a rate of 10 kHz and 2.0 μs pulses at a 125 kHz RF field with a recycle delay of 5 s. The chemical shifts of 11B were externally referenced to NaBH4 at − 41.5 ppm.
Simultaneous thermogravimetric analysis and differential scanning calorimetry (TGA–DSC) were conducted with a Setaram thermal analyzer Sensys Evo equipped with a Pfeiffer Omnistar mass spectrometer for analysis of the evolved gas. The measurements were performed under a gas flow of 20 ml He min−1 and a heating rate of 5 °C min−1 using open alumina crucibles.
3. Results and discussion
Hydrogen desorption of the nanoconfined Li11BD4–Mg(11BD4)2/IRH33 composite was studied by temperature-programmed desorption under dynamic vacuum coupled with mass spectrometry (TPD-MS). A comparison between the results obtained on the nanoconfined system and the bulk binary Li11BD4–Mg(11BD4)2 under the same conditions is shown in figure 1.
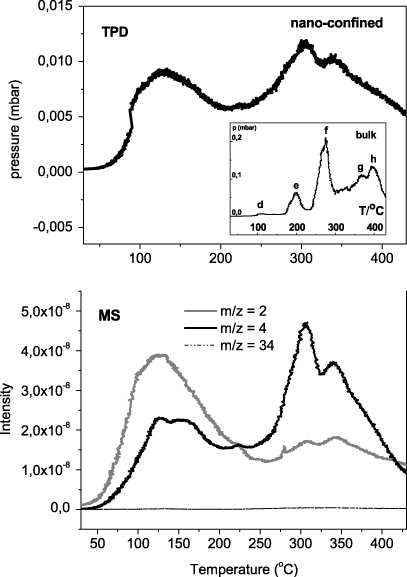
Figure 1. TPD-MS under vacuum from RT to 460 °C (heating rate 5 °C min−1) of the nanocomposite Li11BD4–Mg(11BD4)2/IRH33. In the inset: TPD at the same conditions of the bulk Li11BD4–Mg(11BD4)2. The MS signal of deuterium (m/z = 2,4) and mass fragments of diborane (m/z = 34) are shown at the bottom.
Download figure:
Standard imageAccording to the TPD data, the nanoconfined Li11BD4–Mg(11BD4)2 exhibits three desorption events at 125, 305 and 340 °C, respectively, associated with evolution of D2 (m/z = 2 and 4). The corresponding TPD curve for the bulk Li11BD4–Mg(11BD4)2 (inset of figure 1) shows four distinct peaks labelled as e, f, g and h (and one minor peak, d). The simultaneous MS measurement (not included here) reveals that these events are mainly due to D2 evolution. Based on the eutectic temperature of the bulk powder around 180 °C [14], this indicates that the melting of bulk powder is accompanied by partial decomposition/gas evolution. In agreement with previous results[14], the peak at around 200 °C (e in the inset) is associated with the simultaneous release of both diborane (11B2D6, m/z = 34) and D2. The main deuterium desorption occurs in the temperature range of 250–400 °C (peaks f, g and h in the inset). The minor release at around 100–120 °C (d) could be related to a small decomposition during the orthorhombic to hexagonal transformation of Li11BD4, appearing around this temperature, analogous to the effect found in the case of Mg(BH4)2 [18].
No diborane is detected in the decomposition of the nanoconfined composite (MS spectra of figure 1). From the TPD data it is evident that the decomposition temperature is reduced by about 60 °C when the hydride mixture is nanoconfined in the carbon scaffold. The event at around 125 °C appears larger in the nanoconfined system, but it is noteworthy that the amount of released gas, as from the TPD experiment, is much lower than for the bulk material. This can partly be explained by the reduced total capacity of the nanoconfined system due to the dead weight from the carbon scaffold. In addition, the decomposition could follow different decomposition pathways as compared to the bulk. As for the infiltrated starting material, PXD data collected on the nanoconfined desorbed sample showed only the amorphous pattern characteristic of the carbon scaffold, and could not be used to verify the degree of decomposition of the nanoconfined system.
At the moment it is not possible to explain the shift at lower temperatures as resulting from a change in the decomposition pathway.
Simultaneous thermogravimetric analysis and differential scanning calorimetry (TGA–DSC) were performed on the nanoconfined Li11BD4–Mg(11BD4)2, see figure 2. As opposed to the three decomposition step release from the bulk[14], the data for the nanocomposite show that the weight loss proceeds in only one clear step starting at 200 °C. The accompanied DSC trace shows two endothermic peaks for deuterium desorption at around 270 and 340 °C (a, b in figure 2). A simultaneous mass spectroscopy analysis (not shown here) reveals only evolution of deuterium gas at the corresponding temperatures. This is in agreement with the corresponding findings determined with TPD. The TGA–DSC measurements were repeated on several different batches obtaining an amount of deuterium released spanning from 3 to 4.5 wt%, depending on the batch, with the main release occurring between 200 and 400 °C.
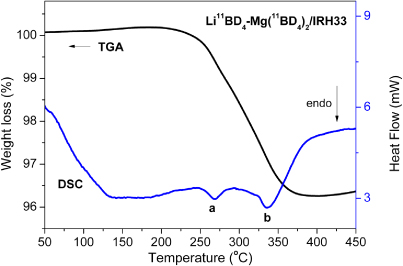
Figure 2. TGA–DSC of the decomposition of the nanocomposite Li11BD4–Mg(11BD4)2/IRH33 ((a) at ∼270 °C and (b) ∼340 °C).
Download figure:
Standard imageTo compare our experimental data with the expected theoretical gas release for the system, the retained gravimetric capacity for the nanoconfined system can be calculated according to the equation proposed by Vajo et al [19]:

where the mass of the scaffold relative to the bulk capacity (CG,scaffold/CG,bulk) depends on the hydride density (ρhydride (g cm−3)) and the specific pore volume of the scaffold (PV (cm3 g−1)). The 1:1 molar ratio of LiBH4–Mg(BH4)2, or in our case LiBD4–Mg(BD4)2 which gives similar results, has a density of 0.75 g cm−3 based on the theoretical densities of LiBH4 and Mg(BH4)2 (i.e. 0.67 and 0.79 g cm−3, respectively). Figure 3 shows the calculated retained gravimetric capacity versus scaffold pore volume for the hydrides LiBH4 and Mg(BH4)2 and the LiBH4–Mg(BH4)2 mixed system.
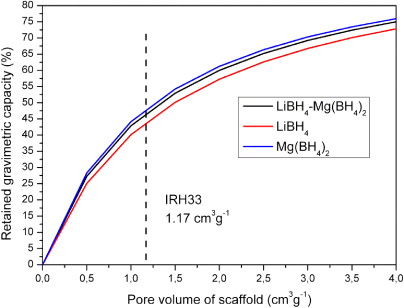
Figure 3. Retained gravimetric capacity for LiBH4 and Mg(BH4)2 and the LiBH4–Mg(BH4)2 mixture versus scaffold pore volume.
Download figure:
Standard imageThe resulting retained gravimetric capacity for the infiltrated mixed system is 46%, based on the pore volume of IRH33 (1.17 cm3 g−1). With a total capacity of 14.6 wt% hydrogen in the bulk mixture[14], the theoretical maximum amount of H2 in the system is 46% of 14.6 wt% = 6.7 wt%. This value is higher than the maximum measured 4.5 wt% mass release from our samples. Therefore we can expect that in our experiment either the decomposition of the nanoconfined hydride is only partial or the starting bulk Li11BD4–Mg(11BD4)2 partially decomposed during the preparation or infiltration. Evidence of a partial decomposition after infiltration has been confirmed by 11B NMR and will be discussed later in this paper.
To study the particle size, effective infiltration and morphological variation of the hydride particles, we performed SANS before and after desorption (figure 4). While the bulk Li11BD4–Mg(11BD4)2 shows large changes, the nanoconfined material does not display significant changes. This is confirmed by the indirect Fourier transform performed on the SANS data for the Li11BD4–Mg(11BD4)2/IRH33 composite before and after heat treatment (figure 5). This behaviour has been displayed by similar infiltrated samples measured previously by SANS and SAXS [20]. Once infiltrated, the hydrides possess small size domains which are retained during the decomposition, while there is a large variation in the particle size for the bulk under the same conditions. This is likely to ensure an increased interfacial contact between the product phases in the nanocomposite, which could facilitate desorption.
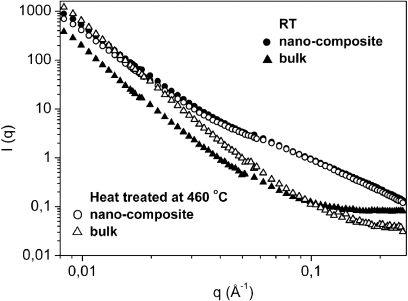
Figure 4. SANS performed on the bulk Li11BD4–Mg(11BD4)2 and the nanocomposite Li11BD4–Mg(11BD4)2/IRH33 before (full dots) and after heat treatment under vacuum (open dots) up to 460 °C.
Download figure:
Standard image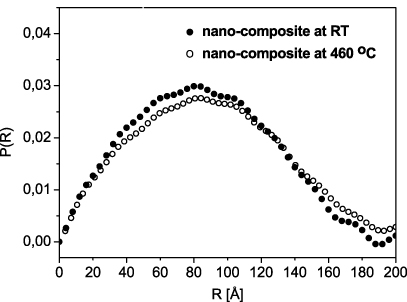
Figure 5. Size distribution calculated with indirect Fourier transform from SANS performed on the nanocomposite Li11BD4–Mg(11BD4)2/IRH33 before (full dots) and after (open dots) heat treatment.
Download figure:
Standard imageFigure 6 shows fits to the SANS patterns using the Beaucage global scattering model [21, 22] for the scaffold (a) and the nanocomposite Li11BD4–Mg(11BD4)2/IRH33 before (b) and after (c) heat treatment.
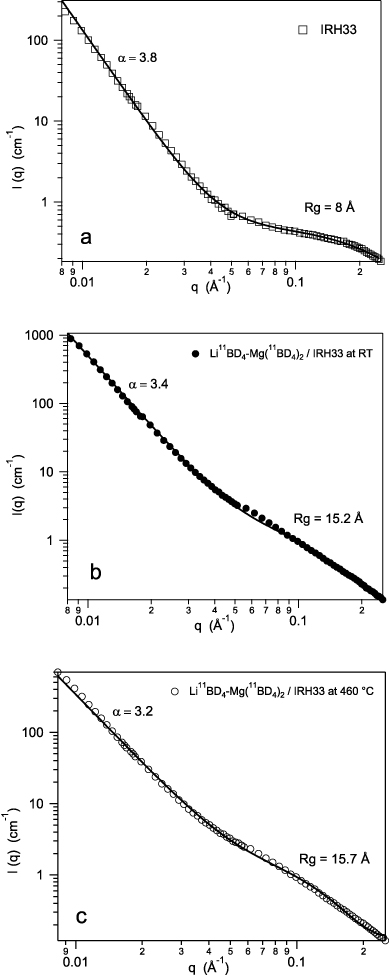
Figure 6. Beaucage fits from SANS for the scaffold (a) and the nanocomposite Li11BD4–Mg(11BD4)2/IRH33 before (b) and after (c) heat treatment.
Download figure:
Standard imageThe scaffold alone (figure 6(a)) maintains the same characteristics before and after heating. Therefore only the Beaucage fit before heat treatment is presented. The scaffold is characterized by a wide range of pore sizes from 5 to 45 Å, with an average size of 8 Å in the lowest size range (figure 6(a)). The pores in this system display near-smooth surfaces (power law exponent α = 3.8). In general, the particle surface is characterized by 3 < α < 4, from a rough to a fully smooth surface, respectively. After infiltration, the Li11BD4–Mg(11BD4)2/IRH33 composite shows a rougher surface (α = 3.4). The particle size (Rg) of 15 ( ± 0.5) Å, slightly larger than the scaffold pore size at these length scales, seems to confirm the apparent expansion of the scaffold after infiltration, as found in similar systems [20]. This change in the Rg value could also be due to some hydride particles on the surface of the carbon scaffold, but it is difficult to distinguish between these possible explanations. After heat treatment (figure 6(c)), the Li11BD4–Mg(11BD4)2/IRH33 composite shows a surface which is rougher (α = 3.2), but the particle size seems to remain nearly constant with a comparable Rg. The mass fractal values, as extracted from the log–log plots at high q, indicate the space filling behaviour of the particles, with 1 < α < 3 from a less dense to a compact distribution, respectively. Our system becomes slightly more compact after heat treatment (α was found to be 2.0 before heat treatment and 2.2 after). This could account for the very small variation detected in the amount of larger particles after heat treatment, as shown in figure 5.
TEM was performed on the decomposed Li11BD4–Mg(11BD4)2/IRH33 composite (heated under vacuum, at 460 °C). Figure 7(a) shows a high resolution TEM micrograph exhibiting curled, disordered 002 lattice fringes of the activated carbon 'scaffolding'. This feature is typical for the sample.
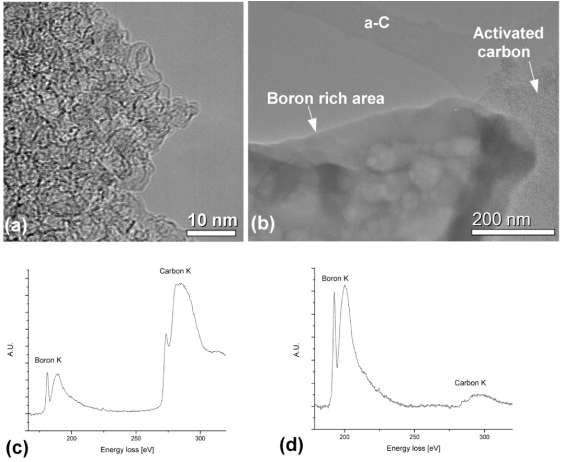
Figure 7. (a) A TEM micrograph of the activated carbon and (b) a micrograph showing a boron-rich particle, as well as the activated carbon and the amorphous carbon film support. (c) EELS from an area containing (a). (d) EELS from the boron-rich area in (b).
Download figure:
Standard imageEELS data identified C, B (figure 7(c)), O and Mg (not shown here) by their K-absorption edges. Lithium could not be positively identified by EELS. This is due to the partial overlap of the Li-K edge (55 eV) with the Mg-L2,3 edge (51 eV) [23], in combination with a low spectral intensity and smearing of spectral features by the energy resolution of the instrument (ΔE = 1.6 eV). Additionally lithium, as the lightest solid element, is prone to knock-on damage by the electron beam [24], which adds to the difficulty of detection by TEM–EELS. Direct detection of D by its absorption edge was not possible, since any distinct hydrogen absorption edge disappears when hydrogen is chemically bound to other atoms [25]. The presence of oxygen in the sample (such as MgO) could be explained by a small amount of oxide species in the starting materials, as well as inadvertent exposure to oxygen during sample handling. Specific nanoparticles could not be observed within high resolution micrographs of the activated carbon (figure 7(a)). However, EELS confirms the presence of Mg, B and C. Thus we attribute that lack of observable nanoparticles to blurring by the high effective thickness of the sample. Figure 7(b) shows an area of the sample with quite different morphology from the activated carbon. The amorphous carbon support film is seen in the top right part of the micrograph. EELS data showed that the morphologically different area also contained C, B (figure 7(d)), O and Mg (not shown here). However, the amount of boron relative to the amount of carbon (figure 7(d)) was much higher than for the activated carbon area (figures 7(a) and (c)).
The TEM–EELS results confirm the presence of boron in the sample. Although EELS results show that boron is unevenly distributed within the sample, they could not directly identify the exact nature of the boron species.
We therefore performed 11B NMR on the nanocomposite Li11BD4–Mg(11BD4)2/IRH33 before and after heat treatment under vacuum up to 460 °C. The results are shown in figure 8.
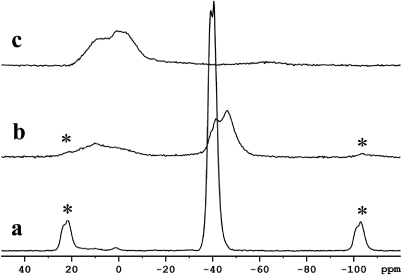
Figure 8. 11B NMR spectra for (a) bulk Li11BD4–Mg(11BD4)2, (b) nanocomposite Li11BD4–Mg(11BD4)2/IRH33 before heat treatment and (c) nanocomposite Li11BD4–Mg(11BD4)2/IRH33 after heat treatment under vacuum up to 460 °C. (*) indicates spinning side bands.
Download figure:
Standard imageIn the nanocomposite material before desorption (figure 8(b)) the signals at − 41.4 and − 46.2 ppm belong most likely to Li11BD4–Mg(11BD4)2, as compared to the 11B NMR shift values of − 39.2 and − 40.5 for Li11BD4–Mg(11BD4) prior to infiltration (figure 8(a)). The slight shift and broadening of the signals are probably due to the different chemical environments induced upon confinement into the carbon scaffold. It is interesting to note already in this sample traces of decomposition product, most likely amorphous B (broad peak centred at 11.8 ppm). This would occur if a portion of the hydrides decomposed already during the melting infiltration. After desorption (figure 8(c)), only the signal from the amorphous B is present, as a broad signal centred at about 5 ppm. 7Li NMR performed on the decomposed material (not shown here) supported the formation of LiD but shifts due to the nanoconfinement prevented a conclusive assignment of the peaks. The 11B NMR spectra do not show the presence of MgB2, nor that of [B12D12]2− dodecahedra, which have been reported to appear at 100 ppm and − 12 ppm in MAS 11B NMR spectra, respectively [26, 27]. The confinement of the borohydrides in the nanopores probably prevents the formation of these relatively large boron icosahedra[28]. This can be an advantage because the thermodynamically stable [B12D12]2− species have been shown to limit the regeneration of borohydrides [29].
These results are in agreement with the TG measurements and explain the lower amount of deuterium desorbed from the nanoconfined system as compared to the theoretical one. The presence of elemental boron already after infiltration also accounts for a total lower capacity.
4. Conclusions
In this work we report that nanoconfinement modified the decomposition of a mixture of lithium and magnesium borohydrides, Li11BD4–Mg(11BD4)2, compared to the decomposition of a corresponding mixture in the bulk form. When the hydride mixture is infiltrated into carbon scaffolds with pore sizes as small as approx. 1 nm, dehydrogenation temperatures have been found to decrease by up to 60 °C. The desorption reaction of the nanoconfined system appears to proceed in three steps, as opposed to the five steps shown under the same conditions by the bulk Li11BD4–Mg(11BD4)2. From SANS differences in morphology between the bulk and the nanoconfined systems were also evident, and the stability of the confined nanostructure upon heat treatment was demonstrated. Most importantly, desorption for the nanoconfined hydride proceeds without releasing diborane, B2D6, which occurs in the bulk mixture. 11B NMR performed on the nanoconfined systems after heating up to 460 °C showed the decomposition of nanoconfined Li11BD4–Mg(11BD4)2 towards what appears to be only amorphous boron; the undesirable products Li211B12D12 and Mg11B12D12 are also not observed. From a practical perspective the lack of release of diborane is certainly positive in combination with a PEM fuel cell system. However, the nanoconfinement of the borohydride mixture considered in this work requires further investigations in terms of improving the reaction kinetics and reversibility.
Acknowledgments
Funding under the EU project NANOHy ('Novel Nanocomposites for Hydrogen Storage Applications', contract no. 210092) is gratefully acknowledged. Aud M Bougza (SINTEF) is gratefully acknowledged for NMR data collection and Dr Bjørnar Arstad (SINTEF) for helpful discussions.