

Abstract
We present a novel non-scanning multidirectional spectroradiometer (MUDIS) measuring the spectral sky radiance as a function of zenith and azimuth angle with a high spectral and temporal resolution. The instrument is based on a hyperspectral imager and measures spectral sky radiance in the wavelength range of 250–600 nm at 113 different directions simultaneously. MUDIS has been intercalibrated with a sky scanning CCD spectroradiometer (SCCD). Sky radiance measurements have been performed with both instruments under cloudless and overcast sky. The spectral actinic irradiance derived from those measurements agrees within 8% for wavelengths higher than 320 nm. The bias between synchronous MUDIS and SCCD sky radiance measurements during cloudless and overcast sky is below 5% for 320 and 500 nm with a 1σ standard deviation of less than 10%. MUDIS enables us to perform more than 220 000 spectral sky radiance measurements instead of approximately 6000 SCCD spectral sky radiance measurements per day and to measure spatial variations of spectral sky radiance simultaneously.
Export citation and abstract BibTeX RIS
1. Introduction
Measurements of spectral sky radiance and spectral direct irradiance are useful for many applications where knowledge of temporal and spatial information of the radiation field is necessary. Possible applications are the calculation of power yield of tilted solar cells (Beringer et al 2011) or the determination of spectral exposure of complex objects like the human body (Seckmeyer et al 2013). Sky radiance measurements can also be used to derive aerosol properties (Dubovik and King 2000), cloud properties (Hirsch et al 2012), as well as aerosol and trace gas profiles (Hönninger et al 2004).
Direct irradiance can be acquired in high temporal resolution, since only a single direction has to be measured (Kouremeti et al 2008). The measurement of spectral sky radiance is a more demanding task, since this four-dimensional unit depends on zenith angle, azimuth angle, wavelength and time. Spectral sky radiance as a function of zenith and azimuth angle is commonly derived by sequentially measuring a set of directions in the sky (further denoted as a sky scan). Sky scans of spectral radiance of the UV part of the spectrum have been successfully performed with spectroradiometers based on wavelength scanning double monochromators (Blumthaler et al 1996, Weihs et al 2000, Wuttke and Seckmeyer 2006, Cordero et al 2013). Double monochromator spectroradiometers fulfil high standards in terms of instrument stability, stray light reduction and wavelength resolution and thus provide excellent performance in the UV. They also have been thoroughly tested through instrument intercomparison campaigns (Lantz et al 2008, Pissulla et al 2009). However, due to their wavelength scanning principle, they are only capable of measuring a few chosen wavelengths at each sky point in order to perform a sky scan in a reasonable time frame. To overcome this shortage, systems based on charged coupled device (CCD) array spectrometers have been developed, e.g., by Kouremeti et al (2008) and Dunagan et al (2013) which are capable of measuring spectral radiance spectra simultaneously over their operational wavelength range. Nevertheless, a sky scan still takes several minutes depending on the speed of the positioning device turning the entrance optics, the spatial resolution and the measuring speed of the instrument. Therefore, measurement systems based on CCD arrays still provide poor temporal resolution and lack the capability to simultaneously measure the spectral sky radiance as a function of zenith and azimuth angle. However, this application would be desirable, since sky radiance usually changes rapidly due to movement and change of cloud coverage (Kuchinke et al 2004). A technical solution that is capable of measuring sky radiance with high spatial and temporal but low spectral resolution is provided by imager systems with fish-eye lenses (Román et al 2012, Tohsing et al 2013). Combining a tunable filter (Hardeberg et al 2002) or a Fabry–Perot interferometer (Pisani and Zucco 2009) with a fish-eye imager system improves the spectral resolution of such a system. Nevertheless, the wavelength resolution and sampling intervals of those systems are limited and additionally the wavelengths need to be scanned. Also, there is currently no UV transmitting fish-eye lens commercially available which means that UV sky radiance measurements of the whole hemisphere at once cannot be performed by these techniques yet.
To fill the gap of instruments capable of performing simultaneous spectral sky radiance measurements in the UV, we present a novel multidirectional spectroradiometer (MUDIS). The developed instrument performs UV spectral radiance measurements simultaneously in 113 directions of the sky with a high spectral and temporal resolution. We performed an instrument intercalibration with a sky SCCD and present results of an intercomparison between both instruments.
2. Instruments and methods
2.1. Multidirectional spectroradiometer
The developed spectroradiometer is shown in figure 1. The main component of MUDIS is a hyperspectral imager consisting of a UV-sensitive CCD camera (PCO AG, Kelheim, Germany) and an Offner imaging spectrometer. This imager design is commonly used for so-called push broom measurements of two-dimensional sceneries. Instead of measuring each pixel of a scene sequentially, push broom instruments are capable of performing spectral measurements of a whole line of pixels at once (Davis et al 2002). However, instead of measuring line by line with a camera lens and an entrance slit, we attached a bundle of optical fibres to the imager consisting of 113 single fibres lined up to a slit. The other ends of the fibres are embedded in a hemispherical-shaped dome in which the 113 fibres are evenly distributed in zenith and azimuth directions (figure 1). The field of view (FOV) of the fibres is not additionally limited by any optical part. A characterization of the fibres showed a FOV of 10.6° at 600 nm increasing up to 18.4° for shorter wavelengths (figure 2). A single measurement (sky capture) performed with MUDIS therefore simultaneously performs 113 sky radiance measurements in different zenith and azimuth directions.
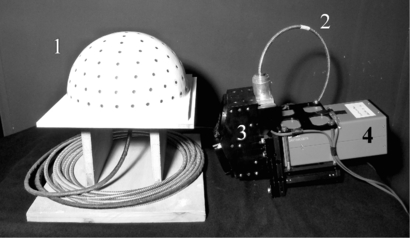
Figure 1. Main components of MUDIS: hemispherical entrance optics dome with weather protection (1), fibre bundle (2), Offner imaging spectrometer (3), UV-sensitive CCD camera (4). Both the camera and the spectrometer are operated in a weatherproof temperature-stabilized box (not shown here).
Download figure:
Standard image High-resolution image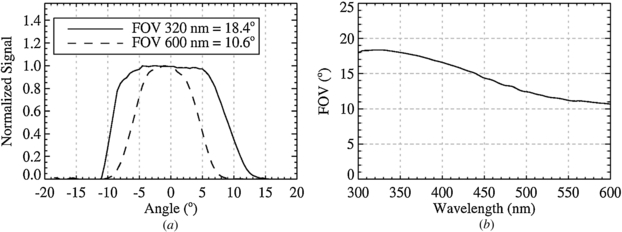
Figure 2. Field of view (FOV) of a typical fibre of the MUDIS instrument. Plot (a) shows the different angular response to light with 320 nm and 600 nm, respectively. Plot (b) shows the wavelength dependence of the FOV from 300 to 600 nm.
Download figure:
Standard image High-resolution imageMUDIS is capable of measuring spectra from 250 to 600 nm with a bandwidth of approximately 2 nm and a sampling interval of 0.4 nm. Figure 3 shows raw data captured with this setup under cloudless (a) and overcast (b) sky. Under cloudless sky, one fibre of the entrance optics is illuminated by direct sunlight. The corresponding area of the CCD sensor is oversaturated and several adjacent rows are affected by stray light. When measuring sky radiance during overcast sky, no saturation occurs and consequently stray light is less intense. In order to remove stray light in the UV, we apply a simple stray light correction method. Eight sensor rows that are not illuminated and thus only detect stray light during overcast sky (dashed lines in figure 3(b)) are averaged and the resulting average stray light spectrum is assumed to be sufficiently representative for the whole sensor area. Furthermore, illuminated sensor rows receive negligible radiation below 290 nm due to ozone absorption in the atmosphere. Each illuminated sensor row is now stray light corrected by a two-step method. First, the previously derived average stray light spectrum is scaled to the signal of the illuminated sensor row at 285 nm. Second, the scaled stray light is subtracted from the row. This method is similar to a stray light correction method developed by Jäkel et al (2007), where spectral filters are used to derive a reference stray light for a CCD array spectroradiometer. Nevertheless, we found that stray light originating from oversaturation differs in terms of intensity and spectrum from stray light observed without oversaturation. Rows affected by more than 20 counts of stray light at 285 nm are therefore discarded, since they cannot be corrected properly by this simple method.

Figure 3. Raw data captured with MUDIS under cloudless (a) and overcast (b) sky. The measured counts are plotted on a logarithmic scale and saturated values are marked black. Under cloudless sky, one channel is saturated due to direct sunlight and stray light originating from this channel affects several adjacent rows, especially in the UV part of the spectrum. The dashed lines in plot (b) mark rows that are not illuminated and are used to derive an average stray light signal.
Download figure:
Standard image High-resolution image2.2. Scanning CCD spectroradiometer
The SCCD system consists of a UV-VIS-sensitive CCD array spectrometer (StellarNet, Tampa, FL, USA) with a single radiance entrance optics attached to the instrument via a fibre bundle. The entrance optics has a FOV of 5° and is mounted on a positioning device that is able to scan a desired pattern of points in the hemisphere. A SCCD sky scan identical to the MUDIS entrance optics dome pattern takes about 12 min. The SCCD has been calibrated based on a 1000 W tungsten halogen lamp which has been calibrated by the Physikalisch-Technische Bundesanstalt. Details on the calibration process are described in Pissulla et al (2009). Kouremeti et al (2008) quantify the uncertainty of this calibration method with up to 5.55% in the UV. The measurements have been stray light corrected with an algorithm adopted from Kreuter and Blumthaler (2009). The SCCD is capable of measuring in a wavelength range of 270–900 nm with a bandwidth of approximately 1 nm and a sampling interval of 0.3 nm. Measurements performed with the SCCD are convoluted with a suitable slit function in order to achieve a 2 nm bandwidth for better spectral comparison with the MUDIS instrument.
2.3. MUDIS intercalibration
MUDIS is calibrated relative to the SCCD because a direct calibration similar to the SCCD calibration is not feasible. By measuring the same sky radiance scenery simultaneously with a calibrated and an uncalibrated instrument, it is possible to perform a radiometric calibration of the uncalibrated instrument (Röder et al 2005). While cloudless sky might be the most suitable scenery for this, task channels with high signal strength like those pointing to the circumsolar region or those saturated by direct irradiance lead to severe stray light contamination of vast regions of the sensor area (see figure 3(a)). Therefore, the intercalibration has been performed during overcast sky. The intercalibration has been performed based on 20 SCCD sky radiance scans performed on 22 October 2012 from 8:52 to 12:55 UTC. The solar zenith angle (SZA) during that time was between 69.4° and 63.2°. However, clouds are the dominating factor for the variability of the spectral radiance in this situation, reducing the received radiance especially in the UV compared to the cloudless sky. Therefore, an average of the 20 measurements is used for the determination of the MUDIS sensitivity in order to reduce uncertainties arising from cloud movement and low signal strength in the UV. However, the resulting sensitivity is still uncertain for wavelengths shorter than 320 nm.
3. Results of instrument comparison
Spectral sky radiance measurements were performed with MUDIS and SCCD in Hannover, Germany on 21 October and 25 October 2012 from 06:00 UTC (sunrise) to 16:00 UTC (sunset). The SZA during the measurements ranges from 90° at sunrise and sunset up to 63.2° at noon on 21 October and 64.6° at noon on 25 October respectively. The days cover two meteorological conditions suitable for instrument comparison: On 21 October the sky was cloudless in the time period of 09:30–16:00 UTC. On 25 October the sky was covered with stratocumulus clouds in the time period of 06:00–14:00 UTC. MUDIS sky captures were performed with an integration time of 100 ms and 64 images were averaged to improve the signal-to-noise ratio of the measurement. Considering data processing time, MUDIS captured the spectral radiance every 12 s in 113 directions simultaneously, which is equal to more than 220 000 sky radiance measurements per day. The SCCD performed sky scans identical to the MUDIS capture pattern every 12 min, which is equal to 52 radiance scans or 5876 sky radiance measurements, respectively. By combining single points of MUDIS captures measured at approximately the same time as points of SCCD sky scans, a MUDIS sky scan synchronous to the SCCD is derived. Unfortunately, due to a failure of the SCCD on 21 October measurements between 11:45 and 13:00 UTC are missing.
3.1. Comparison of spectral actinic irradiance
One possibility to quantify the difference between the two instruments is achieved by the integration of the measured spectral sky radiance over the hemisphere, which yields the spectral diffuse downward actinic irradiance (Seckmeyer et al 2010). Before integrating the spectral sky radiance, we remove faulty MUDIS measurements resulting from four broken fibres, oversaturation in the circumsolar region and measurements with high stray light (>20 counts at 285 nm). The remaining points are interpolated to a 5° grid using kriging interpolation (Isaaks and Srivastava 1989). The calculation of the spectral actinic irradiance FDIFF(λ) is performed after Kylling et al (2003):

where λ is the wavelength, θ the polar angle (90° zenith angle), ϕ the azimuth angle and L(λ, θ, ϕ) the spectral sky radiance.
Figure 4 shows the ratio of the spectral actinic irradiances measured with MUDIS and SCCD on 21 October (cloudless) and 25 October (overcast) 2012 at around 11 UTC. In order to remove fluctuations due to remaining differences in instrument bandwidth and wavelength shifts, a 10 nm median filter is applied. During cloudless sky, the ratio is decreasing from 1.04 to 1.00 in the wavelength range from 320 to 500 nm and increasing up to 1.02 from 500 to 600 nm. For overcast sky, the ratio is increasing from 0.96 to 1.00 from 320 to 600 nm. Based on this spectral comparison 320 and 500 nm are considered to be representative for the UV and VIS performance of MUDIS and therefore are used for the following temporal and spatial comparisons.
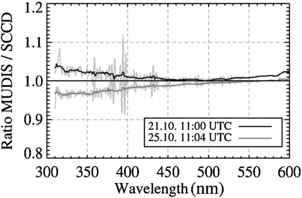
Figure 4. Median filtered ratios of spectral actinic irradiances measured with MUDIS and SCCD under cloudless sky on 21 October (black line) and under overcast sky on 25 October (dark grey line), 2012. The unfiltered ratios are plotted in light grey.
Download figure:
Standard image High-resolution imageThe variation of the actinic irradiance ratios at 320 and 500 nm during a cloudless time period on 21 October and an overcast time period on 25 October is shown in figure 5. Measurements of spectral actinic irradiance smaller than 10 mW m-2 nm-1, which occur at sunrise and sunset, are not taken into account. The actinic irradiance measurements of MUDIS and SCCD show a deviation of 6% during cloudless sky and 8% during overcast sky. The ratios of the actinic irradiance measurements are higher at 320 nm compared to 500 nm under cloudless sky and, in contrast, lower at 320 nm compared to 500 nm for overcast sky. We assume that this behaviour is linked to the applied intercalibration method. A transmission change of the entrance optics can be excluded, since the effect occurs in the morning of 21 October as well. During this time, it was cloudy at first and the sky cleared up after 09:30 UTC. Broken clouds occurring on 25 October from 12:00 to 16:00 UTC lead to higher deviations of up to 12% caused by the differences in FOV of the instrument and acquisition time.
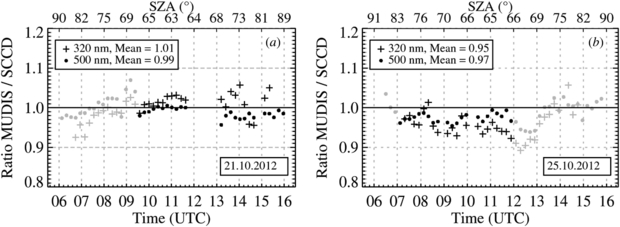
Figure 5. Ratio of diurnal spectral actinic irradiance measured with MUDIS and SCCD at 320 and 500 nm. In (a), measurements during a cloudless sky, period from 09:30 to 16:00 UTC on 21 October 2012 are marked with black symbols. In (b), the overcast period ranges from 07:00 to 12:00 UTC on 25 October 2012. In both plots, grey-marked ratios correspond to other sky conditions like broken clouds. The SZA corresponding to the measurement time is plotted in the upper x-axis.
Download figure:
Standard image High-resolution image3.2. Sky radiance comparison under cloudless and overcast sky
In figure 6, the MUDIS and SCCD sky radiance measurements performed at noon under a cloudless sky are shown for two representative wavelengths (320 and 500 nm) as a function of zenith and azimuth angle as polar plots (further denoted as sky maps). The black dots in the SCCD sky map represent the measuring pattern. In the MUDIS sky maps, the difference of MUDIS to SCCD sky radiance measurements is given in per cent. The 23 missing numbers of the pattern are measurement points that have been removed due to broken fibres (4 points), high stray light (12 points) and oversaturation in the circumsolar region (7 points). At 500 nm, sky radiance measured near the zenith with MUDIS is lower compared to the SCCD, which seems to be a systematic difference for dark blue regions of the sky.

Figure 6. Spectral sky radiance as a function of zenith and azimuth angle for 320 and 500 nm measured with MUDIS and SCCD under cloudless sky on 21 October 2012 at 11:00 UTC. The black dots plotted in the SCCD sky map represent the scan pattern. Numbers plotted in the MUDIS sky map represent the difference between corresponding MUDIS and SCCD measuring points in per cent. The sun symbol marks the position of the sun at the beginning of the sky scan.
Download figure:
Standard image High-resolution imageFigure 7 shows the spectral sky radiance distribution of a sky covered with stratocumulus clouds at 320 and 500 nm measured with MUDIS and SCCD at noon time analogous to figure 6. Clouds lead to a higher spatial and temporal variation of sky radiance compared to cloudless sky. Due to the absence of direct sunlight, no points had to be removed due to oversaturation and stray light, leaving four points removed due to broken fibres. Despite the different FOVs and acquisition times, the measured sky radiance as a function of zenith and azimuth angle of both instruments agrees well.

Figure 7. Spectral sky radiance as a function of zenith and azimuth angle for 320 and 500 nm measured with MUDIS and SCCD under overcast sky on 25 October 2012 at 11:04 UTC. The black dots plotted in the SCCD sky map represent the scan pattern. Red points are below 5 mW m-2 nm-1 sr-1. Numbers plotted in the MUDIS sky map represent the difference between corresponding MUDIS and SCCD measuring points in per cent. The sun symbol marks the position of the sun at the beginning of the sky scan.
Download figure:
Standard image High-resolution imageHistograms of MUDIS/SCCD sky radiance ratios at 320 and 500 nm of the cloudless time period on 21 October (09:30–16:00 UTC) and during overcast sky on 25 October (06:00–14:00 UTC) are shown in figure 8. MUDIS data points that are compromised by broken fibres, affected by high stray light, oversaturated in the circumsolar region or measured spectral radiance of less than 5 mW m−2 nm−1 sr−1 are removed from the dataset. Measurements performed at 84° zenith angle are partly obscured by obstacles like trees, thus leading to high deviations due to the different instrument FOVs. These points and outliers greater than four times the standard deviation (4σ) are also removed from the dataset. The bias between MUDIS and SCCD radiance under cloudless sky on 21 October is 1.7% with a 1σ standard deviation of 6.1% at 320 nm and −4.4% with a 1σ standard deviation of 8.7% at 500 nm. The 500 nm ratios show a minor maximum at 0.9 which is connected to low values of MUDIS measuring regions of dark blue sky as shown in figure 6. For overcast sky on 25 October the difference is −4.7% with a 1σ standard deviation of 9.9% at 320 nm and −1.6% with a 1σ standard deviation of 6.7% at 500 nm.

Figure 8. Histograms of MUDIS/SCCD spectral sky radiance ratios at 320 and 500 nm for the cloudless sky period on 21 October (a), (b) and for an overcast sky period on 25 October (c), (d). The vertical dashed lines show the corresponding standard deviations. The mean of all examined ratios is represented by the vertical solid lines.
Download figure:
Standard image High-resolution image3.3. Variation of sky radiance during sky scans
An example of the rapid change of the spectral sky radiance with time is shown in figure 9. Two MUDIS sky captures performed at 11:04 and 11:16 UTC are plotted. It is the same time period in which the SCCD sky scan discussed in figure 8 was performed. Sky radiance at 500 nm increases in this time period by up to 103% while the actinic irradiance increased by up to 41%. Such rapid changes demonstrate the advantage of the MUDIS instrument, which is capable of measuring the spectral sky radiance as a function of zenith and azimuth angle within seconds, rather than in minutes, compared to CCD array-based scanning instruments.

Figure 9. Spectral sky radiance at 500 nm measured with MUDIS under overcast sky on 25 October 2012 at 11:04 and 11:16 UTC. The numbers in the right plot show the increase in percent of the sky radiance at 11:16 UTC compared to the measurements at 11:04 UTC.
Download figure:
Standard image High-resolution image
4. Conclusions
Spectral sky radiance as a function of zenith and azimuth angle has been measured with the novel non-scanning MUDIS and has been intercalibrated and compared with measurements performed by a scanning CCD array spectroradiometer. Actinic irradiance calculated from radiance measurements of both instruments shows a deviation of less than 6% under cloudless sky and less than 8% during overcast sky. Histograms of sky radiance measurements at two representative wavelengths (320 and 500 nm) show good agreement between both instruments. Despite the inability to measure the circumsolar region with high spatial resolution, the MUDIS bare fibre entrance optics dome with a FOV of 10.6°–18.4° performs well compared to the 5° FOV SCCD entrance optics under various sky conditions. The development of a system capable of measuring sky radiance as a function of zenith and azimuth angle in seconds rather than minutes enables new possibilities to study the spectral influence of fast changing cloud conditions without the disadvantages of scanning processes. MUDIS measurements have been evaluated for wavelengths above 320 nm. The evaluation of lower wavelengths was limited by the low radiance levels occurring in late October at these wavelengths.
Acknowledgments
We thank Holger Schilke and Ulrich Meyer for their technical assistance in designing the MUDIS entrance optics. Special thanks are also directed to Professor Klaus Hasemann, who significantly helped us with funding for the MUDIS instrument in a critical phase.