

Abstract
Uniform sampling in metrology has known drawbacks such as coherent spectral aliasing and a lack of efficiency in terms of measuring time and data storage. The requirement for intelligent sampling strategies has been outlined over recent years, particularly where the measurement of structured surfaces is concerned. Most of the present research on intelligent sampling has focused on dimensional metrology using coordinate-measuring machines with little reported on the area of surface metrology. In the research reported here, potential intelligent sampling strategies for surface topography measurement of structured surfaces are investigated by using numerical simulation and experimental verification. The methods include the jittered uniform method, low-discrepancy pattern sampling and several adaptive methods which originate from computer graphics, coordinate metrology and previous research by the authors. By combining the use of advanced reconstruction methods and feature-based characterization techniques, the measurement performance of the sampling methods is studied using case studies. The advantages, stability and feasibility of these techniques for practical measurements are discussed.
Export citation and abstract BibTeX RIS
1. Introduction
Uniform sampling has been used in surface topography measurement as the default measuring strategy for the last fifty years. Uniform sampling is widely accepted as the most natural sampling method due to its good numerical operability and the maturity of its theoretical foundations [1, 2]. However, the emergence of structured surfaces [3, 4] has forced surface metrologists to consider the drawbacks of uniform sampling. The main drawbacks include coherent spectral aliasing [5] (see figure 1) and a lack of efficiency in terms of measuring time and data storage [6]. Structured surfaces usually consist of repeated geometrical structures over wide areas or are in the form of large step-like features as encountered on MEMS or micro-fluidic devices. These novel kinds of surfaces usually require both large sampling areas and small sampling intervals (or spacing) to guarantee both the measuring efficiency and accuracy. The requirement described here is for intelligent sampling methods that are able to address the drawbacks of uniform sampling.

Figure 1. Illustration of the coherent spectral aliasing effect in computer graphics. (a) Uniform sampling produces coherent aliasing; (b) jittered uniform sampling transforms the aliasing into noise [5].
Download figure:
Standard imageIntelligent sampling methods in the fields of computer graphics and coordinate metrology have been a research focus during the last 20 years [5–15]. Several techniques have been developed to overcome the coherent spectral aliasing problem such as jittered uniform sampling [5]. Some methods are produced in order to reduce the statistical error of form estimation, such as the low-discrepancy pattern sampling [7]. Other intelligent sampling methods have flexible sampling designs adapting to the surface geometric changes, i.e. adaptive sampling methods; thus, the sample size and sampling duration can be reduced efficiently [6, 10–15]. However, to date, only a small number of methods for intelligent sampling have been used in surface metrology (see section 2).
In this research, the performances of potential intelligent sampling methods have been investigated on the basis of the measurement of structured surfaces. To judge the performances of different sampling methods, a widely used evaluation indictor, i.e. such as the root-mean-square (RMS) height residuals, is used. For example, by comparing the reconstructed surface based on an intelligently designed sampling pattern to the original continuous surface, a deviation map of the height information can be obtained for reference. However, the height deviations are only capable to measure the height information in a global way. A feature-based characterization technique [16, 17] is additionally used in this research. With the feature-based characterization, dimensional parameters relating to regional geometric features can be figured as extra indicators.
In general, no single sampling method has ideal performance or is flexible enough to be applied to all surface types [3]. It is anticipated that an intelligent sampling toolbox will form the core part of the next generation of the measurement modules in surface measuring instruments. Before the advantages of intelligent sampling can be fully exploited, two specific issues need to be addressed.
- (1)ReconstructionIn surface metrology, measurement results are usually presented in the form of a cloud of regularly spaced points. This regular lattice data can be easily manipulated for mathematical computation or transforms, such as convolution or discrete Fourier transforms [18]. With the traditional triangulation-based rendering techniques, or other reconstruction techniques such as bilinear interpolation, the results are generally expressed as a continuous surface for visual inspection, for example, in OpenGL and MATLAB [19, 20].Most intelligent sampling methods result in a non-regular lattice of distributed (or scattered) sample points. In this case, advanced reconstruction methods need to be considered, such as tensor product reconstruction with B-splines, triangulation and radial basis function (RBF) reconstruction [21]. In this way, the point cloud can be reconstructed into a continuous surface for visual inspection in a stable manner; regular latticed data can then be extracted from the constructed continuous surface for fast numerical manipulation.
- (2)New data formatsCurrent sampling data are usually saved as a coded matrix (for example, the reference data format SDF defined in ISO/FDIS 25178 part 71 [22]) which corresponds to the height information of regularly latticed sample points. This format cannot represent non-regularly spaced latticed data, in which case the whole three-dimensional information of each sampled data point needs to be saved. Intelligent sampling requires a new data format that supports saving of the non-regularly latticed data. Also in the 'trailer' part of this new data format (see figure 2), the specifications in terms of the reconstruction should be assigned aiming to reduce the reconstruction uncertainties. Figure 2 gives an outline schematic of a new data format.
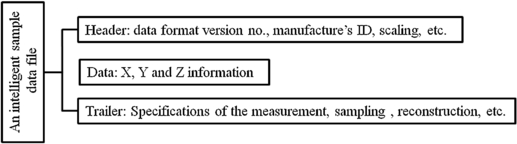
Figure 2. Schematic diagram of a new data format for surface measurement.
Download figure:
Standard imageFour types of sampling strategies and seven method variations in total have been studied in this research. In the following, a brief literature review is given in section 2 followed by an introduction to the sampling methods investigated in section 3. Section 4 introduces potential reconstruction methods for non-regularly spaced sample data. In section 5, error evaluation methods are described by introducing feature-based characterization techniques. Following this, case studies are given in which different sampling methods are applied to three examples of structured surfaces. The advantages and disadvantages of each method are demonstrated and discussed.
2. Current state-of-the-art of surface sampling
As a direct and simple variation on uniform sampling, jittered uniform sampling provides an efficient solution to convert the coherent spectral aliasing of a measurement data into random noise [5]. Kim and Raman [23] investigated this method for flatness measurement. It is found that jittered uniform sampling provides an accurate measurement result compared to low-discrepancy pattern sampling.
Low-discrepancy patterns are found to be optimal for minimizing the discrepancy between a measurement value and the true value of the statistical properties of a population [5, 7, 24]. Some optimal patterns have been used for coordinate metrology. Woo et al [8] investigated Hammersley and Halton-Zaremba patterns for the estimation of surface flatness and arithmetic mean roughness. Significant improvements on saving the sample size (or minimizing the measurement error) were found compared to uniform sampling methods in their simulations. Lee et al [9] modified the conventional Hammersley pattern for special object measurements such as circular features, conical features and hemispherical features. The advantages of low-discrepancy patterns have also been demonstrated in practical flatness measurement [23].
Adaptive sampling is a novel sampling design that can redirect sampling effort during a survey in response to the observed values [25]. Generally, there are two main categories of adaptive sampling strategies: model-based methods and non-model-based methods. The former specifies the sampling positions based on a given nominal model (e.g. a CAD surface model, or a preliminary measurement with a simple sample design) by analysing its local surface properties such as the mean curvature. To be strict, the model-based sampling methods are not adaptive to their earlier samples, i.e. they are not an adaptive sampling [25]. In this paper, these techniques are also regarded as an adaptive sampling because their samples are adaptive to a given surface model or a preliminary measurement. Most of the earlier work on adaptive sampling is based on given models. Cho and Kim [26] developed an adaptive sampling method based on mean curvature analysis and various probe path generation algorithms are tested. Elkott introduced several CAD-based sampling methods for freeform surface metrology; this included four kinds of automatic sampling [11], curvature change-based sampling and iso-parametric sampling [12]. Shih et al [10] developed three kinds of adaptive sampling methods for coordinate metrology, such as direct sampling, indirect sampling and local adjustment sampling. A discrete wavelet decomposition-based adaptive sampling technique has also been proposed recently [13]. These methods have been shown to be advantageous in terms of saving sample size or improving sampling accuracy for most general cases. However, CAD model-based solutions do not consider unexpected defects that are generally present in practical manufactured products, and the pre-positioning error in clamping a surface product may induce a significant bias in the sampling positions. These considerations are of particular criticisms in the measurement of micro- or nano-scale structured surfaces.
In contrast, the non-model-based method has the ability to adjust its sampling points in real time. They are regarded as adaptive sampling in the strict sense. Edgeworth and Wilhem [15] proposed a real-time adaptive sampling method based on surface normal measurement. Hu et al [27] proposed an adaptive scanning strategy that automatically adjusts its sample step length according to surface slope variations. These solutions avoid inherent positioning errors and are able to effectively pick up the necessary information to identify potential defects. Their real-time sampling designs may not be as optimized as in the case of the model-based method. Also, the results are generally sensitive to the initial conditions, such as the initial sample position. However, they can easily generate a good sampling result without an accurate pre-positioning.
The presence of a plethora of techniques shows that no single method is ideal and applicable in all cases. Selection of an optimized method depends on the specific surface, and the required measurement efficiency and accuracy. A sampling toolbox that integrates diverse sampling methods would be highly beneficial for future advanced measurement scenarios.
In addition, on the realization of efficient measurement, some intelligent scanning techniques and instruments have been developed. For example, Wieczorowski developed a spiral scanning-based surface texture measurement equipment [28] which avoids the time-consuming reciprocating movement in raster scan. Machleidt et al [29] developed a large-scope AFM measuring machine based on a nanopositioning and nanomeasuring machine stage. Also, the recent success in manufacturing the 128-cantilever array [30] enables fast surface measurement in nano-scales. With the development of the intelligent sampling designs and scanning techniques, efficient measurements are on their way to current instruments. But in this paper, only sampling pattern designs are investigated.
3. Sampling methods
3.1. Uniform sampling
Uniform sampling, sometimes referred to as uniform stratified sampling, allocates sampling points in a regular latticed pattern, for example, the most classical regular 'square grid' pattern which is investigated in this study. Investigations on different uniform sampling methods are described elsewhere [31, 32]. The 'square grid' uniform sampling method is implemented by allocating a random start point ![${\bm p}_{0} = [x_0 ,y_0 ]_{x_0 ,y_0 \in \mathbb{R}}$](https://content.cld.iop.org/journals/0957-0233/23/8/085006/revision1/mst425595ieqn1.gif) in a plane and subsequent periodic translations
in a plane and subsequent periodic translations ![$d = [d_x ,d_y ]_{d_x ,d_y \in\mathbb{R} }$](https://content.cld.iop.org/journals/0957-0233/23/8/085006/revision1/mst425595ieqn2.gif) and duplications on the x/y directions. Thus, a 'square grid' pattern P can be constructed (see figure 3(a)):
and duplications on the x/y directions. Thus, a 'square grid' pattern P can be constructed (see figure 3(a)):


Figure 3. Illustration of typical sampling strategies with 100 sample points. (a) A uniform pattern. (b) A jittered uniform pattern. (c) A Hammersley pattern. (d) A Halton pattern.
Download figure:
Standard image3.2. Jittered uniform sampling
Jittered uniform sampling is a simple variation of uniform sampling. Simply added with a random position jittering sequence  , a uniform sampling pattern becomes a jittered uniform sampling pattern (see figure 3(b)):

3.3. Low-discrepancy pattern sampling
By optimizing the sampling pattern, an estimation error of the total or average properties of the population can be reduced. Two classical low-discrepancy patterns—Hammersley and Halton pattern—are introduced here by considering their two-dimensional case:
in which Φb(i) is the radical inverse function [5] Φb(i) = 0.d1d2...dm, where di satisfies  . The radical inverse function converts a non-negative integer i into a floating-point number within [0, 1). For example, the first ten numbers of Φ2 are
 ![$\left[ {\frac{{\rm 1}}{{\rm 2}}{\rm ,}\frac{{\rm 1}}{{\rm 4}}{\rm ,}\frac{{\rm 3}}{{\rm 4}}{\rm ,}\frac{{\rm 1}}{{\rm 8}}{\rm ,}\frac{{\rm 5}}{{\rm 8}}{\rm ,}\frac{{\rm 3}}{{\rm 8}}{\rm ,}\frac{{\rm 7}}{{\rm 8}}{\rm ,}\frac{{\rm 1}}{{{\rm 16}}}{\rm ,}\frac{{{\rm 15}}}{{{\rm 16}}}{\rm ,}\frac{{\rm 5}}{{{\rm 16}}}} \right]$](https://content.cld.iop.org/journals/0957-0233/23/8/085006/revision1/mst425595ieqn5.gif) . The Hammersley and Halton patterns of 100 points are illustrated in figures 3(c) and (d), respectively.
. The Hammersley and Halton patterns of 100 points are illustrated in figures 3(c) and (d), respectively.
3.4. Adaptive sampling
Three adaptive sampling methods have been studied in this research and these comprise the following: sequential profiling adaptive sampling, triangle patch adaptive subdivision sampling and rectangle patch adaptive subdivision sampling. Adaptive sampling has no fixed sampling pattern or mathematical expressions similar to the four methods above. Adaptive sampling methods are expressed by ordered algorithm procedures.
3.4.1. Sequential profiling adaptive sampling
Sequential profiling adaptive sampling [6] has been developed based on Shih's indirect sampling [10]. Considering the raster scanning mechanism used in conventional stylus profilometers, this method is expected to work on current stylus instruments to enable efficient measurements. Sequential profiling adaptive sampling is a non-CAD model-based method which consists of a core algorithm—profile adaptive compression—and works in two sequential stages.
The profile adaptive compression algorithm requires an initial profile scanning as a reference which employs a high-density sample size setting, e.g. the instrument allowed highest sample density. The key samples are then selected from the initial samples by recursively examining the reconstruction error compared to a pre-defined threshold. Specifically, in the first stage, an approximate measurement (for example, take several profile scans in the y-direction at random or uniformly selected x-positions, see figure 4(b)) is carried out and the y coordinates of the key scanning positions can thus be determined based on the adaptive compression algorithm. In the second stage, a fine adaptive sampling is implemented in the x-direction at each of the key scanning position. With the aid of the adaptive compression algorithm, the key samples of each x-direction scan are collected which constitute the final sampling result. As illustrated in figure 4(c), a final sampling result can thus be achieved. This method has been demonstrated with apparent advantages over the four sampling patterns for the measurement of structured surfaces. A detailed description of this technique can be found elsewhere [6].
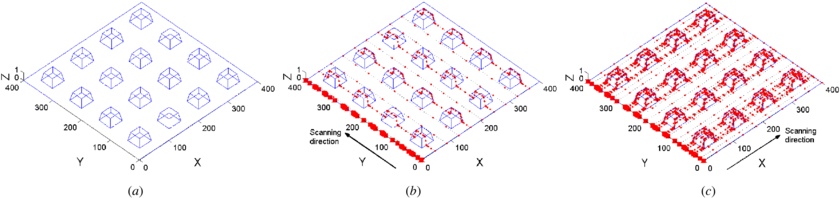
Figure 4. Two stages of the sequential profiling adaptive sampling. (a) The original structured surface. (b) First stage: implementation of ten profile adaptive compression sampling in the y-direction (dashed lines); and based on the pruned key sample positions (red dots), the down-sampled key scanning positions are selected (red squares). (c) Second stage: implementation of the profile adaptive compression sampling on the x-direction at each selected position.
Download figure:
Standard image3.4.2. Triangle patch and rectangle patch adaptive subdivision sampling
Triangle patch and rectangle patch adaptive subdivision samplings are two CAD model-based methods. They require a CAD model or a preliminary measurement (with a simple sample design, e.g. uniform sampling) for the determination of the adaptive samples. The two methods have been introduced as 'direct sampling' [10]; hereby, a brief introduction is given and a minor modification to the error evaluation criteria is made. The algorithm is as follows.
- 1.Triangle patch adaptive subdivision sampling.
- (1)Select a rectangle region on a surface as the sampling object.
- (2)Select four initial points on the extreme corners of the rectangle region and group the four corner points into two triangles.
- (3)Subdivide each triangle into four triangles by inserting three points on the centre of the edges of the triangle, as in figure 5(a).
- (4)Evaluate the reconstruction error3 of each triangle.
- (5)If the error is greater than a preset threshold, then repeat steps 3 and 4. Otherwise, stop.
- 2.Rectangle patch adaptive subdivision sampling.
- (1)Select a rectangle region on a surface as the sampling object.
- (2)Select four initial points on the extreme corners of the rectangle region.
- (3)Subdivide the projected area into four rectangles by inserting five points as shown in figure 5(b).
- (4)Evaluate the reconstruction error1 of each rectangle.
- (5)If the error is greater than a preset threshold, then repeat steps 3 and 4. Otherwise, stop.
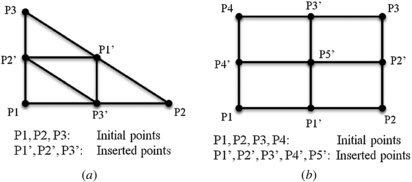
Figure 5. Subdivision of triangle and rectangle patches. (a) Triangle patch subdivision. (b) Rectangle patch subdivision.
Download figure:
Standard imageRepresentative sample patterns generated by the three methods are illustrated in figure 6 in which the ideal surface tested in figure 4(a) is sampled respectively using each method above with a sample size of approximately 1500 points. It is found that the sequential profiling adaptive sampling pattern has no regular distribution of sample points on the feature edges. Triangle patch and rectangle patch adaptive division samplings generate more regularly designed sample patterns. Specifically, the former has dense samples regularly on the feature edges, while the latter yield more dense samples at the feature lateral corners.
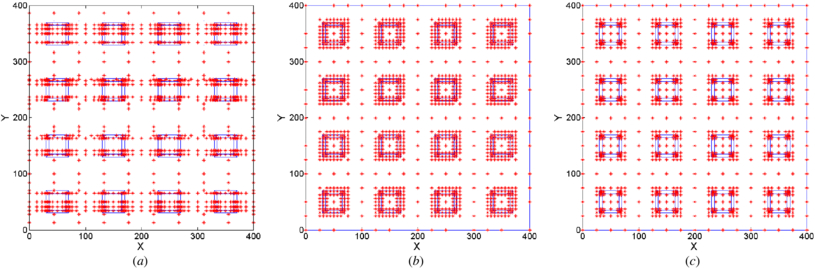
Figure 6. Adaptive sampling patterns produced by the three adaptive sampling methods (≈1500 sample points). (a) Sequential profiling adaptive sampling. (b) Triangle patch adaptive subdivision sampling. (c) Rectangle patch adaptive subdivision sampling.
Download figure:
Standard image4. Reconstruction
Surface reconstruction is the process of obtaining a continuous surface that best illustrates a given discrete data point set. Diverse methods for reconstruction of regular lattice and scattered data in surface measurement have been investigated [21].
4.1. Tensor product surface reconstruction
The tensor product method has been widely used for the reconstruction of regular lattice data (for example, the uniform sampling result in figure 3(a) or partially regularly latticed data in figure 6(a)); this is due to this method's high numerical stability and computational efficiency. The tensor product method presents a surface as a tensor product of two bases, for example,
in the x and y directions independently. Thus, the surface can be expressed as
where {ϕk} and {φl} are preset base functions and the coefficient vectors a and b should be calculated from the data. Chebyshev polynomials, polynomial splines and B-splines provide base functions for the tensor product surface reconstruction [2]. Considering the smoothness and computational stabilities, second- (linear) and fourth-order (cubic) B-spline [33] basis functions are adopted in this research.
4.2. Delaunay triangulation reconstruction
Intelligent sampling always results in non-regular latticed data which cannot be solved by the tensor product method. Triangulation-based methods are a simple and stable substitution. For example, Delaunay triangulation [34, 35] establishes neighbourhood connections among the data points with the Delaunay triangulation algorithm, which neglects all the non-neighbouring points in the Voronoi diagram of the given points and avoids poorly shaped triangles. Following this structuring process, regional reconstructions [35] (linear or cubic) within each triangle patch can be carried out. These methods are able to guarantee a reconstruction to arbitrary accuracy if the sample points are dense enough, which provides the theoretical foundation for developing new reconstruction techniques.
Considering that the amount of sample points for surface measurement is usually large, RBF-based interpolations or fits are not generally recommended. For example, it has been stated elsewhere [36] that RBF-based reconstructions may be very unstable, computationally complex and memory consuming; the RBF-based reconstructions are only employed when data points are no more than several thousand in number.
Typical examples using the tensor product reconstruction methods and the Delaunay triangulation method are presented in figure 7 in which the sample result shown in figure 6(a) is tested. The performance differences of the reconstruction results are clearly shown. Selecting an appropriate method for reconstruction usually depends on many conditions, such as the surface complexity, distribution of the sample points, accuracy and efficiency requirements, and so on. In this study, all the potential methods are tested and the best one (with the minimum residual error) is selected for use.
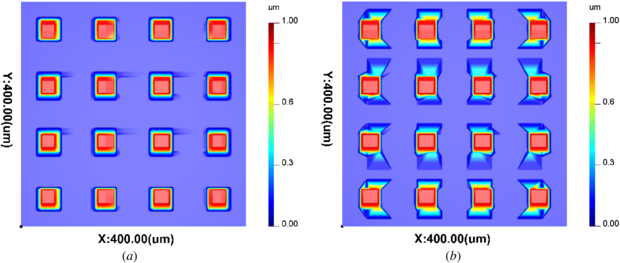
Figure 7. Reconstruction from the sample result of figure 6(a). (a) Tensor product reconstruction with the second order B-splines. (b) Delaunay triangulation reconstruction (linear).
Download figure:
Standard image5. Error evaluation
5.1. Height residual estimation
Traditional surface geometry descriptors and the traditional statistical parameters such as Sa, Sq or Ssk [37] have been reported to have a lack of efficiency when used to characterize structured surfaces [4]. In a new feature-based characterization system [17, 38], surfaces are treated as a composition of diverse geometric features. Characterization of each individually recognized feature and a statistic of the concerned feature attributes have been developed. Therefore, the purely statistical methods have not been used in this study although they have been used in earlier research work [8, 9, 14].
Estimations of the statistical values (for example, the RMS value, maximum, etc) of the height residuals are usually employed when measuring freeform surfaces. In this way, the CAD model and the measured surface are compared based on height information, and a residual map can then be obtained. Evaluation of the residual map would seem appropriate forperformance comparison of different sampling methods. This solution has been used in nearly all of the current research in metrology [6, 10–12, 15, 26].
In this study, the RMS height residuals error is employed using the following:
where zi are each value of the standard high-density sampled data matrix, z'i is each value of the reconstructed surface data matrix which has the same sample size as the standard data and N is the size of the high-density sampled data matrix.
5.2. Feature-based characterization
Feature-based characterization has been recognized as being of high importance in advanced metrology techniques [39], particularly for the characterization of structured surfaces by extracting micro-scale-dimensional parameters [40, 41]. By sequentially employing the 'areal feature segmentation' [16, 42], 'boundary segmentation' [41, 43], 'dimensional parameter selection' (such as the defined attributes in [17]) and the 'parameter calculation and statistics' [38], the concerned micro-scale-dimensional parameters can be extracted. These parameters are then used for the performance comparison of different sampling methods. For example, the mean absolute deviations of these evaluation parameters from that of the original high-density sampled results are investigated in this paper:

in which p0 is an evaluation parameter (for example, step height, roundness) extracted from the original high-density sampled surface or CAD models, and pi are the corresponding parameters extracted from a reconstructed surface that was sampled at a lower density. For example, figure 8(a) shows a Fresnel lens surface (table 1, (c)) reconstructed from a 2500 Hammersley pattern sample and the areal segmentation is carried out by extracting the feature edges (bold yellow curves). Evaluation parameters pi such as radius and roundness of a circle feature can be consequently estimated (figure 8(b)). If repeated tests are carried out, a mean value of the results from the same sampling setting is taken.

Figure 8. Illustration of a feature-based characterization of a circle-edged feature. (a) Areal feature segmentation. (b) Boundary analysis.
Download figure:
Standard imageTable 1. The three typical structured surface specimens and the experimental settings.
 a a |
aThe tested sample sizes are selected based on the following criteria: (1) the tested samples sizes are representatively selected which indicates they might be normally used in practical measurements; (2) the tested sample cannot be too small in which case severe reconstruction distortion occurs; (3) the tested sample size cannot be too large in which case reconstruction error has minor fluctuations and the evaluation process may be time consuming.
6. Performance tests
6.1. Experimental settings
General structured surfaces contain three basic types of feature groupings. These comprise linear patterns, tessellations and rotationally symmetric patterns [4]. Three representative high-precision structured surface specimens were used in this research to validate the performance of different sampling methods. High-precision measurements of the three surfaces are presented in table 1, (a)–(c), which include a five parallel-groove calibration artefact, a nine pits-crossed-grating calibration artefact and a Fresnel lens central patch. These high-density sampled results are used as the references for comparison. A performance evaluation procedure is described as follows.
- (1)Standard data preparation.For a given real surface, obtain the standard measurement result (e.g. a 1024 × 1024 regular lattice data) using the instrument allowed high-density sample setting. The standard-feature-related parameters (e.g. groove-width, step height, see table 1, which are selected in consideration of the main functions of the structured surfaces) are characterized for later uses.
- (2)Sampling.Re-sample the standard surface data using different sampling methods and sample sizes. In this study, seven sampling methods and six different sample sizes (see table 1) on each of the specimens are tested.
- (3)Reconstruction.Potential reconstruction methods are then employed to reconstruct the 'continuous' surface with the same sample design as the originals—the standard measurement result. The best reconstruction results with the lowest RMS height residuals are selected for use.
- (4)Performance evaluation.Extract the RMS height residuals of each reconstructed data from the standard data; extract feature related parameters from each reconstructed surface and the differences from the standard measurement results are calculated. The smaller the height residual or a parameter difference, the better the performance of the sampling design used.
6.2. Results and discussion
The results in table 2 show the sampling errors—the discrepancies of each evaluation parameter between each sampling-reconstruction result and the standard high-density sample result. It indicates that the sampling error has a power function-like relationship against sample size

where y is sampling error, x denotes the sample sizes and c and b need to be calculated to give the best fit function. Other researchers have shown similar results [6, 8, 10, 23]. A linear plot of the sampling errors against the sample sizes cannot render a clear performance comparison when sample size increases.
Table 2. Deviations of the evaluation parameters from the standard result for samples 1, 2 and 3 (log–log plots).
 |
Since a linear relationship existed between ln y and ln x deduced from the above power function

log–log plotting is employed in this research thus the sampling performance can be shown evenly. By plotting the sampling-reconstruction errors against the sample sizes and giving the best fitting power functions, the sampling errors of each evaluation parameters extracted from the numerical experimental results are presented in table 2.
The following conclusions can be drawn in sequence.
- (1)Adaptive sampling methods usually have prominent advantages over other methods in terms of minimizing the sampling error (height residuals and feature parameters) for structured surfaces.
- (2)Uniform sampling, jittered uniform sampling, Hammersley pattern and Halton pattern samplings have close capabilities for retaining the measuring accuracies for measurement of structured surfaces. None of the methods show clear advantages over others.
- (3)On measuring the linear patterns, the sequential profiling adaptive sampling always has distinct advantages over the other methods.
- (4)On measuring the tessellations, the three adaptive methods show their advantages on measuring the height-related parameters such as the step height. But they have similar capabilities as other fixed sampling patterns when measuring the lateral parameters such as the mean pitch distance.
- (5)On measuring the rotational symmetric patterns, triangle patch and rectangle patch adaptive subdivision samplings show significant advantages.
Low-discrepancy pattern sampling methods have a similar performance as uniform or jittered uniform sampling. However, it does not mean that they are not an optimizing method; for example, clear advantages have been shown when measuring flatness of flat surfaces [8, 23]. On measuring structured surfaces, their advantages are not apparent and sometimes they may not be a better substitution of uniform methods. Sometimes, uniform sampling may be a better solution compared to other fixed patterns; evidence for this can be seen in table 2, (a).
The fundamental advantages of adaptive sampling are in evidence in this work. These methodologies allocate their sampling efforts according to their earlier sample results or models. In other words, they can adapt the sampling effort to key positions which have higher impact factors on enhancing the reconstruction accuracy than others. Although adaptive sampling approaches have no clear advantages for measuring the pitch distance of crossed-gratings (see table 2, (e)) but have been shown to be effective for other structured surfaces and other parameters of tessellated surfaces.
The challenges, however, of applying adaptive sampling to practical measurements still widely exist. The sequential profiling adaptive method may suffer from the mechanical constraints of stability (e.g. the thermal drift) and accuracy in y-direction scanning. Most of the other efficient sampling methods are difficult to implement within the operation envelope of stylus instruments, with regard to complex scan route designs and redundant scan duration. In terms of interferometers, many of the reviewed sampling methods may be of promise, with the aid of a high-resolution CCD and pixel stratification process or lens auto-switch systems. Considering the positioning errors and optical resolution constraints, a specialized research work on intelligent sampling of the interferometers may be required in the next step. In addition, more theoretical work is necessary to further the research on intelligent sampling. For example, the data storage solutions need to be reconsidered which was introduced at the beginning of this paper. The reverse problem on sampling and reconstruction need to be fully investigated on the basis of geometric measurement. Also, determination of the sample size for an adaptive measurement is a tough research topic which requires particular attention.
7. Conclusions
Selection of proper reconstruction techniques, conventional uniform sampling and three efficient sampling strategies are investigated for the measurement of structured surfaces. The sampling accuracies of each method are estimated by testing three representative structured surface specimens. Specifically, the RMS height residuals and the main function-related feature parameters of the tested samples are evaluated. In the presented comparison results, no prominent advantages are found among the fixed sampling patterns, i.e. uniform sampling, jittered uniform sampling, Hammersley pattern and Halton pattern samplings. Adaptive sampling methods show their distinctive performances in most of the cases. Particularly, performance differences between sequential profiling adaptive sampling and the other adaptive methods have also been shown.
As an innovative measurement technique with prominent advantages, the difficulties of transferring the intelligent sampling techniques to practical instruments are widely challenging. For example, the mechanical and optical limitations of the stylus instruments or interferometers are not considered at the moment; the reverse problem on sampling and reconstruction has not been fully understood. However, with successful solutions of these challenges, efficient samplings are of promise in the next generation of measurement techniques, especially where large areas need to be covered with high resolution.
Acknowledgments
JW would like to thank the National Physical Laboratory UK for supporting this research work under the UK NMO Programme for Engineering & Flow Metrology (2008 to 2011) and the University of Huddersfield under the excellent research programme. XJ would also like to gratefully acknowledge the Royal Society under a Wolfson Research Merit Award and the European Research Council under its programme ERC-2008-AdG 228117-Surfund.
Footnotes
- 3
The reconstruction error in step (4) of the two methods is the maximum deviation between the original surface patch and the reconstructed surface patch using linear interpolation (for triangle surface patch) or bilinear interpolation (for rectangle surface patch).