Abstract
Elastic and anelastic properties of La0.5Ca0.5MnO3 determined by resonant ultrasound spectroscopy in the frequency range ∼100–1200 kHz have been used to evaluate the role of grain size in determining the competition between ferromagnetism and Jahn–Teller/charge order of manganites which show colossal magneto resistance. At crystallite sizes of ∼75 and ∼135 nm the dominant feature is softening of the shear modulus as the charge order transition point, Tco (∼225 K), is approached from above and below, matching the form of softening seen previously in samples with 'bulk' properties. This is consistent with a bilinear dominant strain/order parameter coupling, which occurs between the tetragonal shear strain and the Jahn–Teller
 order parameter. At crystallite sizes of ∼34 and ∼42 nm the charge ordered phase is suppressed but there is still softening of the shear modulus, with a minimum near Tco. This indicates that some degree of pseudoproper ferroelastic behaviour is retained. The primary cause of the suppresion of the charge ordered structure in nanocrystalline samples is therefore considered to be due to suppression of macroscopic strain, even though MnO6 octahedra must develop some Jahn–Teller distortions on a local length scale. This mechanism for stabilizing ferromagnetism differs from imposition of either an external magnetic field or a homogeneous external strain field (from a substrate), and is likely to lead both to local strain heterogeneity within the nanocrystallites and to different tilting of octahedra within the orthorhombic structure. An additional first order transition occurs near 40 K in all samples and appears to involve some very small strain contrast between two ferromagnetic structures.
Export citation and abstract BibTeX RIS

Content from this work may be used under the terms of the Creative Commons Attribution 3.0 licence. Any further distribution of this work must maintain attribution to the author(s) and the title of the work, journal citation and DOI.
Changes were made to this article on 17 March 2015. The article was made open access.
1. Introduction
A recent focus in materials physics has been on the functional properties of materials with multiple instabilities that involve combinations of ferro/antiferroelectric, ferro/antiferromagnetic and ferroelastic phase transitions. In multiferroics the aim is to induce a magnetic response by applying an electric field or a ferroelectric response by applying a magnetic field, in magnetoresistant materials a change in electrical resistivity is induced by a magnetic field and in magnetocalorics (or electrocalorics) the need is to induce thermal changes by applying a magnetic (or electric) field, etc. Behind these efforts is the aim to understand the mechanisms by which the different properties are interdependent so that required patterns of behaviour can be tuned through the choice of structure type, composition, grain size or, in the case of thin films, the choice of substrate. In this context, perhaps the most universal mechanism is strain. Any change that occurs in a structure, whether due to ordering of magnetic moments, changes in electronic configuration or atomic displacements, is accompanied by some degree of lattice distortion. It follows, firstly, that strains which are common to two different ferroic properties in a single phase or in an intimate mixture of two phases will cause them to be coupled and, secondly, that the overall structural and thermodynamic behaviour must depend on the (relatively large) length scale of strain interactions rather than the (relatively short) length scale of interactions between magnetic or electric dipoles. The primary objective of the present study was to use elastic and anelastic properties to characterize strain relaxation behaviour as a function of grain size, down to the nanoscale, in the competition between ferromagnetic ordering and charge ordering of colossal magneto resistant manganites.
Strain coupling phenomena can be investigated directly through determinations of lattice parameters and indirectly through their influence on elastic moduli. The elastic moduli are particularly sensitive measures because they represent susceptibility with respect to strain in a manner that is analogous to magnetic susceptibility with respect to a magnetic order parameter, and dielectric permittivity with respect to a ferroelectric order parameter. The half-doped La,Ca phase, La1−xCaxMnO3 with x = 0.5, was chosen because it lies in the range of temperature-composition space where the energetics of the charge ordered insulating phase (x > 0.5) and the La-rich ferromagnetic metallic phase (x < 0.5) are almost exactly balanced. This balance is known to be tipped in favor of ferromagnetism when grain size is reduced to dimensions where strong magnetic dipole interactions can occur but cooperative Jahn–Teller distortions are reduced [1–6]. We propose that suppression of the charge ordered phase is due specifically to suppression of long range ferroelastic shear strain, even though local Jahn–Teller distortions of MnO6 octahedra still occur. This is fundamentally different from the influence of homogeneous strain imposed by a substrate on a thin film because it will involve strain heterogeneity on a local scale within the nanocrystals.
The structural and magnetic behaviour of La1−xCaxMnO3 is well known. Bulk samples of La0.5Ca0.5MnO3 undergo a charge ordering transition to an incommensurate structure at Tco ∼ 225 K which is driven largely by cooperative Jahn–Teller distortions [7, 8]. There is a marked hysteresis with respect to the temperature dependence of the superstructure repeat, which changes from incommensurate to commensurate near 130 K during cooling and near 180 K during heating [7, 9, 10]. An antiferromagnetic ordering transition has its Néel point, TN, near 160 K during cooling and near 190 K during heating in weak/zero field [11, 12], i.e. almost coincident with the incommensurate-commensurate transition. The ground state is generally accepted as being an insulating, antiferromagnetically ordered, commensurate structure with some degree of charge order (e.g. [13]). Competition with the ferromagnetic metallic structure is reflected in the fact that there is invariably evidence for the presence of a second phase at all temperatures below Tco. In the range Tco > T > TN, the coexistence is believed to be of ferromagnetic metal finely dispersed within a paramagnetic charge ordered insulator [8, 14–17]. Below TN the ferromagnetic phase remains but its volume fraction reduces substantially. By way of contrast, in nanocrystalline samples there is a transition directly from the high temperature paramagnetic structure to the ferromagnetic structure at Tc ∼ 250 − 260 K [1, 2, 4, 5]. Essentially the same value of Tc has been reported also in other samples for which no information about grain size is given (e.g. [15, 18, 19]). The ferromagnetic phase remains stable down to low temperatures and there appears to be no evidence for a change to antiferromagnetic order or the development of two phase mixtures. This magnetic and structural evolution is superimposed on the Pnma perovskite structure which has tilted octahedra over the entire temperature interval of interest. The crossover from charge order and antiferromagnetism to ferromagnetism seems also to be typical of the effect of reducing grain size in magnetoresistant manganites more generally (e.g. [4, 6, 20–24]), and cooperative Jahn–Teller distortions become suppressed also in LaMnO3+δ (δ≈0.03) [25].
Changes in bulk elastic moduli, as measured on ceramic samples of La0.5Ca0.5MnO3at frequencies of 0.1–5.1 Hz [26, 27], ∼7 MHz [28, 29] and 10 MHz [27, 30, 31], all show softening from both high and low temperatures towards a single rounded minimum at a temperature between ∼220 and ∼230 K. This pattern appears to be independent of measuring frequency [26, 27] and coincides with steep variations in lattice parameters that are indicative of the charge ordering transition [7, 15, 32]. The transition is also marked by an increase in acoustic attenuation which reaches a peak ∼10 K below the temperature at which the elastic moduli have their minimum values [26, 30, 31]. By way of contrast, there appear to be no obvious variations in acoustic velocities, acoustic attenuation or lattice parameters associated with the antiferromagnetic ordering transition at lower temperatures. Thus it appears that strain/order parameter coupling in the system is dominated by contributions from the Jahn–Teller component of the charge ordering transition [27, 30, 33–36].
The weakness or absence of coupling between antiferromagnetic ordering transition and strain in La1−xCaxMnO3 is confirmed by the lack of variation in lattice parameters or acoustic velocities near TN in samples with x > 0.5 where the charge order and antiferromagnetic ordering transitions are more widely separated during both heating and cooling (e.g. compare lattice parameter and acoustic velocity data of Li et al [33] with Néel point measurements of Pissas and Kallias [10]). In sharp contrast, there is detectable strain coupling associated with ferromagnetic ordering in samples with x < 0.5, though it is quite different in character. For example, the data of Radaelli et al [37] for La0.75Ca0.25MnO3 show a uniform reduction of all three orthorhombic lattice parameters below Tc ≈ 240 K, signifying a volume reduction of ∼0.1% but little or no change in shear strain with respect to the parent cubic structure. This is synchronous with a metal–insulator transition and, although there is a significant elastic anomaly, the pattern is different from that associated with charge ordering. Acoustic velocity data for samples with x = 0.25, 0.3, 0.33 and 0.43 do not show the softening as T → Tc from above which characterizes proximity to a (zone-centre) Jahn–Teller driven instability, though there is stiffening immediately below Tc [38–42]. The peak in acoustic loss is narrower and coincides with the minimum in acoustic velocity in these samples [38, 40, 42] signifying, also, a different loss mechanism.
For the present work, La0.5Ca0.5MnO3 powders of Sarkar et al [2] with different grain sizes were pressed into pellets which, in turn, were used for measurements of elastic and anelastic properties by resonant ultrasound spectroscopy (RUS). In order to distinguish between crystallite size and grain size, the samples have been reanalyzed by x-ray powder diffraction. New magnetic measurements on the RUS samples were obtained so as to allow correlations of anomalies in elastic and magnetic properties directly. Macroscopic strains have been analyzed using lattice parameters for bulk and nanocrystalline samples from Sarkar et al [2] and, for a bulk sample including hysteresis, using the data of Radaelli et al [7].
2. Experimental methods and sample characterization
2.1. Sample preparation
Starting materials for preparation of pellets suitable for elasticity measurements were nano- and micro-crystalline powders of La0.5Ca0.5MnO3 prepared originally for the studies of Sarkar et al [2] and Lahiri et al [6]. Their stoichiometry had been checked by ICPAES and found to have a La : Ca : Mn ratio of 0.507 : 0.495 : 1. Portions of four of the six powders (samples A, B, E and F in table 1 of Sarkar et al [2]) were pressed into pellets using high pressure field assisted rapid sintering (HP-FARS) apparatus following the procedure described by Anselmi-Tamburini et al [43, 44]. This procedure provides cylindrical pellets 5 mm in diameter and 1 mm thick, with masses of ∼0.12 g. Table 1 summarizes the sintering temperatures and pressures used for the pellets, as well as grain sizes of the starting powders specified by Sarkar et al [2].
Table 1. Sintering conditions for pellets prepared for RUS. Values of starting grain sizes are from Sarkar et al [2]; crystallite sizes of the sintered pellets are from x-ray diffraction data collected in the present study.
| Sample ID | Grain size of starting powders (nm) | Average crystallite size of sintered pellets (nm) | Sintering temperature (°C) | Sintering pressure (MPa) |
|---|---|---|---|---|
| A | 15a | 34 ± 1 | 800 | 504 |
| B | 43a | 42 ± 1 | 800 | 489.6 |
| E | 600 | 75 ± 1 | 900 | 518.4 |
| F | 3660 | 136 ± 3 | 900 | 576 |
It was of concern that the crystallite sizes might have been modified by the hot pressing. After completion of the elasticity measurements, therefore, the dense pellets were reground to powder and x-rayed for comparison with the starting powders. A θ–2θ Bragg–Brentano parafocusing PANalytical X'Pert PRO diffractometer, equipped with a multi-channel X'Celerator detector was used (Cu Kα, with λ = 0.15418 nm). Data were collected in the range 5–120° 2θ with a step size of 0.0084° 2θ and a counting time of about 30 s/step. The divergence slit was fixed at 0.5°. Diffraction patterns obtained in this way are illustrated in figure 1 and contain only peaks expected from orthorhombic perovskite. Table 1 gives the crystallite size of the sintered pellets determined by a total pattern refinement using MAUD software [45], which can separate the crystallite size from the RMS-microstrain effect in broadened powder diffraction peaks. The simple isotropic model was used for the evalution of crystallite size. Similar crystallite sizes to those reported by Sarkar et al [2] were obtained for samples A and B but much smaller sizes were obtained for samples E and F. The good agreement for the fine grained samples is due to the fact that the same method was used (i.e. powder diffraction line broadening). However, Sarkar et al [2] used transmission electron microscopy to measure grain size of the coarser samples, and grains observed in this way were presumably composed of aggregates of smaller crystallites or affected by grain mosaicity. The most significant point here is that crystallite sizes remained in the nano range after the hot pressing.
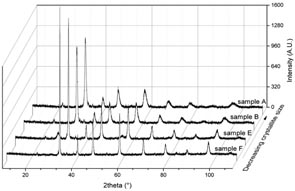
Figure 1. X-ray powder diffraction patterns from reground portions of the four pellets used for RUS measurements.
Download figure:
Standard image High-resolution image2.2. Strain analysis
Differences in lattice parameters between bulk and nano samples of La0.5Ca0.5MnO3 reflect differences in the spontaneous strains associated with octahedral tilting, charge ordering and magnetic transitions. Two characteristic shear strains may be defined in terms of the lattice parameters of the Pnma structure, aPnma, bPnma and cPnma, with respect to the lattice parameter of the cubic reference structure, ao, (following [46–48]):

where the value of ao can be taken as (aPnmabPnmacPnma/4)1/3. Variations of these shear strains as a function of temperature are shown in figure 2 for samples A and F, using original lattice parameter data of Sarkar et al [2]. For comparison, shear strains for bulk samples have been added using the lattice parameters given by Radaelli et al [7]. These reproduce the substantial differences in structural evolution between the nanocrystalline sample A and the more coarsely crystalline sample F already reported by Sarkar et al [2], but also show differences between sample F and the bulk sample of Radaelli et al [7]. In particular, the onset of changes in etx occurs at a lower temperature during heating of sample F than in the bulk sample, and there is an additional anomaly in e4 at ∼130 K. Unpublished high resolution neutron powder diffraction data of Chatterji and co-workers from sample F do not show the anomaly in e4 and show the intensity of antiferromagnetic ordering reflections decreasing to zero at ∼155 K. For present purposes, it is assumed that sample F has properties that are intermediate between the nano and bulk materials, consistent with the new determination of crystallite size as ∼136 nm (table 1).
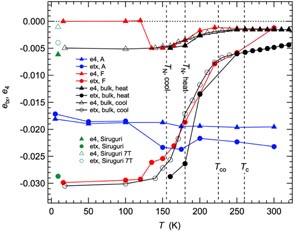
Figure 2. Variation of shear strains, etx and e4, with respect to a parent cubic lattice determined using lattice parameter data for samples A and F from [2] and for a bulk sample from [7]. (The data of [2] were collected during heating). Also shown are values of transition temperatures for bulk samples (TN, Tco) and for nano samples (Tc). Uncertainties propagated from uncertainties in the lattice parameters are estimated as ± ∼0.001. Data shown at 9 K are from lattice parameters of Siruguri et al [49].
Download figure:
Standard image High-resolution imageThe lattice parameter data of Sarkar et al [2] are not of sufficient resolution to determine the evolution of volume strains because they are substantially smaller than the shear strains. Some idea of their likely magnitude and sign is given by data for other sources, however. For Pr0.48Ca0.52MnO3 there is a small but significant positive volume strain of up to ∼0.002 accompanying charge ordering [50]. On the other hand, ferromagnetic ordering in La0.75Ca0.25MnO3 is accompanied by a negative volume strain which, from the data in figure 1 of Radaelli et al [37] is estimated to reach ∼−0.002. The antipathetic relationship between ferromagnetism and charge order/orbital order must at least be enhanced by the opposite sign of these volume strains.
2.3. Magnetic properties
Magnetic properties of the four sintered pellets used for RUS measurements were characterized using a MPMS-XL 7 T Superconducting Quantum Interference Device (SQuID) magnetometer. Many details of this measuring system are given by McElfrish et al [51]. Each sample was held in an arbitrary orientation within the sample chamber and two types of measurements made. Magnetic moments were determined in nominally zero field and in a 5 T field at 0.01 K intervals between 5 and 300 K, during cooling and then heating. The magnetic moment was then measured in hysteresis loops with 0.03 kOe intervals between +3 and −3 kOe at temperatures of 300, 250, 200, 150, 75 and 5 K in a cooling sequence.
Figure 3 shows data for magnetic moment during cooling and then heating in zero field and at 5 T. The magnetic properties of samples A and B are closely similar, consistent with the determination of crystallite size (34 nm and 42 nm, respectively). Both show patterns of evolution expected for a paramagnetic–ferromagnetic transition, with slight hysteresis, and only a further additional small anomaly near 42 K. If the small hysteresis is not due to thermal lag in the instrument, values of Tc for cooling and heating at zero field would be ∼268 and ∼284 K for A and ∼270 and ∼278 K for B, as estimated from the expanded view shown in figure 3(c). Both at zero field and under the influence of a 5 T field, there are irregularities in the magnetic moment at temperatures between 300 and 150 K during cooling but these are not present during heating (figures 3(a) and (b)). Sample F (136 nm) does not show the characteristic pattern of ferromagnetic ordering followed by a ferromagnetic–antiferromagnetic transition reported elsewhere for bulk samples in either zero field or in an applied field (e.g. [1, 12, 37, 52–55]). Instead it appears to have a paramagnetic–ferromagnetic transition near 260 K in zero field (Tc ∼ 257 K during cooling and ∼262 K during heating, as estimated from figure 3(c)), followed by a very obvious hysteresis pattern with limits of ∼45 and ∼155 K which is perhaps analogous to the hysteresis between limits of 125 and 180 K that is attributed to the ferromagnetic–antiferromagnetic transition in bulk samples (e.g. [1, 55]). The characteristic pattern for bulk samples involves lower moments due to the antiferromagnetic structure, however, while sample F has consistently increasing moment with falling temperature. There is a further increase in moment near 42 K, as opposed to the decrease seen in zero field data for samples A, B and E. Sample E (75 nm) has variations different from those of A, B, F, but still with a trend consistent with a paramagnetic–ferromagnetic transition near 270 K in zero field (Tc ∼ 267 K during cooling and ∼275 K during heating, estimated from figure 3). Details of the anomaly near 42 K are considered in section 3.
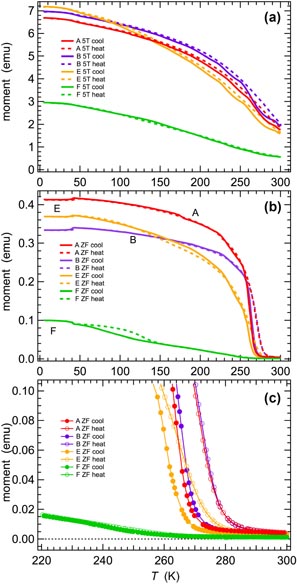
Figure 3. Magnetic moments of the pellets used for RUS measurements, as measured in zero field during cooling and then heating, followed by measurements in a 5 T field, again cooling followed by heating. Note that sample F had about half the mass of samples A, B and E. (c) is an expanded view of (b) in the temperature interval 220–300 K.
Download figure:
Standard image High-resolution imageFigure 4 shows hysteresis curves for samples A, E and F. Data for sample B are not shown as they are closely similar to those of sample A. Both sets are consistent with paramagnetism at 300 K and ferromagnetism at T ⩽ 250 K. Sample F appears to be paramagnetic at 300 and 250 K, but the pattern at 5 K is more nearly typical of ferromagnetism, though saturation magnetization is not reached at 3 kOe. At intermediate temperatures (200, 150, 75 K) the loops also remain open, which is suggestive of metamagnetic transitions and/or the response of a mixture of phases with different magnetic properties. Typical paramagnetic behaviour of sample E is limited to 300 K. At 250, 200 and 5 K the forms of the hysteresis curves are consistent with ferromagnetism, while the loops remain open to high fields at 150 and 75 K.
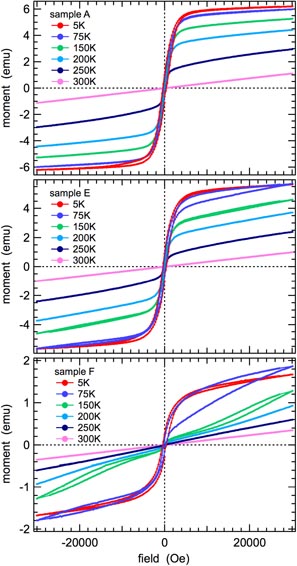
Figure 4. Hysteresis loops for samples A, E and F, measured in steps of 0.03 kOe. Data for sample B (not shown) are very closely similar to those of sample A.
Download figure:
Standard image High-resolution image2.4. Resonant ultrasound spectroscopy
The physics of RUS has been described by Migliori and Sarrao [56], and the Cambridge helium flow cryostat used to collect spectra between ∼5 and 300 K is described in McKnight et al [57]. The hot pressed discs of samples A, B and E (∼0.12 g) were used directly. Pellet F was broken during depressurization and the piece used for RUS measurements was about half of the disc (0.055 g). Each disc was placed with its faces directly in contact with the transducers in an atmosphere of a few mbar helium to allow heat transfer to the sample. Spectra were collected in a sequence of 30 K intervals during cooling from 280 to 10 K, with a 20 min dwell time at each temperature to allow thermal equilibration, followed by heating up to 305 K in 5 K steps with the same dwell time. Pellet F was investigated in more detail in a second run through the ranges 265–190 K (5 K steps during cooling and heating) and 20–60 K (2 K steps during heating). A representative section of the spectra collected during heating is shown in figure 5. Individual spectra contained 65 000 data points in the frequency range 0.05–1.2 MHz and were transferred to the software package IGOR PRO (Wavemetrics) for analysis. Frequency, f, and the width at half maximum height, Δf, of selected peaks were determined by fitting them with an asymmetric Lorentzian function. Acoustic resonances of a small polycrystalline oxide sample are dominated by shearing rather than breathing motions and f2 for the peaks scales closely with the shear modulus in most cases (e.g. [58]). Anelastic loss is characterized in terms of the inverse mechanical quality factor, Q−1, as given by Q−1 = Δf/f.
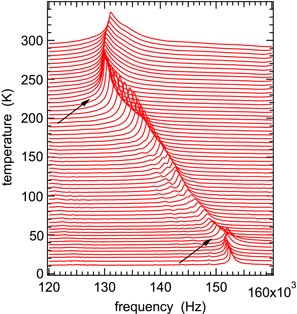
Figure 5. Segments of RUS spectra collected from sample F during heating. The y-axis is amplitude from the detector transducer but the spectra have been offset in proportion to the temperature at which they were collected and the axis then labelled as temperature. Breaks in the evolution of peak positions with temperature, indicated by arrows, occur near 225 and 40 K.
Download figure:
Standard image High-resolution imageIn order to compare the elastic behaviour of separated nanocrystalline grains with that of the hot pressed pellets, the same four starting powders that had been used for the hot pressed pellets were also mixed with CsI powder that had been dried at ∼110 °C. Mixtures of ∼65 wt% CsI + 35 wt% sample powder for B, E and F and ∼84 wt% CsI + 16 wt% powder for sample A were ground together by hand in an agate mortar and pestle and then mechanically pressed in an infrared pellet press to ∼31 MPa. This produced discs 13 mm in diameter, ∼2 mm thick and with mass ∼1.17 g for B, E, F, and ∼1.31 g for A. The discs were found to give measurable resonance spectra when placed with their large flat faces in contact with the transducers. RUS spectra containing 130 000 points in the range 0.05–1.2 MHz were collected in 5 K steps during cooling and heating between 290 and 140 K, with a settle time of 20 min for thermal equilibration at each temperature. As illustrated by a representative portion of spectra from the CsI pellet containing powder of sample F in figure 6, a characteristic feature of all spectra collected in this way is hysteresis, such that the pellet is elastically slightly softer during heating than during cooling. This is believed to be due to some relaxation of grain boundaries between the two phases in the pellets, but does not detract from the internal consistency in the sense that the influence of the sample powder can be clearly seen in both the cooling and heating sequences. Figure 6 shows resonance peaks which have the same break in trend near 225 K that is seen in spectra from the hot-pressed pellets.
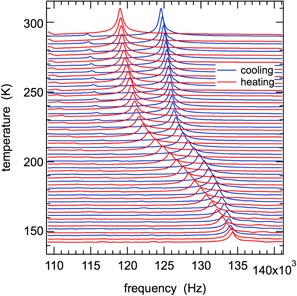
Figure 6. Segment of the RUS spectra collected from a pellet consisting of CsI and powder of sample F, in the proportions given in the text. The y-axis is amplitude from the detector transducer but the spectra have been offset in proportion to the temperature at which they were collected and the axis then labelled as temperature. The same difference between heating and cooling occurs for all pellets prepared in this way but the trend of peak frequencies clearly shows the same break in slope near 225 K as seen in figure 5 for the hot-pressed pellet.
Download figure:
Standard image High-resolution image3. Results
Figure 7 contains data for f2 (left axis) and Q−1 (right axis) extracted from fitting of selected RUS peaks in spectra from the hot pressed pellets. For comparative purposes, f2 values for a given peak have been scaled with respect to the value at ∼290 K. Also shown are data from Zheng et al [30] for the square of shear wave velocities measured at 10 MHz by the pulse-echo technique and from Zheng et al [26] for the shear modulus measured at 1 Hz using the forced vibration method. (Grain sizes were not specified for the samples used in these studies). These have been scaled so as to overlap with the RUS data above Tco, which is taken as the literature value, 225 K. The square of shear wave velocities scales with the shear modulus and resonance frequencies from RUS are expected to be determined predominantly by the shear modulus, so the data should be directly comparable. All show the same softening as Tco is approached from above, followed by stiffening with further decreasing temperature, though the amount of stiffening differs. Data for attenuation of shear waves at 10 MHz [30] are shown as a dotted line, scaled with respect to data for Q−1 just above Tco in the case of sample F. These have a peak in acoustic loss just below Tco that is not reproduced in the RUS data.
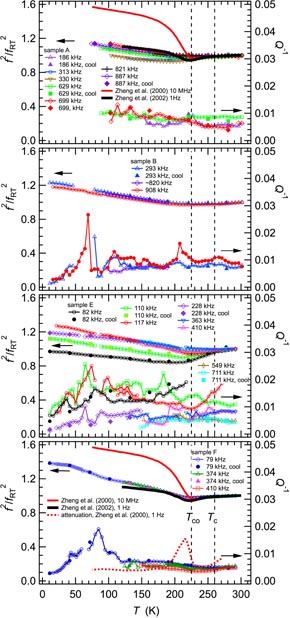
Figure 7. Variations of f2 and Q−1 from selected peaks in spectra from hot-pressed pellets of samples A, B, E and F. The f2 data are all scaled to 1 at ∼290 K. Values of the frequency at room temperature for each resonance peak are indicated in the captions. Data for the velocities of transverse ultrasonic waves at 10 MHz are reproduced from figure 1(a) of [30] and for the shear modulus at 1 Hz from figure 1 of [26]; both sets are also scaled with respect to their values at ∼290 K. Attenuation at 10 MHz [30], scaled with respect to Q−1 data above Tco, is shown in the plot for sample F. Broken vertical lines indicate values of Tco (225 K) and Tc (260 K) taken from literature.
Download figure:
Standard image High-resolution imageStiffening of sample F below Tco is less than shown by the 10 MHz ultrasonic data but comparable in magnitude to the stiffening reported for 1 Hz. The f2 data have breaks in slope near 90 and 40 K and little, if any, hysteresis between cooling and heating. Q−1 has a very slight increase below Tco that appears to be reproducible between separate resonance peaks. There is then a maximum in Q−1 at ∼85 K and a second small peak near 40 K. The increase in f2 and the loss peak at ∼85 K have the form expected of a typical Debye-like relaxation process. The break in slope of f2 near 40 K involves a reduction in the rate of stiffening with falling temperature, however, which is more likely to be indicative of strain coupling to some structural, magnetic or electronic transition. This differs from the peak in attenuation of transverse ultrasonic waves at 10 MHz which occurs immediately below Tco. Zheng et al [26] do not show acoustic loss behaviour specifically for a sample with x = 0.5, but their data for x = 0.55 and x = 0.8 show a loss peak immediately below Tco which reduces in magnitude steeply between 0.1 and 5 Hz.
Stiffening below Tco in samples A and B is markedly different from that shown by sample F. There is a rounded minimum slightly below Tco and then a slight and approximately linear recovery with falling temperature. Q−1 values are generally higher for all resonances and again there is no reliable evidence for changes in acoustic loss between 290 and 90 K. It was not possible to follow resonance peaks down to the lowest temperatures in spectra from sample A but for sample B there is definitely a temperature interval between ∼80 and ∼50 K where the resonance peaks became significantly broader. Q−1 values decreased below ∼50 K but did not show overt evidence for any anomaly near 40 K. The evolution of f2 for sample E is more nearly the same as that of sample F than of samples A and B, in which the data show a more distinct break in slope at Tco.
It is not clear whether there is any dispersion with respect to frequency. f2 data for different resonance peaks in the case of sample F scale closely together, consistent with their common dependence predominantly on the shear modulus. Variations of f2 for different peaks in spectra from samples A and E show more spread below Tco when they are scaled to the same room temperature values and the anelastic losses are higher, but there does not seem to be a systematic trend of increasing or decreasing stiffness with measuring frequency. At least part of the differences may be due to differences in the proportion of a breathing component, dependent on the bulk modulus, involved in the relevant normal modes of the samples. Only in the case of sample E does there appear to be an anomaly in the vicinity of Tc (82 and 110 kHz modes).
Figure 8 shows f2 and Q−1 data from the CsI pellets. f2 values for a single peak from each set of spectra collected during heating, scaled with respect to their values at ∼290 K. CsI by itself has a linear reduction in the effective shear modulus with increasing temperature and the pellets containing ∼1.17 g of the powders of samples B, E and F, ∼1.31 g of the powder of sample A have trends which deviate from this. The form of the deviations closely matches the patterns seen for the hot-pressed pellets, again indicating that the hot pressing process does not modify the elastic properties significantly. In particular, the pellet containing sample A gives a small and rounded degree of softening with respect to CsI alone. The pellet containing sample B displays the same form of softening, while the pellets containing samples E and F give relative softening and stiffening with an obvious break in slope in the vicinity of Tco. The loss behaviour must depend, in part at least, on grain contacts in the CsI pellets but the temperature dependence of Q−1 down to ∼140 K does not show any gross features, apart from a slight increase immediately below Tco in the case of samples E and F.
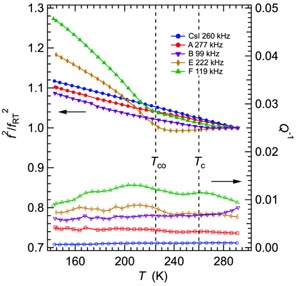
Figure 8. Data extracted from fitting of selected peaks in spectra collected during heating from ∼140 K for a pure CsI pellet and pellets containing mixtures of CsI and sample powder. f2 values are shown scaled with respect to their values at room temperature and the actual room temperature frequencies are given in the legend.
Download figure:
Standard image High-resolution imageFigure 9 shows details of anomalies in magnetic and acoustic properties at temperatures close to 40 K. The moments of A, B and E in zero field show a decrease with falling temperature that differs by ∼3–5 K between heating and cooling. For sample F there is little or no hysteresis, the step is of increasing rather than decreasing moment with falling temperature, and there is a distinct peak in Q−1. If there is an anomaly in the acoustic loss for the other samples it is below the level of noise in data. At 5 T, there is still an anomaly in moment near 40 K but it is more nearly in the form simply of a break in slope. There appears to still be a hysteresis in the data for A and B a few degrees above this, however.
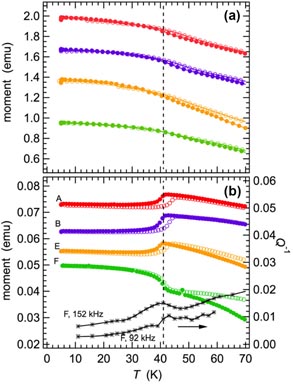
Figure 9. Details of magnetic moment (from figure 3) and Q−1 (sample F, black stars) in the vicinity of 40 K. The magnetic moment data have been shifted along the y-axis by arbitrary amounts to allow easy comparison between them. Filled symbols are data collected during cooling; open symbols represent data collected during heating. The vertical dashed line has been put at 41 K. (a) 5 T. (b) Zero field. In zero field, the moments for samples A, B and E have a rounded step with hysteresis, while for sample F the hysteresis is much less, the change in magnitude is opposite in sign and the anomaly is accompanied by a peak in acoustic loss. In a 5 T field, the rounded step with hysteresis still exists for samples A and B but the moment decreases rather than increases with increasing temperature. There is still a slight break in slope and/or hysteresis for samples E and F at 5 T.
Download figure:
Standard image High-resolution image4. Discussion
The working hypothesis for the present study was that reducing grain size to the nano scale for materials with structural phase transitions leads, primarily, to suppression of macroscopic strain and that this will be evident from suppression of elastic anomalies. In the case of quartz, a single order parameter gives rise to a co-elastic structural phase transition and the outcome is expected to be a reduction in the magnitude of the accompanying elastic softening. The onset of this occurs in ceramic samples with grain sizes of ∼50 and ∼65 nm [59]. For La0.5Ca0.5MnO3 the change from elastic properties which are similar in form to those of a bulk sample also occurs between ∼75 nm (sample E) and ∼40 nm (sample B). However, the transformation behaviour of La0.5Ca0.5MnO3 is more complex than that of quartz because of the involvement of multiple order parameters, each of which has the capability to couple separately with strain.
4.1. Strain/order parameter coupling
As set out in detail in Carpenter et al [50, 60], with respect to Pnma as the parent space group the order parameter for the commensurate structure of half doped manganites transforms as the irreducible representation (irrep) X1. This has two components, such that (a,0) gives the P21/m structure and (a, a) gives Pnm21. The transition would be improper ferroelastic or co-elastic, respectively. However, treatment in terms of a single order parameter conceals the separate contributions which might develop from charge ordering, cooperative Jahn–Teller distortions and octahedral tilting. With respect to a parent cubic structure with space group Pm
 these transform as Σ2 (charge order),
 and
and
 (cooperative Jahn–Teller),
 and
and
 (octahedral tilting). Shear strains etx and e4 couple with each order parameter component, q, as set out in equations (10) and (11) for Pnm21 in Carpenter et al [50]. Coupling of etx with the
order parameter is bilinear, i.e. with the form λetxq where λ defines the coupling strength, and the other couplings are linear quadratic, i.e. λ eq2. With respect to anomalies of shear elastic constants, the linear-quadratic contributions will give a stepwise softening below the transition point (improper ferroelastic or co-elastic), while the bilinear term will give non-linear softening as the transition point is approached from both above and below (pseudoproper ferroelastic) [61–64]. From figure 2 it is clear that the dominant strain in coarse grained samples is etx and from figure 7 it is clear that the dominant softening mechanism has the form expected for a pseudoproper ferroelastic transition. The dominant spontaneous strain must therefore be due to the bilinear coupling between etx and the
order parameter which gives elastic softening of the form
(octahedral tilting). Shear strains etx and e4 couple with each order parameter component, q, as set out in equations (10) and (11) for Pnm21 in Carpenter et al [50]. Coupling of etx with the
order parameter is bilinear, i.e. with the form λetxq where λ defines the coupling strength, and the other couplings are linear quadratic, i.e. λ eq2. With respect to anomalies of shear elastic constants, the linear-quadratic contributions will give a stepwise softening below the transition point (improper ferroelastic or co-elastic), while the bilinear term will give non-linear softening as the transition point is approached from both above and below (pseudoproper ferroelastic) [61–64]. From figure 2 it is clear that the dominant strain in coarse grained samples is etx and from figure 7 it is clear that the dominant softening mechanism has the form expected for a pseudoproper ferroelastic transition. The dominant spontaneous strain must therefore be due to the bilinear coupling between etx and the
order parameter which gives elastic softening of the form

 is the transition temperature for a transition driven by the
order parameter and is related to the unrenormalized critical temperature TcΓ according to (from [60])
is the transition temperature for a transition driven by the
order parameter and is related to the unrenormalized critical temperature TcΓ according to (from [60])

In equations (3) and (4), λ is the coefficient for the bilinear coupling term, a is the coefficient for the second order term in a Landau expansion and
 is a shear elastic constant for the cubic parent structure without influence from the phase transition. The shear modulus depends also on other shear elastic constants, specifically C44 in the case of a cubic phase, but the bulk modulus is expected to display a step wise softening due to linear quadratic coupling of volume strain with any of the order parameters, as shown schematically in figure 1 of Carpenter et al [60]. Equation (4) has the same form as derived from consideration of Jahn–Teller theory, and softening of the shear modulus above Tco has been used to estimate a value of
 for La0.5Ca0.5MnO3 [27].
The strain evolution and elastic properties obtained by RUS for the incommensurate structure of La0.5Ca0.5MnO3 are similar in form to those previously obtained for Pr0.48Ca0.52MnO3, which has a nearly identical incommensurate structure stable below ∼235 K [65–67]. Comparison of figure 7 of Carpenter et al [50] with figure 2 of the present work shows that values of |etx| for bulk samples increase by ∼0.025 through Tco, and | e4| changes by ∼0.003 in both cases. This implies that the strength of coupling between shear strains and the Σ2,
,
,
and
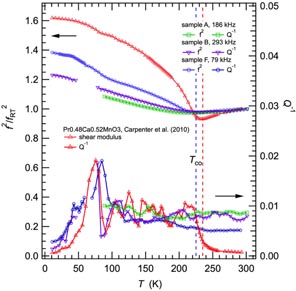
order parameter components is broadly similar, if not the same, for bulk samples of both materials. Data for the shear modulus and Q−1 are reproduced in figure 10 to show that, while the form of the elastic anomaly in Pr0.48Ca0.52MnO3 is the same as of f2 for sample F, the magnitude of softening as the transition is approached from above is less, as is the recovery below Tco. This is consistent with a larger value of
 (57 ± 24 K) estimated by applying equation (4) to the data for Pr0.48Ca0.52MnO3 [60], as opposed to 2 K referred to above for La0.5Ca0.5MnO3. If the coupling strength (λ) is about the same, it follows that the effective values of a and/or
in equation (4) would be larger. In other words, replacing Pr by La may cause the entropy associated with the Jahn–Teller component of the transition and/or the bare elastic constants to increase. This remains somewhat speculative, however, because although values of the shear modulus reported by Zheng et al [26]. are comparable with those obtained here, the ultrasonic data of Zheng et al [30]. show a much steeper recovery below Tco and are rather similar to those of Pr0.48Ca0.52MnO3. It is possible that data for the elastic properties of sample F are not fully representative of those of a bulk sample of La0.5Ca0.5MnO3.
(57 ± 24 K) estimated by applying equation (4) to the data for Pr0.48Ca0.52MnO3 [60], as opposed to 2 K referred to above for La0.5Ca0.5MnO3. If the coupling strength (λ) is about the same, it follows that the effective values of a and/or
in equation (4) would be larger. In other words, replacing Pr by La may cause the entropy associated with the Jahn–Teller component of the transition and/or the bare elastic constants to increase. This remains somewhat speculative, however, because although values of the shear modulus reported by Zheng et al [26]. are comparable with those obtained here, the ultrasonic data of Zheng et al [30]. show a much steeper recovery below Tco and are rather similar to those of Pr0.48Ca0.52MnO3. It is possible that data for the elastic properties of sample F are not fully representative of those of a bulk sample of La0.5Ca0.5MnO3.
Figure 10. Comparison of RUS results from the present study with those of Carpenter et al [60] for Pr0.48Ca0.52MnO3.
Download figure:
Standard image High-resolution image
Comparison of Q−1 in figure 10 shows that a common feature for all the samples is the increase in loss below ∼100 K. The peak in Q−1 at ∼75 K for Pr0.48Ca0.52MnO3 was tentatively ascribed to a freezing process with an activation energy of ∼5–10 kJ mol−1 which might be related the motion of polarons as part of the response of the incommensurate structure to the application of external stress [60]. Essentially the same loss peak appears to occur at ∼85 K in data from sample F and, even though Q−1 variations are not constrained, there is an increase in loss through the same temperature range for the other samples of La0.5Ca0.5MnO3. However, two notable differences remain. Firstly, the 40 K anomaly is seen only in the data for La0.5Ca0.5MnO3. As Pr0.48Ca0.52MnO3 is purely antiferromagnetic at low temperatures, it follows that this anomaly is due to the ferromagnetic phase of La0.5Ca0.5MnO3. Secondly, Q−1 at T > Tco drops to low values for Pr0.48Ca0.52MnO3 but remains high for La0.5Ca0.5MnO3, signifying that some degree of relaxational disorder with strain coupling remains at high temperatures in hot pressed pellets of the latter.
Suppression of the changes in shear strain at crystallite sizes of ∼30–40 nm is accompanied by the expected reduction in the magnitude of the recovery of the shear modulus below Tco but not by complete elimination of the elastic anomaly. Softening as T → Tco from above appears to remain almost the same but recovery occurs in the form of a broad, rounded minimum rather than the concave-down form expected for pseudoproper ferroelastic behaviour. The macroscopic shear strain etx arising from coupling with the
order parameter is suppressed by reducing grain size, but some local ordering apparently still remains and a convenient analogy is perhaps with the difference between a ferroelectric transition and freezing of dynamical polar nano regions in a relaxor ferroelectric. The signature of the latter with respect to strain and elastic properties is a frequency-dependent minimum in the elastic constants above the freezing point and Vogel-Fulcher dynamics through it. This is seen in RUS data for Pb(Mg1/3Nb2/3)O3, for example [68]. There are hints in the present data for samples A and B of dispersion with respect to resonance frequencies, such that the same may apply also to La0.5Ca0.5MnO3, but the quality of the data is not quite sufficient to determine this definitively. Evidence of local Jahn–Teller distortions of MnO6 octahedra in nanocrystalline grains is provided also from XAFS investigation of sample A by Lahiri et al [6].
4.2. Magnetoelastic behaviour
Variations in elastic properties of the hot pressed pellets appear to be the same as for the powders pressed into pellets with CsI, suggesting that the measured elastic properties are intrinsic to the individual grains. There is, however, some contrast in magnetic properties between the pellets produced by hot pressing for the present work relative to those reported by Sarkar et al [2] for pellets produced by sintering at one atmosphere. The magnetic moment shown in figure 8 of Sarkar et al [2] for F increases below ∼250 K, due to ferromagnetic ordering, followed by a decrease with hysteresis below ∼200 K characteristic of the ferromagnetic–antiferromagnetic transition. Data for the pellet of F shown in figure 3 show a steady increase in magnetic moment below ∼260 K but no further reduction and a hysteresis interval at lower temperatures. The difference must be due to near surface effects when grains are in close proximity, since hot pressing will produce a denser ceramic with a higher proportion of grain boundaries in close contact.
There are no elastic anomalies in data collected above ∼40 K from the hot pressed pellets which correlate with changes in magnetic moment shown in figure 3 or from the CsI pellets which correlate with changes in magnetic moment shown in figure 8 of Sarkar et al [2]. This confirms the conclusion from the incommensurate structure of Pr0.48Ca0.52MnO3 that coupling between shear strain and the magnetic order parameter is weak.
Magnetic ordering in samples A, B and E is predominantly ferromagnetic. In detail the transition from para- to ferromagnetism in the hot-pressed pellets occurs near 270 K, with first order character implied by the hysteresis between heating and cooling (figure 3(c)). This mirrors the first order character of the paramagnetic–ferromagnetic transition seen in bulk samples of La0.7Ca0.3MnO3 (e.g. [69–71]), but there are contrasting features as well. Most notably, a bulk sample of La0.7Ca0.3MnO3 does not show the elastic softening as T → Tc from above and there is a steep increase in stiffness at the transition point [69]. The same pattern of stiffening is seen for both longitudinal and transverse acoustic waves in La0.67Ca0.33MnO3 [38, 39] and resembles the pattern expected from biquadratic coupling of strain with the magnetic order parameter (λe2m2), i.e. stiffening (or softening, depending on the sign of the coupling coefficient, λ) which scales with m2 as seen in the case of YMnO3 [72]. This difference reinforces the view that the elastic properties of nanocrystalline La0.5Ca0.5MnO3 as a function of temperature are not determined by the magnetic transition but are indicative of local ordering of Jahn–Teller distorted octahedra. There are small irregularities in the temperature dependence of magnetic moments measured during cooling in a 5 T field—suggesting that the ferromagnetic ordering is not necessarily homogeneous over the entire temperature interval between ∼40 and ∼270 K (figure 9 shows the data up to 70 K).
4.3. Low temperature anomalies
There are a number of reports of changes in magnetic structure of half doped manganites at low temperatures. For example, a peak in ac magnetic susceptibility at 41 K in Pr0.5Ca0.5MnO3 has been explained in terms of a reentrant spin glass transition that leads to a low temperature state with ferromagnetic and spin glass clusters in an antiferromagnetic matrix [73]. The reported frequency dependence is rather slight, such that the peak shifts by only 0.2 K between 0.01 and 3 kHz. Doping of La1−x Cax MnO3 with Y also leads to a frequency dependent anomaly in the magnetic susceptibility near 40 K. In this case the shift in maximum susceptibility is several K for a frequency change of 0.001 to 1 kHz [74, 75]. Glass-like arrested states have also been proposed for bulk samples of La0.5Ca0.5MnO3 at low temperatures but the distinct anomaly in magnetic behaviour near 35 K was ascribed to a change from metastable ferromagnetic order to equilibrium antiferromagnetic order [49, 76, 77]. In nanowires of La0.5Sr0.5MnO3 a magnetic anomaly at 42 K was attributed to freezing behaviour of surface spins [78]. By way of contrast, the changes in magnetic moment near 40 K shown in figure 9 perhaps more closely resemble the pattern expected for a first order transition between structures with different magnetic ordering states. In the case of F, a peak in acoustic loss measured at ∼150 kHz occurs at the same temperature as the anomaly in dc magnetic moment, ruling out the possibility of any substantial dispersion with respect to frequency that would be expected for a freezing process. In this case, the data for f2 just show a break in slope rather than an increase with falling temperature that would signify a classical Debye loss mechanism of the type well illustrated by the data for f2 and Q−1 near 85 K. There must be some strain contrast across the transition and the loss mechanism perhaps involves motion under stress of interfaces between coexisting phases which also have slightly different elastic constants.
From the hysteresis curves in figure 4 it is clear that sample A (and B) has predominantly ferromagnetic structures above and below 41 K, so the transition is between one ferromagnetic structure and another. Changes in magnetic moment across the transition presumably reflect some or all of differences in moment, changes in the proportion of any relict antiferromagnetic moment and changes in domain structure. These are less obvious in the 5 T data (figure 9), which show only a break in slope of the moment at ∼40 K, presumably reflecting saturation magnetization.
Not all samples of La0.5Ca0.5MnO3 seem to show the same behaviour at low temperatures. For example, there are anomalies similar to those reported here near 40 K in the magnetic data of Levy et al [1] but not in the data of Sarkar et al [2], Rozenberg et al [3], Jirak et al [4] or Freitas et al [55], Chen et al [79] found an anomaly in the evolution of the longitudinal modulus at ∼50 K which is similar to that observed here in f2 for acoustic resonances, and more marked changes at the same temperature in samples with higher Ca-contents. Several possible explanations may be offered but this issue is not resolved here. Firstly, some impurity phase(s) might be present in some samples. For example, Mn3O4 has prominent magnetoelastic transitions near 40 K (e.g. [80, 81]), though there does not appear to be evidence for its presence in powder diffraction patterns. Secondly, there could be differences of stoichiometry. For example, increasing the number of oxygen vacancies causes an anomaly to appear near 40 K in zero field cooled magnetic moments, in comparison with a stoichiometric sample with three oxygen atoms per formula unit [19]. However, the reduction in oxygen content is also accompanied by a reduction in the magnetic ordering temperature below 240 K and, in the present study at least, it is has been found that the 40 K anomaly occurs in samples with Tc ∼ 260 − 280 K. Sarkar et al [2] reported that their samples all had some oxygen deficiency, ∼La0.5Ca0.5MnO2.98 for the finest grain sizes and slightly greater non-stoichiometry for the coarsest sample, but it is possible that this was changed in the hot-pressing process. Finally, grain size effects, particularly with respect to magnetism, depend substantially on the changing ratio of material in the surface to material within the bulk in the usual way, but these can be modified by interactions between grains. Samples with higher density, such as produced by hot pressing, have a higher proportion of welded grain boundaries across which there should be relatively strong magnetic interactions, giving rise to the possibilities of changing patterns of stability in nanocrystalline samples.
4.4. Heterogeneity and local structure in nanocrystals
Jahn–Teller and charge ordering are suppressed both by application of a magnetic field and by reducing grain size, but the resulting ferromagnetic phases are not the same with respect to their macroscopic strain. It follows that other contributions to the structural state also cannot be the same, in particular because shear strains are coupled to octahedral tilting. Figure 2 contains values for symmetry-adapted shear strains calculated from lattice parameters in Siruguri et al [49] for a bulk sample measured at 9 K in zero field and in an applied field of 7 T. In zero field the sample is antiferromagnetic, with strains that have values which are indistinguishable from those calculated from the original data of Radaelli et al [7]. At 7 T these become more typical of an orthorhombic perovskite with distortions from cubic lattice geometry associated only with octahedral tilting. In particular, etx is nearly 3% for the structural state with cooperative Jahn–Teller distortions and only a few ‰ when this is suppressed. The comparison is essentially the same as between Pr0.52Ca0.48MnO3 and SrZrO3 in Carpenter et al [50]. On the other hand, values of etx and e4 for the ferromagnetic nanocrystalline sample are ∼2% and show no evidence of changes through Tco or Tc (figure 2). A homogeneous ferromagnetic state with no Jahn–Teller ordering can be represented by La0.75Ca0.25MnO3 for which lattice parameters of Radaelli et al [37] give etx and e4 values of ∼−0.003. This is again consistent with the effects of coupling between strain and octahedral tilting alone. The primary data show that the main strain associated with ferromagnetic ordering is a volume strain which reaches a maximum value of ∼−0.002 in this case. Large shear strains in nanocrystalline sample of La0.5Ca0.5MnO3 are presumably due to octahedral tilting alone, but the octahedra must on average be more distorted than at compositions where charge order/orbital order does not develop.
Comparison above of the elastic properties through the ferromagnetic transition in samples A and B with the more typical effects of magnetoelastic coupling seen in La0.7Ca0.3MnO3 and La0.67Ca0.33MnO3 also confirms that the structural state of the nanomaterials is somehow different with respect to strain. The minimum in shear modulus near Tco seen in the data for samples A and B has been interpreted here as indicative of local ordering of Jahn–Teller distorted octahedra, but without the development of additional macroscopic strain. This appears to be analogous to the suppression of strain accompanying tilting due to the introduction of A-site cation/vacancy disorder in the perovskite La0.6Sr0.1TiO3. Local heterogeneous strain fields arising from the disorder hinder the development of a coherent macroscopic strain but do not suppress the tilting [82]. The length scale of these local heterogeneities is likely to be comparable with that seen associated with replacing one cation by another of different size, i.e. ∼ 10–20 Å [83]. If, as is proposed and raised as a possibility by Sarkar et al [2], nanocrystals of La0.5Ca0.5MnO3 contain heterogeneous shear strains locally within them, they would not be expected to show identical physical properties to thin films in which a homogeneous strain is imposed by the substrate.
5. Conclusions
A fundamental feature of manganite perovskites is multiscale inhomogeneity, and a fundamental part of the tendency for inhomogeneity to develop relates to strain (e.g. [84, 85]). This reflects coupling of order parameters to strain in materials with multiple instabilities where the instabilities are mutually exclusive. Magnetic ordering in these materials is only weakly coupled with shear strain while cooperative Jahn–Teller distortions give large shear strains and pseudoproper ferroelastic behaviour. It is argued here that suppression of shear strains in nanocrystalline manganites is responsible for the suppression of Jahn–Teller related ordering and that this leads to a different local structural state than when ferromagnetism is induced by application of an external magnetic field. It could be argued that ferromagnetism occurs simply because ferroelastic strain relaxation forms an essential contribution to the stability of the cooperative Jahn–Teller distortions but is suppressed at grain sizes of less than ∼50 nm. It has also been argued that the pattern of elastic softening which remains for the nanocrystalline samples implies that the local tendency to develop Jahn–Teller distortions is not suppressed. The possibility that this becomes a freezing process, rather than a discrete phase transition, could be tested by looking for frequency dependence of the temperature at which the shear modulus has a minimum value. The physical properties of manganite perovskites can be tuned or manipulated through control of strain—by imposition from a substrate, by choice of grain size or by magnetoelastic effects from an imposed magnetic field. Each of these methods produces subtle differences in structural state, however.
Acknowledgments
RUS facilities were established in Cambridge through a grant from the Natural Environment Research Council of Great Britain (NE/B505738/1), and current work is supported by the Engineering and Physical Sciences Research Council to MAC (EP/I036079/1). Contributions by TS and AKR were undertaken under sponsored project 'UNANST', DST. Ilenia Tredici, University of Pavia, is gratefully acknowledged for the sintering of the coarsest sample.