
Abstract
The sequence of phase transitions of crystalline silica has been probed by infrared emission spectroscopy. The lattice dynamics, deeply impacted by the low frequency dynamic disorder, exhibit with increasing temperature signs of inhomogeneous broadening of the symmetry-allowed normal modes. High frequency supplementary components are also activated. The analysis with a causal Voigt dielectric function model within the framework of hard mode spectroscopy allowed a fine characterization of solid–solid phase transitions. We also report experimental evidence showing that the occurrence of the intermediate ill-defined region above 1300 K is concomitant with the reactivation of the low frequency dynamic disorder; a behavior change that on the way explains the appearance of the negative thermal expansion regime.
Export citation and abstract BibTeX RIS
1. Introduction
The simultaneity of chemical simplicity and behavioral complexity makes crystalline silica a very fascinating system. As shown in the extensive literature on the subject, one explanation of the richness of atypical properties and various polymorphic structures certainly lies in the network structure, built with corner-sharing silicate tetrahedra and their peculiar dynamics. The sequence of phase transitions from alpha quartz to high-temperature beta cristobalite is still under question since the existence of the intermediate tridymite phase, normally appearing above 1143 K, seems to require the presence of impurities. At least, the very long transformation periods appear to be due to extreme sluggishness [1]. If pure quartz is heated from room temperature to its liquid state in a few hours, the beta quartz to beta tridymite phase transition is skipped and the following sequence is observed: (a) neglecting the intermediate stable incommensurate phase, which exists only in a very narrow temperature band (1.3 K [2, 3]), alpha quartz transforms into beta quartz at 847 K (b) some authors report the transformation of beta quartz at an ill-defined state around 1300 K [1] (c) at 1743 K, beta cristobalite appears and remains stable up to the liquid phase, which occurs at 1999 K [4]. It is now well established that the symmetry of the high-temperature polymorphs of SiO2 results from a dynamic average, but their microscopic nature has been the subject of decades of debate and remains a controversial problem until today. Some authors have explained the average structures on the basis of spatial domain models [5–7]. In the case of beta quartz, the coexistence of two domains corresponding to Dauphine twinning of alpha quartz is invoked [8]. Other reported results show that these phases are better described by pure dynamic fluctuations supported by a large population of rigid unit modes (RUM [9–12]). The latter proposition seems to be the current mainstream thinking and was recently validated by a direct comparison of the merits of the two approaches in the reproduction of the experimental pair distribution function of beta cristobalite [13]. But the most important thing is the existence of a low frequency dynamic disorder that impacts deeply the properties of this material and that the classical soft-mode picture is too simplistic to completely account for the phase changes of this system [14, 15]. Among the quantities that suffer from the presence of dynamic disorder, one can cite the piezoelectric property of alpha quartz-based resonators, whose mechanical quality factor was found to degrade in the alpha phase well below the alpha to beta transition. The gradual loss of piezoelectric response has been linked to the increase of the structural disorder in alpha quartz found by total neutron scattering measurements. Reverse Monte Carlo modeling indicates also that between 473 and 673 K the local disorder in the instantaneous structure of alpha quartz becomes comparable to that of beta quartz [16]. The onset of this thermally induced disorder is also apparent from heat-capacity measurements, in which a significant disorder-induced pretransitional effect begins at around 400 °C and is observed by a marked rise in Cp.
The presence of fluctuations in a periodic lattice structure of static or slowly evolving nature (in comparison with the phonon characteristic times), has a deep impact on its vibrational dynamics: localization and inhomogeneous broadening, for example. Selection rules may break and lead to the appearance of components normally forbidden by the average lattice symmetry. The analysis of these features has proven to be very effective in material characterization at short and medium length scales. For instance, under certain conditions high frequency stretching modes can act as Einstein oscillators and probe local properties, as demonstrated by the hard mode spectroscopy framework [17]. Quantitative information on the disorder can also be retrieved [18, 19]. In the high temperature phases of the silica system, the local fluctuations are dynamic and correspond to Fourier superpositions of the planes of RUM phonons. Since the characteristic time of these fluctuations is several orders longer than those of the high frequency internal modes of the silicate tetrahedron, it is anticipated that the considerable orientational disorder of the SiO4 tetrahedra induced by the large amplitude of these low frequency modes has a similar impact to that of static topological disorder. Spectroscopic data for this system may include such kinds of information, so this is one of the reasons that motivated the present investigation by infrared emission spectroscopy. Additionally, this technique is a must for the retrieval of the optical functions in extreme conditions of temperature. Works on vibrational properties have been already published [20–25], but the reported experimental results are not enough to capture the whole behaviour of this system, particularly in the high temperature range for which the literature is scarce. In this paper we report for the first time a set of normal spectral emittance spectra acquired for their E symmetry from room temperature up to the liquid state. The retrieval of the dielectric function by using different kinds of physical models confirms the richness of the embedded information that can be extracted from this type of spectrum. The results are discussed in the context of the phase transitions and the high temperature ill-defined states that have recently emerged in the literature.
2. Experimental procedure and setup
All the measurements were made on a (5 × 5 × 1 mm3) quartz plate of optical grade quality (2 sides EPI polished) with an orientation that corresponds to a z-cut. The sample provided by MTI Corporation was elaborated by using the hydrothermal growth method and its purity was evaluated to be of 99.99 weight percent. The plate was used to acquire the normal spectral reflectivity R at room temperature from which the normal spectral emissivity E was obtained by applying Kirchhoff's law for opaque materials:

The hotter emissivity spectra were acquired with a homemade infrared emissometer including two Bruker spectrometers, a Vertex 80V working under vacuum and a dry air purged Vertex 70. The normal spectral emissivity spectra were computed by using the three interferograms method [18] after acquiring the fluxes emitted by the sample and that of a blackbody reference furnace and correcting them by removing the contribution of the parasite background radiation. All the measurements were made with an instrumental resolution of 4 cm−1. The low wavenumber part of the spectra below 500 cm−1 was acquired with the Vertex 80V spectrometer equipped with a liquid He cooled bolometer and a multilayer beam splitter. Higher frequencies were obtained on the Vertex 70 with a DTGS/KBr detector and a Ge/KBr beam splitter. Heating was performed with a Coherent K500 CO2 laser; two beams of equal power impact both sides of the sample to minimize thermal gradients. Finally, the use of 1 mm diameter apertures enabled us to only acquire fluxes originating from a disk area with a homogeneous temperature. Internal calibration of the emissometer and comparison with results obtained by using the indirect method of emissivity measurement, show that the uncertainty of measurements is below 2%.
3. Theoretical background
3.1. Spectra analysis
Normal spectral reflectivity and emissivity of opaque materials are directly related to the dielectric function ε via the Fresnel relation:
Most of the published reflectivity results on quartz were fitted with three or four parameter Lorentz models
Where 
 and
and  are the dielectric contribution, the phonon wavenumber and damping, respectively, of the jth tranverse optical phonon in the three-parameter model.
  and
and  are the phonon wavenumber and damping linked to the jth longitudinal optical phonons of the four-parameter model.
  represents the high frequency electronic contribution to the dielectric function. These models were developed to reproduce the infrared response of the lattice dynamics of crystalline materials. The three-parameter model works well on materials exhibiting only narrow reflectivity bands. Spectra of crystals with wider bands are better described with the four-parameter model that allows us to take into account different transverse and longitudinal phonon damping (homogeneous band broadening). A drawback of both Lorentz models relies on their inability to reproduce in a quantitative way the response of disordered materials, such as glasses. It is well known that this kind of compound exhibits absorption bands with Gaussian profiles, induced by strong inhomogeneous broadening, due to structural disorder that cannot be satisfactorily reproduced with Lorentzian contributions [19]. Crystals exhibiting dynamic disorder, like beta quartz, are somewhere between these two extremes of structural order and require use of the more versatile dielectric function models which are able to take into account both the natural line-width of the vibrational motions (homogeneous broadening) and the inhomogeneous broadening induced by dynamic disorder.
In this work we have used a dielectric function model based on Voigt functions that intrinsically includes the effect of both homogeneous  and inhomogeneous
  broadenings:
The causal Voigt profile  , defined by the convolution of Gaussian and Lorentzian functions, with full width at half maximum (FWHM) values of
  and
and  , is given by the following expressions, which include also an amplitude parameter
 and the peak position wavenumber

 is the Voigt function,
 ![$\Re \left[z\right]$](https://content.cld.iop.org/journals/0953-8984/26/25/255402/revision1/cm495697ieqn015.gif) means the real part of the complex number z,
means the real part of the complex number z,  designates the Faddeeva function,
  is the complementary complex error function and
  is the scaled complementary error function of the real argument
  . Several accurate numerical algorithms for the evaluation of the Faddeeva and the complementary error functions are presented in the literature [26–28] and open source codes are available [29].
The area  associated to
  can be computed by using the following expression:
and its FWHM  is given by:
where  is the inverse function of
  An algorithm and the associated C++ code for the computation of
  are reported in the appendix
From the above expressions, the contribution  to the imaginary part of the dielectric function is:
The corresponding contribution  to the real part of the dielectric function is related to the imaginary part by the Kramers-Kronig relations that lead to:
In the expression, ![$\Im \left[z\right]$](https://content.cld.iop.org/journals/0953-8984/26/25/255402/revision1/cm495697ieqn028.gif) means the imaginary part of the complex number z. A representation of this dielectric function model containing a single causal Voigt component with identical Lorentzian and Gaussian broadenings (
means the imaginary part of the complex number z. A representation of this dielectric function model containing a single causal Voigt component with identical Lorentzian and Gaussian broadenings ( ) is reported in figure 1. In the illustration the results obtained for the classical Lorentz model (equation (3)) for an absorption profile having the same amplitude and a FWHM
  equal to that of the Voigt absorption profile
  is also reported for comparison. As shown in the frame at the bottom of the figure, the small differences mainly visible in the wings of the absorption bands (
 ) have a significant impact on the emissivity response. The reflection band is larger for the Voigt model, but its contribution to the static dielectric constant is lower, which also leads to higher emissivity at low wavenumbers. This high sensitivity of emissivity to the wings of the absorption bands represents thus a powerful mean to investigate the spectral broadening due to disorder and its temperature dependence.

Figure 1. Normal emissivity spectra of two types of absorption profiles (Lorentz and Voigt) evaluated for identical amplitudes and full widths at half maximum. The small difference visible in the absorption wings results in a relatively deep change of emissivity values which indicates its high sensitivity to the shape of the absorption band.
Download figure:
Standard image High-resolution imageThe area of the causal Voigt profile  can be evaluated with the help of the cumulative distribution function
  of the Voigt function:
Where the cumulative distribution function  which includes the generalized
  hypergeometric function in its expression is given by:
The position of the maximum  of the causal Voigt profile can be retrieved by solving the following equation with freely available root finding algorithms:

Where  and
and

For vibrational modes verifying  which is always the case of those reported in this paper, the following approximations apply:
  ,
,  and
and 
Finally, when all  parameters vanish, the causal Voigt dielectric function model leads to results that are comparable to those obtained with the three-parameter Lorentz model. Its expression is less flexible than the four-parameter model when dealing with static crystalline structures. On the contrary, for crystalline structures resulting from dynamic averages, the causal Voigt model is the only one that gives a natural framework to capture in a quantitative way the profiles and the intensities of the absorption bands. It is thus expected and shown in the following that this model leads to a better decomposition of the infrared response.
3.2. Crystalline structures and infrared activity
From room temperature up to melting point, the SiO2 system undergoes several phase transitions that lead to polymorphic structures of different symmetries. From the knowledge of their space groups, Wyckoff positions of atoms and the number of formula units per unit cell, it is possible to deduce the infrared activity using group theory and by applying infrared selection rules [30]. All the structural details, number of active modes and associated irreducible representations for the SiO2 crystalline structures relevant for this work are given in table 1.
Table 1. IR actives modes for SiO2 polymorphic structures.
| Structure name | Space group |
Z |
Wyckoff positions | IR active modes |
|---|---|---|---|---|
| alpha-quartz | P3221 (154) | 3 | Si (3a), O(6c) | 4A2(z) + 8E(x, y) |
| beta-quartz | P6222 (180) | 3 | Si (3c), O(6j) | 2A2(z) + 4E1(x, y) |
| beta-cristobalite |  (227) (227) |
8 | Si (8a), O(16c) | 2T1u(x, y, z) |
aHermann-Mauguin notation (space group number). bNumber of formula units per unit cell.
For unpolarized measurements acquired for the (x, y) plane, group theory predicts the existence of 8 IR active modes of E symmetry for alpha quartz, 4 E1 modes for beta quartz and 2 T1u modes for beta cristobalite. However, the results shown in table 1 must be taken with caution since the symmetry of the crystalline structures of beta quartz and beta crystobalite are known to be only dynamic averages. IR selection rules may be broken by the disorder induced by large amplitude low frequency rigid unit modes. Localization of high frequency vibrational modes and activation of silent modes are thus expected with increasing temperature.
4. Experimental results
The temperature dependence of the emissivity of SiO2 has been acquired between room temperature and the liquid state. The room temperature spectrum was obtained by using an indirect method i.e. by measuring the reflectivity of the sample. All higher temperatures reported in figure 2 are direct acquisitions of the emissivity. A comparison between fits obtained on a typical set of spectra confirm the expected results: (a) the number of IR active modes do not obey completely the selection rules, and the optical response is more complex at all temperatures; (b) the classical Lorentz models are not able to reproduce the fine details of the experimental spectra; (c) the causal Voigt model performs much better, particularly at high temperatures, confirming thus the inhomogeneous broadening of the components due to the dynamic disorder (figure 3). Phonon wavenumbers obtained with the causal Voigt model at room (alpha quartz) temperature and in the beta quartz phase around 1000 K are reported in table 2 with typical literature values. The correspondence of positions for symmetry allowed phonons is excellent.
Table 2. Wavenumbers in cm−1 of the IR active phonons of SiO2 (E symmetry).
| Label | ωj(300 K) | ωj(˜1000 K) | ||||
|---|---|---|---|---|---|---|
| a | b | c | a | b | c | |
 |
263.83 | 264.13 | ||||
 |
392.54 | 393.5 | 393.55 | |||
 |
449.99 | 450 | 449.78 | 423.39 | 420 | 423.04 |
 |
435.42 |
|||||
 |
694.7 | 695 | 694.3 | |||
 |
794.4 | 797 | 795.36 | 779.67 | 779 | 780.28 |
 |
795.74 |
|||||
 |
1064.3 | 1065 | 1064.57 | 1061.93 | 1057 | 1060.37 |
 |
1059.7 |
1066.83 |
||||
 |
1152.9 |
1101.76 |
||||
 |
1160.2 | 1158 | 1160.03 | |||
 |
1248.7 |
1186.69 |
||||
a, present work; b, data from [22]; c, data from [25]. aSupplementary modes.
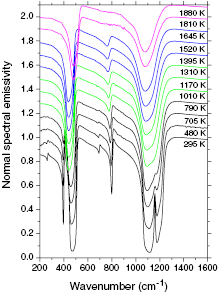
Figure 2. Temperature dependence of the normal spectral emissivity of the SiO2 crystalline system. Note the deep changes occurring at the alpha to beta quartz transition (846 K) and at the formation of beta cristobalite at 1743 K.
Download figure:
Standard image High-resolution image
Figure 3. Best fits of a typical set of emissivity spectra of SiO2 using 4 parameters Lorentz (equation (4)—disks) and Voigt (equation (5)—squares) dielectric function models. The wings of the reflection bands where the Voigt model performs much better indicate the existence of inhomogeneous broadening due to low frequency dynamic disorder.
Download figure:
Standard image High-resolution imageIn the alpha quartz phase, the low wavenumber phonons below 800 cm−1 are those allowed by symmetry. The high frequency range is, by contrast, highly impacted by the presence of dynamic disorder. Besides those allowed, three supplementary modes  with large FWHM are necessary to account for the complex temperature dependence of the stretching motions of the oxygen atoms. Two more modes
  appear in the intermediate (400–900 cm−1) spectral range above the alpha to beta quartz phase transition. The evolution of the real and imaginary parts of the dielectric function reported in figures 4 and 5 show in an unambiguous way the drastic impact of the phase transitions on the lattice dynamics of the SiO2 system. The alpha to beta transition of the quartz phase is characterized by the disappearance of four phonon modes
  , which is in accordance with group theory predictions, and a supplementary mode
  is lost on the way to the beta cristobalite phase. The temperature dependences of the amplitudes, spectral positions and FWHM of modes are reported in figure 6. The evolutions of the areas of these modes are also given in figure 7. As can be seen in the different graphs, the lattice dynamics of the SiO2 system are characterized by deep changes emerging at several temperatures. Besides the awaited modifications occurring at the transition temperatures from alpha to beta quartz at 846 K and leading to beta cristobalite at 1743 K, there are other more subtle changes of behavior near 600 and 1300 K.

Figure 4. Temperature dependence of the real part of the dielectric function of SiO2 obtained with the causal Voigt model given by equation (5). Several phonons clearly disappear at the phase changes towards the beta quartz phase at 846 K and the beta cristobalite phase at 1743 K.
Download figure:
Standard image High-resolution image
Figure 5. Temperature dependence of the imaginary part of the dielectric function of SiO2 obtained with the causal Voigt model given by equation (5). The solid–solid phase transitions at 846 and at 1743 K impact deeply on the lattice dynamics. The inhomogeneous broadening of most of the components with increasing temperature is clearly visible.
Download figure:
Standard image High-resolution image
Figure 6. Temperature dependences of the amplitude ( ), position (
 ) and FWHM (
 ) of the causal Voigt components used to fit the normal spectral emissivity spectra of crystalline SiO2. Vertical broken lines indicate the temperatures at which the well known alpha to beta quartz phase transition (846 K) and the formation of beta cristobalite (1743 K) occurs. The one at around 1300 K indicates the anomaly linked to appearance of an ill defined state.
Download figure:
Standard image High-resolution image
Figure 7. Temperature dependences of the area of the causal Voigt components used to fit the normal spectral emissivity spectra of crystalline SiO2. Vertical broken lines indicate the temperatures at which the main structural changes occur. Note the sudden increase of the  component around 1300 K for which the appearance of an ill defined state has been reported.
Download figure:
Standard image High-resolution image5. Discussion
The first result emerging from the spectra analysis is the confirmation that the high frequency stretching motions above 900 cm−1 are highly impacted by the existence of a low frequency dynamic disorder due to RUMs, even at relatively low temperatures. In addition to the two symmetry allowed normal modes  and
and  , three more modes
  are necessary to reproduce the complex shape of the high frequency absorption band. The nearly pure Gaussian shape and the FWHM from two to four times wider than the line width of the allowed phonons, indicate that these supplementary components represent distributions of polar oscillators activated by the dynamic disorder. These absorption bands are also visible in vitreous silica and alkaline silicate glasses [19] with stronger intensities; they are explained by the combined effect of the dynamic and topological disorder existing in these structures. As shown in figure 7, the
  component becomes the dominant stretching component in the beta cristobalite phase. Its temperature dependence in the alpha quartz and beta cristobalite phases is well described by an Arrhenius law with activation energy
  equal to 0.128 eV (figure 8). A constant value of this area is observed in the temperature domain of beta quartz and a rapid increase is seen for the ill-defined state above 1300 K. This component is at the heart of the phase changes since its spectral weight is acquired at the expense of the main stretching
  and
and  modes. Its area may be seen as an indirect measure of the low frequency dynamic disorder and the sudden changes of behavior of its position and inhomogeneous broadening (FWHM) can be analyzed in the framework of hard-mode spectroscopy [17]. This kind of localized mode acts like an Einstein oscillator and can couple with the microscopic mechanism linked to the order parameter
  characterizing a phase transition, the tilt angle of tetrahedra in the case of quartz. Previous studies [14 and references therein] have established that the main changes of the macroscopic properties occurring during and below the alpha to beta phase transition of Quartz are taken into account by the following standard Landau expansion for a first order transition:

Figure 8. Arrhenius plot showing the thermally activated behavior of the intensity of the disorder induced  mode in the alpha quartz and beta cristobalite phases. In the beta quartz region and up to 1300 K a departure from this law is seen. The line represents the best fit obtained with an activation energy
  . Mode
  also exhibits several changes of behavior.
Download figure:
Standard image High-resolution image
In the case of negative values, the equilibrium evolution of
  is given by:
where  is the equilibrium transition temperature. Several modes exhibits temperature dependences indicating a coupling with the order parameter
  . A typical set of changes is reported in figure 9. The temperature dependence of
  of mode
  is quadratic in
  , that of mode
  is linear. The best fits were obtained for
  =847 K and
  = 842 K which taking into account the uncertainty that is about 2 K is in perfect agreement with the value
  = 841 K reported by Tezuka et al [31] and that of 840 K published by carpenter et al [14]. These first results confirm the higher sensitivity of the supplementary modes to the structural changes and are also consistent with the picture of an alpha to beta quartz transition driven by soft RUMs. This unifying concept is well known for its capacity to reproduce both displacive and dynamic disorder aspects of such kinds of transitions [32]. The changes of behavior of the supplementary modes are also concomitant with other physical properties of this system. The appearance and strengthening of the high frequency ones in the alpha phase of quartz is another signature indicating that low frequency structural fluctuations of oxygen atoms are already present well below the transition temperature and explains the gradual loss of piezoelectric response of quartz. On the contrary, the
  phonon mode at 790 cm−1, that is essentially due to the motion of silicon atoms, is nearly not impacted in this temperature range. At
  the whole dynamic is deeply impacted: beside the modes allowed for the average symmetry of beta quartz and the high frequency supplementary modes linked to oxygen motion, there are two more modes which appear at low frequencies. These modes
  are a direct evidence of stronger dynamic disorder that now impacts also the motion of silicon atoms. In the beta quartz domain and up to 1300 K, the dynamics remains nearly constant at the exception of the FWHM of modes
  and
and  Figure 10 clearly shows the change of trends in the vicinity of 1143 K—the temperature at which the tridymite phase is supposed to appear. No phase change occurs at this point, but the inhomogeneous broadening of these modes—that are particularly sensitive to local fluctuations of the microscopic structure—seems to indicate the existence of premises that may lead to the tridymite phase if enough time is spent just above this temperature.

Figure 9. Evidence of hard mode behavior for the supplementary high frequency stretching modes and best fits (lines) which take account of their coupling with the order parameters driving the phase transitions.
Download figure:
Standard image High-resolution image
Figure 10. The FWHM of the supplementary modes  and
and  show linear trends that intersect around the temperature of the transformation to tridymite in the stable phase diagram. Lines are guides for the eyes.
Download figure:
Standard image High-resolution image
As reported in the literature, a new evolution of the structure seems to start at 1300 K [1]. The lattice dynamics probed in our work also give signs of this anomaly, a sudden increase of the intensity of mode  is observed after a rather wide stagnation regime. The strengthening of the mode is due to a spectral weight transfer from the allowed
  mode towards the
  component and is so important that its intensity becomes nearly twice of that of the
  mode at 1700 K. Based on their Brillouin spectroscopy results, Lakshtanov et al [1] tentatively explained the appearance of this anomaly by an early nucleation of beta cristobalite, but also conclude that more high temperature experiments would be necessary to recognize, describe and quantify this effect. This attribution is indeed questionable, since numerous experiments show that in pure quartz the lowest temperature at which cristobalite was identified but not formed is 1150 °C [33]. Recently, an in situ high-temperature XAS study at the Si K-edge has been done on the SiO2 system. A badly defined transition toward beta cristobalite was also observed between 1670 and 1940 K. Nevertheless, the authors clearly indicated that this ill-defined phase could not explain in any case the existence of the beta cristobalite suspected from Brillouin spectroscopy at 1270 K. The results obtained in our work are not in favor of a nucleation of beta cristobalite around 1300 K either, since modes such as
  , that are particularly sensitive to the appearance of this phase, are little impacted in this range. As suggested by the temperature evolution of modes
  and
and  , this anomaly can be seen simply as the reactivation of the localization of high frequency phonons due to the increasing number of RUMs (figures 6 and 7). In other words, the change of trend around 1300 K is similar to that seen at 400 K for the alpha to beta transition of quartz and represents a signature of the strengthening of the dynamic disorder of the oxygen atoms that may be the premises of a phase transition, and certainly announces its closeness. A very similar change of behavior is seen for the molar volumes of beta quartz and beta cristobalite between 1300 and 1400 K [34, 35]. In the case of beta quartz, the peculiar negative thermal expansion (NTE) evolution appears just above the temperature anomaly after a constant regime, which is exactly what is seen in the temperature dependence of the area of the disorder-induced
  mode. Our results thus represent direct experimental evidence of the role of dynamic disorder on the NTE phenomenon and confirm that the mechanism that facilitates the alpha to beta transformation is also responsible for the negative thermal expansion at high temperatures [4, 36].
Near 1743 K, a last solid–solid transition leads to the beta cristobalite phase. The several discontinuous changes seen in the parameters indicate the first order nature of this reconstructive transition. The vanishing of the  mode is evidence of a complete transformation into beta cristobalite. The high degree of dynamic disorder reached in this high temperature range is also indicated by the collapsing of the
  component. At this stage, the supplementary modes become the dominant part of the polar dynamics of the SiO2 system and also carry information on the order parameter driving the phase change. As can be seen in figure 9 the temperature dependence of the wavenumber of the
  component is well described by
  below
below  and
and  above
above  These results are consistent with the fact that the symmetry of beta cristobalite is produced by a dynamic average induced by thermally activated RUMs. As expected, the high frequency vibrational response in this phase originates essentially from the highly localized modes. The presence of a significant amount, in beta cristobalite, of long-lived clusters at the lower temperature phase is not supported by our data. The near vanishing of the
  component—or at least its strong decrease in the beta cristobalite region—is evidence of this.
6. Conclusion
Emission spectroscopy is a unique tool for retrieving the optical functions of materials in a wide spectral range and at extreme temperatures. Analysis of the lattice dynamics with a causal Voigt function model has allowed us to extract quantitative information on the impact of the low frequency disorder. The results extracted from the fit of the experimental data unambiguously show that the slow dynamic disorder acts as topological disorder for the high frequency stretching modes related to oxygen motions. Two effects were observed: most of the modes are impacted by increasing inhomogeneous broadening; supplementary modes—normally forbidden for average symmetry—are activated, and even become the dominant high-frequency response at high temperatures. The  component is at the heart of the sequence of changes observed for the SiO2 system and constitutes an indirect quantitative probe of the dynamics of the disordered oxygen atoms. This peculiar mode is thermally activated, but after the alpha to beta quartz transition, and up to 1300 K, its intensity stays constant, consistent with the whole dynamics of the SiO2 system, which does not evolve significantly in this temperature range. Above 1300 K, the mode intensity increases suddenly to return back to the thermally activated regime. This change corresponds to the ill-defined region reported in the literature and is concomitant with the appearance of the peculiar negative thermal expansion regime. Our work constitutes experimental evidence of the crucial role of the sudden increase of disorder in the existence of these phenomena. Finally, the transition towards the beta cristobalite phase is announced by several discontinuous changes in the parameters defining the dynamics of this system. Coupling of localized modes with the order parameter driving the reconstructive phase transition is evidenced and reproduced within the framework of hard-mode spectroscopy. We have highlighted the role of the low-frequency dynamic disorder on the sequence of phase transitions of pure SiO2. Since the presence of numerous defects is known to impact the behavior of this compound—and favor the formation of tridymite, for instance—it will be interesting to study how the chemical disorder caused by the defects acts and if it couples to the slow dynamic disorder.
Appendix A.: FWHM of the causal Voigt profile
The FHWM  of the standard Voigt profile
  is defined by the expression:
A way for determining its value is to find the root  satisfying the following non linear equation:
The algorithm reported hereafter to compute the solution uses the Halley's third order rational iteration formula [37] that is given by:
Where  and
and 
 and
and  are the first and second derivatives of
Taking the first and second order partial derivatives of the Voigt function leads to:
Finally, we choose for the initial guess, a rough approximation reported in the literature  [38] and apply the iteration formula until obtaining the desired numerical precision. A function named voigt_fwhm was written in C++ to illustrate the implementation of the algorithm. The code is based on the open source Faddeeva Package that can be downloaded from its website [29].
C++ code
double voigt_fwhm(double gl, double gg, double eps)// eps = 1e-12
{
static double ispi = .56418958354775628694807945156079; // 1/sqrt(pi)
static double s_ln2 = .8325546111576977563531646448952; // sqrt(ln2)

double a = s_ln2*gl/gg;
std::complex<double> z, wz, z_wz;

double x, dx, Vxa, dVdx, dVda, d2Vdx2, g, u, v;
double w = std::sqrt(1.0+1.0/(a*a)); // initial guess [Posener 1959]
x = 2.0*s_ln2*w/gg;
do
{z = std::complex<double>(x, a); // z = x + i a
wz = Faddeeva::w(z); // w(z)
z_wz = z*wz; // z w(z)
Vxa = std::real(wz); // V(x, a)
dVdx = -2.0*std::real(z_wz); // dV(x, a)/dx
dVda = 2.0*(std::imag(z_wz)- ispi); // // dV(x, a)/da
d2Vdx2 = -2.0*(x*dVdx + Vxa + a*dVda); // d(dV(x, a)/dx)/dx
g = Vxa - 0.5*Faddeeva::erfcx(a); // f=0
u = g/dVdx;
v = d2Vdx2/dVdx;
dx = -u/(1-u*v/2.0);
x += dx;
}
while (std::abs(dx/x) > eps);

return x*gg/s_ln2;
}