
Abstract
We discuss the origin of static friction and show how it can be reduced towards kinetic friction by the appropriate design of the sliding system. The basic idea is to use elastically soft solids and apply the external forces in such a way that different parts of the contacting interface start to slip at different times during the (tangential) loading process. In addition, the local slip must be large enough in order to result in a strong drop in the static friction force. We illustrate the theoretical predictions with the results of a simple model experiment.
Export citation and abstract BibTeX RIS
1. Introduction
A non-zero force is usually necessary in order to slide a solid object on another stationary solid object, e.g. a rectangular block on a (nominally) flat substrate. The static friction force Fs is the force necessary to initiate the sliding motion, while the kinetic friction force Fk is the force necessary to slide the block at a given (constant) velocity (here we assume that stick–slip motion does not occur). If FN is the normal force the block exerts on the substrate, then the static friction coefficient μs = Fs/FN and the kinetic friction coefficient μk = Fk/FN. While the kinetic friction coefficient is often a well-defined quantity (which, however, depends on the material, surface condition (e.g. contamination films), sliding velocity, temperature, humidity, etc) the static friction coefficient depends on the history of the contact [1–3], e.g. on the time of stationary contact, on the geometrical and elastic properties of the solids (see below) [4–6] and on how (and where) the external forces (inducing the sliding) are applied [7]. Some aspects of this have been known for a very long time, e.g. Coulomb performed experiments which showed that the static (or breakloose) friction coefficient in general increases monotonically with the time of stationary contact. This is due to slow interfacial relaxation processes (aging). Thus, it is not meaningful to speak about a static friction coefficient without specifying the history of the contact between two solid objects. It has recently been demonstrated that the static friction coefficient also depends on where the external forces inducing the slip are applied to the block [7], and in this paper we show that the static friction also depends on the geometrical form and elastic properties of the solid objects.
In this paper we will discuss how one can reduce the static friction by suitable design of the sliding system. Reducing the static friction force tends to reduce the chance that stick–slip motion occurs, which is important in many applications. We illustrate the theoretical predictions with the results of a simple model experiment.
2. Static friction
Consider a rectangular block with nominally flat surfaces located on a nominally flat substrate, see figure 1(a). The tangential force F = Fs necessary to initiate sliding of the block is referred to as the static or breakloose friction force and the force necessary to keep the block moving at a constant velocity v is the kinetic friction force Fk (which depends on v). We define the nominal (or macroscopic) frictional shear stresses τs = Fs/A0 and τk = Fk/A0, where A0 is the nominal contact area. While the kinetic friction force is a relatively well-defined quantity, this is not the case for the static friction force. In particular, the static or breakloose friction can be reduced by arranging it so that different interfacial surface regions (patches) start to slip at different times during the increase of the applied (tangential) force F. In addition, the local slip must be large enough (of the order of, or larger than, a characteristic distance D defined below) in order to result in a strong drop in the static friction force. This can be realized either by using different geometrical constructions (see sections 4 and 5) or by applying the external force at different places on the sliding body. Low elasticity modulus materials and elastically inhomogeneous materials also tend to reduce the static friction by allowing different regions at the sliding interface to slip at different times during the tangential loading process (the start-up of sliding).
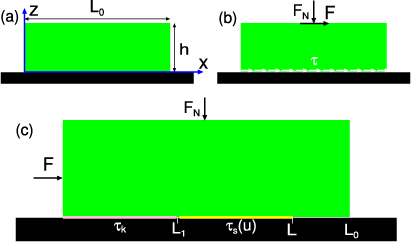
Figure 1. (a) A rectangular block with nominally flat surfaces on a nominally flat substrate. (b) If the block is loaded in such a way that a constant tangential stress σxz = τ prevails at the block–substrate interface it will start to slip when τ reaches the static frictional stress value τs (which depends on the time of stationary contact, on the normal load FN and on the speed with which τ increases with time). (c) If the block instead is loaded on one side the onset of slip in general occurs at a stress smaller than τs.
Download figure:
Standard imageAssume that the (nominal) frictional shear stress acting on the bottom surface of the block decreases from τs to τk as the surface moves (displacement coordinate u) a distance D (see figure 2): τf = τs − (τs − τk)u/D for u < D and τf = τk for u > D. There are many possible reasons for why τs > τk, e.g. a slow increase in the area of real contact with increasing contact time due to thermally activated (stress-aided) creep, or, for polymers, interdiffusion of polymer chains at the contacting interface. In the latter case one expects D ≈ 1 nm due to chain pull-out at the onset of slip. In the case of plastic creep, D will be of the order of the typical linear size of the macroasperity contact regions (which depends on the surface roughness, the elastic modulus and the penetration hardness of the solids) which is typically of the order of a few μm. In a humid atmosphere capillary bridges may form which will also have a thermally activated (slow) contribution from surface regions at nanometer separation. In this case D will be the local translational distance necessary in order to break a bridge. Another origin of increase in the static friction coefficient with the time of stationary contact is fluid squeeze-out, in particular when the surfaces are initially separated by a high viscosity fluid as in some applications discussed below (section 4). In this case D will be of the order of the diameter of the contact regions which could be macroscopic, e.g. of the order of mm in a typical application. In all cases discussed above, there will be a distribution P(D) of distances D, but here we will, for simplicity, assume that this distribution is narrow and approximately P(D) = δ(D − D0).
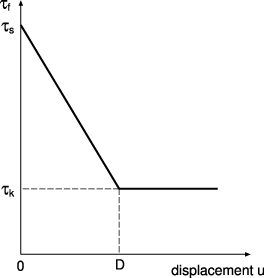
Figure 2. The change in the frictional shear stress when the sliding surface (velocity v) moves a distance u = vt (schematic). For time t < 0 the surfaces are in stationary contact. The frictional shear stress is assumed to drop linearly with the displacement u over a distance D, from the static frictional stress τs to the kinetic frictional stress τk.
Download figure:
Standard imageConsider first the idealized case where the applied tangential force results in a macroscopic interfacial stress τ(x), which is constant (see figure 1(b)), i.e. independent of x. In this case the nominal static frictional stress equals τs. The macroscopic stress τ(x) is the microscopic stress averaged over large enough surface patches, τ = 〈τmic(x)〉, to remove the strong stress fluctuations resulting from the (nearly) randomly distributed asperity contacts. A uniform macroscopic interfacial stress may be hard to realize, e.g. even if the rectangular block in figure 1 is loaded with a uniform stress τ0 at its upper surface, the interfacial stress will, in general, be non-uniform1.
Consider now the case where the block is instead loaded tangentially by applying an external stress σ0 on one side as in figure 1(c). We will now show that in this case the frictional shear stress at the onset of slip takes a value between τs and the kinetic frictional stress τk, i.e. the static or breakloose friction for this case can be much smaller than when the block is loaded in such a way that the (nominal) shear stress is uniform at the block–substrate interface (see figure 1(b)).
We assume for simplicity that the substrate is rigid while the block is elastic with the Young's modulus E. We will use an approximate 1D description of the contact problem. Thus, we assume that the elastic deformation of the block due to the tangential applied force is in the x direction and only depends on x, i.e.  . The stress σ = Edu/dx. In the following treatment we will neglect kinetic effects. That is, we assume that the crack-like front (at x = L in figure 1) moves adiabatically as the loading force increases. In the absence of frictional interaction this is, in fact, the expected result because the stress level near the tip of a crack is a decreasing function of the length of the crack under constant loading at the trailing edge. Experiments have shown [7] that kinetic effects (related to the velocity dependence of the friction force) are important also in the present case, but we believe that the (qualitative) conclusions presented below are not modified by this fact.
Let Lz = h be the height and Ly the width of the block in the y direction. The total force acting on a slab of the block extending from x to x + Δx must vanish, which gives

where τf(x) is the frictional shear stress at the block–substrate interface at location x. Thus we get h dσ/dx = τf(x) or hE d2u/dx2 = τf(x). Thus for 0 < u < D we have

while for u > D
Let us first assume that u < D everywhere at the interface. From (1) we get

where
If we denote u(0) = u0 and σ0 =− σ(0), where σ(x) = E du(x)/dx, we get

and


Assume that for x > L we have u = 0. In this case u(L) = 0 and σ(L) = 0. Using (3) these equations give


Combining (7) and (11) and (8) and (12) gives


or

Similarly, subtracting (14) from (13) gives

This equation is only valid as long as u(0) < D or, from (16),
When κL > acos(τk/τs) there will be a region for 0 < x < L1 where u > D and where (2) holds rather than (1), while u < D for L1 < x < L so (1) holds in this interval. Thus in this case from (2) we have for 0 < x < L1

while for L1 < x < L

Denoting u(0) = u0 and σ0 =− σ(0) we get α = u0 and β =− σ0/E so that (18) gives

Since u(L1) = D we get from (19) and (20)


Since du/dx must be continuous at x = L1 we get

Assume that for x > L we have u = 0. In this case u(L) = 0 and σ(L) = 0. Using (19) these equations give

Substituting (24) and (25) in (21) gives
or

so that

Substituting (24) and (25) in (23) gives
or

Using (26) we have
Using (27) and (29), equation (28) becomes
Equation (30) is valid for κL > acos(τk/τs) while (17) is valid for κL < acos(τk/τs). For κL = acos(τk/τs) we get from (17)
which agree with (30) in this limiting case. Thus the frictional shear stress, as a function of κL, is, as expected, continuous at κL = acos(τk/τs).
Let Lx = L0 be the length of the block so that L ≤ L0. It is easy to show from (17) and (30) that the nominal frictional shear stress τ = σ0h/L0 is a monotonically increasing function of L. Thus the maximum frictional shear stress will, as expected, occur when L = L0. In figure 3 we show the maximum frictional shear stress τmax (in units of the static frictional shear stress τs) and the width L1 of the region where the slip distance is larger than D (where the frictional shear stress equals τk) in units of the length L0 of the block, as a function of κL0. The result in the figure was obtained from (17) and (30) with L = L0. Note that as κL0 → ∞,τmax → τk while τmax = τs for κL0 = 0. Since κ → 0 as the elastic modulus E → ∞ it follows that for a rigid block the nominal static frictional shear stress equals τs, as indeed expected because for a rigid block all material points move the same distance. On the other hand, for very soft elastic solids one often expects κL0 ≫ 1 in which case the static friction coefficient will be nearly equal to the kinetic friction coefficient. Using (4) the criteria κL0 ≫ 1 become
Since τs = μsσN and τk = μkσN, where σN = FN/A0 is the nominal normal stress, we can also write (31) as
Often μs − μk and L0/h are of the order of unity in which case (32) becomes E/σN ≪ L0/D.
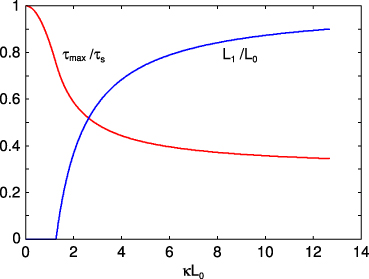
Figure 3. The maximum frictional shear stress τmax (in units of the static frictional shear stress τs) and the width L1 of the region where the slip distance u is larger than D (where the frictional shear stress equals τk) in units of the length L0 of the block, as a function of κL0, where κ is defined by equation (4). We have assumed τk = 0.3τs.
Download figure:
Standard imageThe displacement u(x) and the stress σ(x) for L1 < x < L0 are given by


and for 0 < x < L1


where σ0 is given by (30).
In figure 4 we show the displacement u(x) (from (33) and (35), in units of the distance D) and the compressive stress σ(x) (from (34) and (36)) in the block (in units of the static frictional shear stress τs) as a function of the distance x along the block in units of the length L0 of the block. The stress profile is at the point where the applied force is maximal (where L = L0). In the calculation we have assumed τk = 0.3τs and κL0 = 3.5.

Figure 4. The displacement u(x) (in units of D) and the compressive stress σ(x) in the block (in units of the static frictional shear stress τs) as a function of the distance x along the block in units of the length L0 of the block. The displacement and the stress profile is at the point where the applied force is maximal (where L = L0). In the calculation we have assumed τk = 0.3τs, σN = 2 MPa and κL0 = 3.5.
Download figure:
Standard imageThe model presented above is 1D. Another 1D treatment of the onset of slip has recently been presented by Bouchbinder et al [8], but they focused mainly on the dynamic aspects of the onset of slip. A more accurately treatment requires using (at least) a 2D model where the displacement field and the stress field depends on x and z. In a 2D model the slip region 0 < x < L corresponds to a type II crack and the point x = L to the crack tip [9]. The stress distribution in the vicinity of a crack tip cannot be properly described by a 1D model. Nevertheless, we expect the basic physics which interest us here to be correctly described by the 1D model presented above.
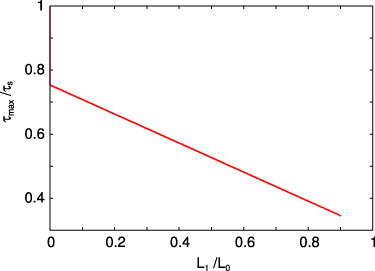
Figure 5. The maximum frictional shear stress τmax (in units of the static frictional shear stress τs) as a function of the width L1 of the region where the slip distance u is larger than D (where the frictional shear stress equals τk) in units of the length L0 of the block. We have assumed τk = 0.3τs.
Download figure:
Standard image3. Comparison with experiment
In a recent letter Ben-David and Fineberg have presented detailed friction measurements for the sliding of a rectangular PMMA block on a PMMA substrate [7]. The local relative contact area along the frictional interface was probed with high time and spatial resolution using an optical method, and the interfacial stress distribution was probed using miniature strain gauges along the frictional interface. The nominal contact pressures was varied from 1.7 to 5.8 MPa. The sliding block had the dimensions Lx = L0 = 20 cm,Ly = 0.6 cm and Lz = h = 10 cm. The Young's modulus of PMMA is E ≈ 3 GPa. The length parameter D depends on the nature of the surface roughness (and on the elastic modulus and the penetration hardness) but is typically of the order of 10 μm for PMMA [2]. Using these parameters and from experiment μs ≈ 1 and μk ≈ 0.3 the formula
gives κL0 ≈ 4.0 − 7.4 when σN varies from 1.7 to 5.8 MPa, but this estimate is not very accurate as an accurate value for D is not known at present, and it is likely that D increases slightly with increasing pressure, at least when plastic flow occurs. Using figure 3 this gives a variation in the breakloose friction coefficient from 0.444 to 0.378 or by 0.07. There are large fluctuations in the measured static friction coefficient even when measured at a single contact pressure, but on average the static friction coefficient decreases by about ≈ 0.05 as the contact pressure increases from 1.7 to 5.8 MPa which is in reasonable agreement with figure 3.
Figure 5 shows the maximum frictional shear stress τmax (in units of the static frictional shear stress τs) as a function of the width L1 of the region where the slip distance u is larger than D (where the frictional shear stress equals τk) in units of the length L0 of the block. The results have been obtained from the information in figure 3. The slope of the line is ≈− 0.45, which is close to what has been observed by Ben-David and Fineberg [7] for the slope of the linear relation (slope ≈− 0.40) they observe between μmax/μs = τmax/τs (where we have assumed μs = 1) and the length parameter lT/L0, where lT is the width of the region where the slip is larger than D. Here lT was deduced from the spatial variation of the area of real contact as probed by an optical method.
4. A model experiment
Here we report on an experiment using blocks of different shapes, where different parts of the sliding interface start to move at different times during breakloose, thus reducing the breakloose friction. The experimental set-up is shown in figure 6. We have produced two blocks which we refer to as (a) a rectangular block and (b) a stepped block. Both blocks have (identical) hemispherical profiles (ribs) on their lower surface, which are squeezed against a lubricated substrate.
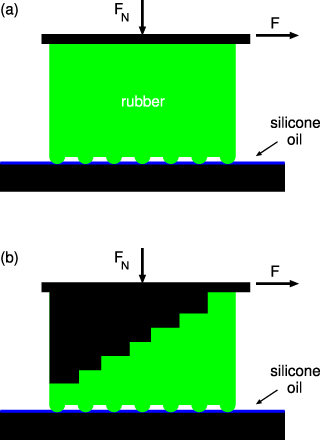
Figure 6. Experimental set-up used to study how the breakloose friction depends on the shape of the block. (a) Rectangular block. (b) Stepped block.
Download figure:
Standard imageQualitatively, we may state that for the stepped block the different ribs are connected to the (rigid) drive-surface by effective elastic springs which become longer (and hence softer) the larger the distance is between the hard surface and the rib. This will make them start to slip at different times. Because of the complex geometry in the present case, an accurate determination of the effective spring constants is only possible using numerical methods, such as the finite element method. However if, as illustrated in figure 7, the width of each step is much larger than the thickness of the rubber slab for each step, and if the distance a between two ribs is of the order of or smaller than the thickness (of the thinnest) rubber slab, then a simple analysis is possible. Thus, in this case if the rigid surface moves a distance u while the ribs are pinned, the shear stress in a rubber segment of height d will be Gu/d. If f is the shear force per unit length (y direction) acting on a rib then the stress per unit area equals f/a. Thus f = (a/d)Gu = ku and the effective spring k = (a/d)G connecting a rib to the hard surface will decrease as the thickness d of the rubber segment increases.
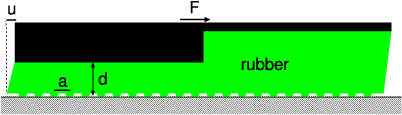
Figure 7. If the width of each step is much larger than the thickness of the rubber slab for each step, and if the distance a between two ribs is of the order of or smaller than the thickness (of the thinnest) rubber slab, then a simple calculation of the effective spring connecting a rib to the driving surface is possible (see text).
Download figure:
Standard imageThe block is made from silicon rubber (PDMS) crosslinked in a steel mold. The ribs of the steel mold were made using spark erosion, followed by electropolishing, which produces randomly rough surfaces with a roughness with isotropic properties. The rubber blocks are made from a silicone elastomer (PDMS) prepared using a two-component kit (Sylgard 184) purchased from Dow Corning (Midland, MI). The rectangular and stepped rubber blocks (green) are glued to metal blocks (black) on the upper surface as indicated in figure 6. In the experiments a flat PMMA or SiO2 glass substrate is used (both surfaces give the same result).
Each rubber block has seven ribs with a radius of about 0.75 mm and an individual length of 30 mm. The nominal force is kept constant for all experiments at FN ≈ 24.6 N, resulting in a Hertz contact width w ≈ 0.4 mm and Hertz nominal pressure at the interface between the ribs and the PMMA or SiO2 glass substrate of σN ≈ 0.3 MPa. The substrate is covered with a high viscosity silicon oil (viscosity η = 1 Pa). On increasing squeezing time the silicon oil gets slowly removed from the nominal rib–substrate contact region [11, 12]. The decrease in the film thickness and the increase in the contact area with increasing time of stationary contact will result in a breakloose friction force (at a given fixed drive velocity v) which increases with the time of stationary contact. In our experiments, after waiting some given time period, the PMMA surface is moved perpendicular to the ribs with a constant velocity v ≈ 1.0 mm s−1 (drive velocity).
Figure 8 shows the dependence of the breakloose friction coefficient for the rectangular block on the logarithm (with 10 as the base) of the time of stationary contact (red data points). Also shown in the figure is the kinetic friction coefficient (green data point) (at the sliding velocity v = 1 mm s−1) at a 'contact time' defined as t = w/v, where w is the width of the contact region in the sliding direction and v the sliding velocity. Note that the kinetic friction coefficient data point falls on the straight line (fitting curve) through the other (red) data points. The increase in the breakloose friction force with increasing time of stationary contact is due to the decrease in the film thickness and the increase in the contact area with increasing time of stationary contact.
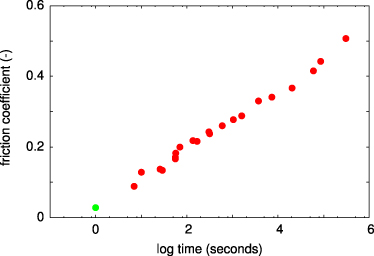
Figure 8. The dependence of the breakloose friction force (for the rectangular block) on the time of stationary contact (red data points). Note that the kinetic friction data point (green) falls on the straight line if the contact time is defined as t = w/v, where w is the width of the contact region in the sliding direction and v the sliding velocity.
Download figure:
Standard imageNext the rubber block is squeezed against the substrate for 10 min before the friction coefficient is measured. Figure 9 shows the friction force as a function of time for the rectangular and stepped blocks. Note that the stepped rubber block gives ∼ 20% lower breakloose friction than for the rectangular rubber block. This is due to the fact that, when the tangential force increases, for the stepped block the different ribs are loaded non-uniformly in time, and start to slip at different times. Even for the rectangular block the ribs will be loaded non-uniformly in time (due to edge effects) but to a much less extent than for the stepped block.
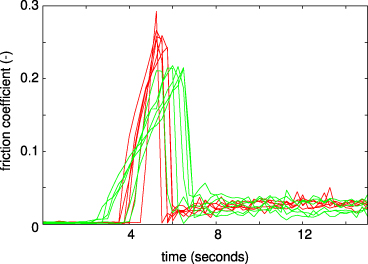
Figure 9. The friction force as a function of time for the rectangular (red curves) and stepped (green curves) blocks. In each case the experiment is repeated several times.
Download figure:
Standard image5. Discussion
We have shown above that the static friction can be reduced if it is arranged so that different parts of the sliding interface start to slip at different times during tangential loading. In addition, the local slip distance must be of the order of, or larger than, a characteristic distance D which, depending on the application, can be from nm to mm. Basically, D is the distance an interfacial surface patch must slip in order for the frictional shear stress to drop from the static frictional shear stress τs to the kinetic frictional shear stress τk. In what follows we will denote as sequential interfacial slip when, during the tangential loading, different surface patches slip distances of the order of D (or more) before the maximum (or breakloose) friction force has been reached, in contrast to collective interfacial slip, where no part of the sliding interface has moved more than some small fraction of D before the onset of global slip (breakloose).
There are several criteria which can be used to design systems exhibiting sequential interfacial slip. First, the external forces should be applied in such a way that the shear stress at the interface becomes as non-uniform as possible. This was realized in the study by Ben-David and Fineberg by applying the tangential force on one vertical side of the block close to the sliding interface, and also by slightly tilting the surface. Using elastically soft solids will also favor sequential interfacial slip by allowing different surface patches to move large distances relative to each other without building up large stress fields. Using elastically inhomogeneous solids can result in very inhomogeneous interfacial stress distributions, which can cause different surface patches to move at different times during the tangential loading, and result in sequential interfacial slip. Finally, structuring or patterning the sliding interface, e.g. by introducing a dense pattern of vertical cuts or pillars on one of the surfaces, will also favor sequential interfacial slip by reducing the elastic coupling between different surface patches (the structured surface is elastically softer than the bulk), thus allowing surface patches to move more independently of each other than on the homogeneous surface. Thus the patterning of surfaces reduces the static or breakloose friction, which in turn reduces the tendency for global stick–slip motion. This has recently been demonstrated in beautiful measurements by Varenberg and Gorb [4–6]. One set of experiments involved a silicon rubber surface with a hexagonal surface micro-pattern, see figure 10. Figure 10(a) shows a schematic picture of the hexagonal contact plates and (b) shows a close-up of the micro-patterned surface. Figure 10(c) shows the dry friction force as a function of the lateral displacement for both smooth and micro-patterned surfaces. Note that the structured surface exhibits a static friction only 60% of that of the smooth surface of silicon rubber and no (macroscopic) stick–slip motion, in sharp contrast to the unstructured surface.
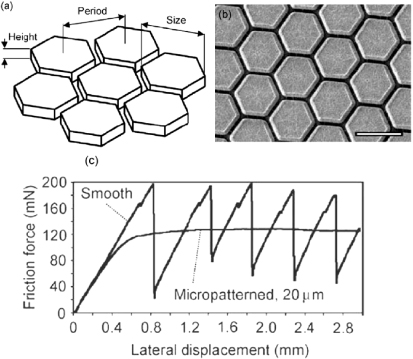
Figure 10. Friction experiments on silicon rubber surface with a hexagonal surface micro-pattern. (a) Schematic picture of the hexagonal contact plates and (b) a close-up of the micro-patterned surface. (c) The dry friction force as a function of the lateral displacement for both smooth and micro-patterned surfaces. Adapted from [5].
Download figure:
Standard image6. Elastic coherence length
The interplay between small scale disorder due to random contacts and elastic interactions between the contacts is a complex statistical mechanics problem. The study above has shown that, due to the non-uniform macroscopic shear stress which prevails at the block–substrate interface in most cases, different parts of the interface will start to slip at different times during tangential loading, even if the frictional shear stress τs is constant. The question of coherent or sequential slip has been studied in great detail in different contexts from vortex lines in superconductors [13], dislocations in solids and domain walls in ferromagnets, to name just a few, and here we briefly comment on the relevance of these studies for sliding friction.
Assume that two bodies in contact form a set of n = 1/d2 random contacts per unit area. In the limit of small loads, we can consider a weak pinning hypothesis, in which friction results from the fluctuations of the forces due to individual contacts, and derive a scaling theory [14, 15] which predicts the so-called Larkin length, which separates the length scales for which negligible elastic deformation prevails (L < Lc) and the solid can be considered rigid, from those at which the disorder potential dominates (L > Lc) and different parts of the interface deform to adapt to the pinning center. For two macroscopic bodies in contact, the theory predicts that Lc is very large if d ≫ D and E ≫ τY (where τY is a characteristic stress to break a junction), and pinning-induced deformations should be absent. Yet elastic deformations are observed to play an important role in several experiments (see sections 2, 3, 4 and 5).
We believe that the elastic coherence length or the Larkin length defined above is not a very useful or relevant concept in the context of sliding friction. The reason is that the macroscopic shear stress at the block–substrate interface, due to tangential loading, is, in general, not constant but varies over macroscopic distances. For example, for a rectangular block there will be, in general, a stress concentration at the edges of the block even if the block is loaded with a uniform stress at its upper surface, and the same is true for other shapes of bodies, e.g. a spherical body squeezed against a flat surface. In the Larkin theory it is instead assumed that the driving force is constant in space, which may indeed be the case in the applications for which this theory was originally developed. When the macroscopic shear stress is non-uniform it may induce local slip at different places at the interface during loading, and if the local slip is large enough (of the order of D or larger) it will have a drastic influence on the breakloose friction force (see sections 2, 3, 4 and 5).
The study in section 2 showed that sequential interfacial slip, due to the non-uniform macroscopic shear stress, is important when the parameter κ0 = ED/(σNL0) < 1. On the other hand, the Larkin theory would predict that sequential slip is important when κ1 = Ed/(τY D) < 1. The ratio

Since τY /σN ≈ A0/A = d2/D2 (where A is the area of real contact) we get κ0/κ1 = L0/d. Since the linear size of the nominal contact region, L0, in general is much larger than the average separation d between two nearby contact regions, it is clear that the influence of the non-uniformity of the macroscopic shear stress is much more important than the effect described by the Larkin theory. This explains why a solid may appear elastically soft with respect to sliding friction, even when the Larkin length may be huge (as is typically the case).
A second reason for why the Larkin theory cannot be applied directly to the contact between elastic solids is that the microscopic stress at the interface (in the absence of an external tangential loading force) is not uncorrelated in space, as assumed in the Larkin theory [16]. This can be understood from contact mechanics theories for randomly rough surfaces with roughness on many length scales (often well described as self-affine fractal) [17, 18]. Thus, it has been shown that the stress–stress correlation function exhibits long-range correlations due to the elastic coupling between asperities [19, 20]. The reason for why this elastic coupling cannot be neglected is related to the fact that roughness occurs on many length scales and can be understood as follows. A simple picture of a rough surface consists of large bumps on top of which occur smaller bumps on top of which occur even smaller bumps and so on. When two elastic solids with rough surfaces make contact at low nominal contact pressure there will be a long distance between the contact involving the biggest bumps (which result in contact regions we denote as a macroasperity contact region), and it may be possible to neglect the elastic coupling between these bumps. However, the nominal pressure in the macroasperity contact regions is unrelated to the applied pressure and, in general, so high that the microasperity contact regions within a macroasperity contact region are densely spaced and the elastic coupling between these microasperity contact regions is very important.
7. Summary and conclusion
We have discussed the origin of why the static or breakloose friction is larger than the kinetic friction, and shown how to reduce it towards the kinetic friction by the appropriate design of the sliding system. The basic idea is to use elastically soft solids and apply the external forces in such a way that different parts of the contacting interface start to slip at different times during the (tangential) loading process. In addition, the local slip must be large enough in order to result in a strong drop in the static friction force. The amount of local slip D necessary in order for the local stress to drop to the kinetic stress depends on the type of interfacial relaxation process (aging) which dominates the strengthening of the contact with the time of stationary contact, and D can range from a fraction of a nanometer to mm. We have presented a 1D model where a block is loaded on one vertical side and studied how the maximal friction depends on several parameters. The theory results are consistent with the experimental data of Ben-David and Fineberg. We have illustrated the theory predictions with the results of a simple model experiment.
Acknowledgments
We thank S Gorb for preparing for us figure 10. This work, as part of the European Science Foundation EUROCORES Program FANAS, was supported from funds by the DFG and the EC Sixth Framework Program, under contract N ERAS-CT-2003-980409.
Footnotes
- 1
If a rectangular elastic block with a smooth surface is squeezed against a flat smooth surface, the normal stress at the interface will, in general, be non-uniform. The same is true for the shear stress which results if, in addition to the normal force, a parallel force is applied to the block. However, if the substrate is rigid and the Poisson ratio of the block is zero, both the normal stress and the tangential stress will be uniform, assuming that the external stresses act uniformly on the upper surface of the block. When surface roughness occurs on the block and/or substrate surface, the macroscopic (locally averaged) normal and tangential stress may be nearly uniform even when the Poisson ratio is non-zero. This has been shown in experiments involving rubber blocks squeezed against nominally flat substrates (see [10]). This is because the rubber is pressed into the ridges of the rough surface, and the hydrostatic pressure becomes smaller.