
Abstract
The martensitic transition in Ni50Mn34In16 alloy has been studied by measuring the magnetization of the alloy as a function of temperature, magnetic field and pressure. Magnetic field and pressure have opposite effects on the martensitic transition in this alloy; the martensitic transition temperature decreases with increasing magnetic field but it increases with increasing pressure. The effect of pressure on the magnetocaloric properties of this large magnetocaloric effect alloy has been investigated in detail. The magnitude of the peak in the isothermal magnetic entropy change in Ni50Mn34In16 increases with pressure. The temperature at which the magnetocaloric effect reaches the peak value in this alloy increases from near 240 K under ambient pressure to near 280 K under an external pressure of 9.5 kbar. The temperature corresponding to the peak in the isothermal magnetic entropy change increases with increasing pressure at a rate which matches the rate of increase of the martensite start temperature with increasing pressure. The temperature dependence of the isothermal magnetic entropy change under different pressures is found to follow a universal curve for a particular magnetic field change. These results show that pressure as a control parameter can be used to tune the temperature regime of the magnetocaloric effect in the alloy. The effect of pressure on the martensitic transition also gives a clue as regards the possibility of tuning this temperature regime with elemental substitution.
Export citation and abstract BibTeX RIS
1. Introduction
Materials showing the magnetocaloric effect (MCE) are a focus of research activities nowadays because of the potential of these materials for use as environment friendly and energy efficient magnetic refrigerants. In these materials the application/removal of a magnetic field affects the magnetic entropy associated with the spin configuration of the system [1]. It has also been discovered that in materials undergoing a first-order magneto-structural transition the structural entropy change adds to the change of magnetic entropy [2]. A number of alloy systems undergoing magneto-structural transitions have been reported to show a large MCE in the temperature regime of the transition [2–9]. In some of the alloys exhibiting the MCE, it has been observed that the magnitude and/or temperature regime of this magnetocaloric effect changes with applied external pressure. The MnAs based alloys [5, 10], the Tb5Si2Ge2 [11], Er5Si4 [12], LaFeSi [13], and CoS2 based alloys [14] and Y bInCu4 [15] are some examples of such alloy systems. In recent years the off-stoichiometric Heusler alloy Ni50Mn34In16 has been reported to show a large MCE near 240 K, across the martensitic transition in the alloy [16–19]. It is known that the magnetic properties of the Heusler alloys depend on the external pressure [20–22]. It has also been reported that the austenite (AST)–martensite (MST) phase transition temperature in the Ni–Mn–Ga [23], Ni–Mn–Sn [24] and Ni–Mn–In [25] Heusler alloys shifts with external pressure. There exists a literature reporting the effect of pressure on the MCE in Ni–Mn–Ga [26, 27] and the Co doped Ni–Mn–Sb alloys [28]. Recently, a barocaloric effect has been reported in Ni49.26Mn36.08In14.66 alloy [29]. However, the effect of pressure on the MCE in Ni–Mn–In alloy has remained unexplored.
In Ni–Mn–In alloy, the temperature of the MST–AST phase transition increases with increasing external pressure [25]. Further, the magnetic properties of the Ni–Mn–X (X = In, Sn etc) Heusler alloys are known to depend on the inter-atomic distance between the Mn atoms [30, 31]. Applied pressure is likely to affect the inter-atomic separation and, as a result, the magnetic interactions are likely to be modified. This effect along with the pressure dependence of the MST–AST transition in Ni50Mn34In16 alloy is expected to influence the MCE in this alloy system. In the present work, we study the effect of hydrostatic pressure on the MCE associated with the MST–AST phase transition in the Ni50Mn34In16 alloy. The combined effect of pressure and magnetic field on the characteristic temperatures of the MST–AST transition is also investigated. The temperature regime of the peak magnetocaloric effect of the alloy is found to shift towards higher temperature with increasing pressure. The rate at which the temperature of the MCE peak (TMCE peak) increases with increasing pressure is found to match the rate of enhancement of the martensite start temperature with increasing pressure. The peak value of the isothermal magnetic entropy change in the alloy also increases with pressure. The pressure dependences of the magnitude and temperature of the peak magnetocaloric effect, and the effective refrigerant capacity of the alloy, appear to be somewhat different qualitatively. However, the temperature dependence of the isothermal magnetic entropy change for a given field change follows a universal functional form for all values of applied pressure.
2. Experimental details
A well characterized polycrystalline Ni50Mn34In16 alloy sample has been used for the present study. The details of the sample preparation and characterization can be found in [32]. The same sample was used earlier for studying the MCE at ambient pressure [16]. The temperature (T) and magnetic field (H) dependence of the magnetization (M) were measured using a superconducting quantum interference device (SQUID) magnetometer (MPMS-XL, Quantum Design). A pressure cell arrangement (Mcell-10, easyLab Technologies, UK) was used to measure the magnetization under different values of the hydrostatic pressure (P), up to a maximum pressure of 10 kbar. The temperature dependence of the magnetization was measured using the field cooled cooling (FCC) and field cooled warming (FCW) protocols. In the FCC protocol, the magnetic field is applied at the temperature 325 K and the measurement is performed while cooling the sample down to 5 K. After reaching 5 K, the measurement is continued while warming up the sample in the same magnetic field, and this latter protocol of measurement is called FCW. For isothermal M(H) measurement, the sample was first cooled from 325 K to the desired temperature in zero field and then the M(H) measurement was performed while cycling the magnetic field between 0 and 50 kOe.
3. Results and discussion
Figure 1(a) presents the temperature dependence of the magnetization of Ni50Mn34In16 alloy in the temperature range of 5–325 K in a 100 Oe magnetic field at ambient pressure (designated P = 0). At P = 0 (ambient pressure), the rise in M around 300 K with decreasing temperature is related to a paramagnetic to ferromagnetic phase transition in the AST phase of the alloy [16, 33]. The sharp drop in M around 240 K with decreasing temperature and the associated thermal hysteresis in M are attributed to the first-order nature [34, 35] of the AST to MST phase transition in the alloy [33]. Figure 1(b) presents the temperature dependence of the magnetization of the Ni50Mn34In16 alloy in the temperature range of 5–325 K in a 100 Oe magnetic field, under P = 3.4, 5.6 and 9.5 kbar pressure. The comparison of the M(T) curves in figures 1(a) and (b) indicates that the application of external pressure has a negligible effect on the paramagnetic–ferromagnetic transition in the AST phase of the alloy. However, the MST–AST phase transition temperature shifts towards higher temperature with increasing pressure.

Figure 1. Temperature (T) dependence of the magnetization (M) of Ni50Mn34In16 alloy in field cooled cooling (FCC) and field cooled warming (FCW) protocols in an applied magnetic field (H) of 100 Oe (a) at ambient pressure (P = 0) and (b) under various applied pressures. AST and MST denote austenite and martensite phases.
Download figure:
Standard imageFigure 2 presents the temperature dependence of the magnetization in the FCC and FCW protocols in the representative magnetic fields of 10 and 50 kOe, under applied pressures of 0, 3.4, 5.6 and 9.5 kbar. Data exist for many other values of magnetic fields but are not shown here for the sake of conciseness. For all values of the applied pressures the magnetization in the AST phase is larger as compared to that in the MST phase. Under a constant pressure, the MST–AST phase transition in the Ni50Mn34In16 alloy shifts towards lower temperature with increasing magnetic field. From the M(T) curves in various applied magnetic fields under constant pressures, we have determined the magnetic field and pressure dependence of the four characteristic temperatures: martensitic start (TMS), martensitic finish (TMF), austenite start (TAS) and austenite finish (TAF) for the martensitic transition in the present alloy. TMS (TAS) is the temperature where the martensite (austenite) phase starts to nucleate in the austenite (martensite) phase while cooling (warming) the sample. TMS (TAS) is determined as the temperature where the magnetization starts decreasing (increasing) while cooling (warming) the sample. TMF (TAF) is the temperature of completion of the AST (MST) to MST (AST) transition. TMF (TAF) is determined as the temperature where the temperature hysteresis in the magnetization is closed while cooling (warming) the sample. At temperatures below (above) TMF (TAF) the M(T) curves in cooling and warming are indistinguishable. TMF (TAF) is the limit of supercooling (superheating) in terms of standard phenomenology of a first-order phase transition [34]. It is worth noticing here that the AST to MST phase transition while cooling the sample and the MST to AST phase transition while warming the sample take place over a finite width of temperature. This suggests a disorder influenced nature of the transition [36, 37]. Further, the observation that TMS is greater than TAS indicates the presence of a landscape of transition onsets in the present alloy [38].
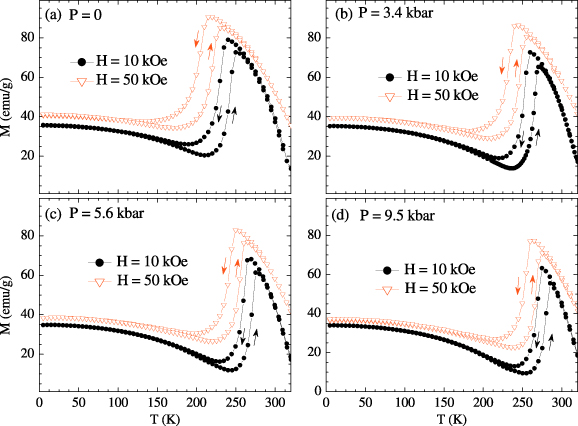
Figure 2. Temperature (T) dependence of the magnetization (M) of Ni50Mn34In16 alloy in an applied magnetic field (H) of 10 kOe and 50 kOe (a) at ambient pressure (P = 0), (b) under P = 3.4 kbar, (c) under P = 5.6 kbar and (d) under P = 9.5 kbar.
Download figure:
Standard imageTable 1 presents the field dependences of the four characteristic temperatures TMS, TMF, TAS and TAF obtained under P = 0, 3.4, 5.6 and 9.5 kbar respectively. This table shows the combined effect of magnetic field and pressure on the MST–AST transition in Ni50Mn34In16 alloy. Further, table 1 shows that all four characteristic temperatures decrease with increasing magnetic field under all pressures applied in the present set of experiments. We have also estimated the pressure dependences of the four characteristic temperatures of the martensitic transition in constant magnetic fields and these are presented in table 2. In a constant magnetic field, all four characteristic temperatures increase with increasing pressure. The average rate of shift of TMS under H = 100 Oe with pressure is nearly 3.5 K kbar−1 and it increases to 5.5 K kbar−1 under H = 70 kOe. The rate of shift of TMF is approximately 6 K kbar−1 in all fields. The rate of shift of TAS varies from 3.5 K kbar−1 under H = 100 Oe to 7.7 K kbar−1 under H = 70 kOe. The rate of shift of TAF also increases from 2 K kbar−1 under H = 100 Oe to 4.5 K kbar−1 under H = 70 kOe. The value of the rate of shift of the transition temperature with pressure is comparable with the value reported in the literature for an alloy with the same nominal composition [25] but is larger than that observed in Ni–Mn–Sn alloy [24]. Table 1 reveals that magnetic field and external pressure have opposite effects on the MST–AST phase transition in the present alloy (this is more clearly seen from figure 2 and table 2). While magnetic field shifts the MST–AST transition towards the lower temperature side, application of pressure shifts it towards higher temperature. The increase in the MST–AST transition temperature with increasing pressure in the alloy is correlated with the decrease in volume across the AST to MST phase transition [39] through the Clausius–Clapeyron equation for a first-order phase transition [25]. Using the actual composition Ni49.2Mn34.7In16.1 of present alloy (as determined with energy dispersive x-ray (EDX) analysis [32]) and a lattice constant of 6.011 Å for the unit cell (as determined from x-ray diffraction (XRD) study [32]), the specific volume of the alloy comes out as 1.23 × 10⁻⁴ m3 kg−1. Considering the decrease in volume in the austenite to martensite transition to be 0.3% as reported for the alloy with the same nominal composition [25] and taking the value of dT/dP≈3.5 K kbar−1 (this is the average rate of shift of TMS and TAS for H = 100 Oe), the change in entropy across the martensite–austenite transition is estimated, employing the Clausius–Clapeyron equation, to be 10.5 J kg−1 K−1. The decrease in the transition temperature with increasing magnetic field is related to the higher value of the magnetization in the austenite phase of the alloy [33]. Thus the opposite effects of increasing pressure and magnetic field on the MST–AST phase transition in the present alloy are related to the fact that while pressure stabilizes the martensite phase because of its lower volume, magnetic field stabilizes the austenite phase due to the larger magnetization in the austenite phase.
Table 1. Magnetic field (H) dependences of the four characteristic temperatures martensite start (TMS), martensite finish (TMF), austenite start (TAS) and austenite finish (TAF) under different pressures (P) in Ni50Mn34In16 alloy.
| P = 0 | P = 3.4 kbar | P = 5.6 kbar | P = 9.5 kbar | |||||||||||||
|---|---|---|---|---|---|---|---|---|---|---|---|---|---|---|---|---|
| T (K): | TMS | TMF | TAS | TAF | TMS | TMF | TAS | TAF | TMS | TMF | TAS | TAF | TMS | TMF | TAS | TAF |
| H (kOe) | ||||||||||||||||
| 0.1 | 255 | 170 | 220 | 270 | 275 | 210 | 235 | 280 | 280 | 220 | 240 | 285 | 285 | 230 | 255 | 290 |
| 1 | 245 | 145 | 215 | 260 | 270 | 185 | 235 | 275 | 275 | 210 | 240 | 280 | 280 | 220 | 255 | 290 |
| 10 | 240 | 135 | 205 | 255 | 260 | 165 | 234 | 272 | 270 | 185 | 235 | 280 | 275 | 200 | 250 | 290 |
| 20 | 235 | 130 | 195 | 250 | — | — | — | — | — | — | — | — | — | — | — | — |
| 50 | 215 | 105 | 165 | 235 | 245 | 110 | 210 | 255 | 250 | 140 | 220 | 265 | 265 | 155 | 235 | 275 |
| 70 | 205 | 80 | 150 | 225 | 230 | 95 | 190 | 245 | 245 | 125 | 205 | 255 | 255 | 135 | 225 | 270 |
Table 2. Pressure (P) dependence of the four characteristic temperatures martensite start (TMS), martensite finish (TMF), austenite start (TAS) and austenite finish (TAF) in various magnetic fields (H) in Ni50Mn34In16 alloy.
| H = 100 Oe | H = 10 kOe | H = 50 kOe | H = 70 kOe | |||||||||||||
|---|---|---|---|---|---|---|---|---|---|---|---|---|---|---|---|---|
| T (K): | TMS | TMF | TAS | TAF | TMS | TMF | TAS | TAF | TMS | TMF | TAS | TAF | TMS | TMF | TAS | TAF |
| P (kbar) | ||||||||||||||||
| 0 | 255 | 170 | 220 | 270 | 240 | 135 | 205 | 255 | 215 | 105 | 165 | 235 | 205 | 80 | 150 | 225 |
| 3.4 | 275 | 210 | 235 | 280 | 260 | 165 | 234 | 272 | 245 | 110 | 210 | 255 | 230 | 95 | 190 | 245 |
| 5.6 | 280 | 220 | 240 | 285 | 270 | 185 | 235 | 280 | 250 | 140 | 220 | 265 | 245 | 125 | 205 | 255 |
| 9.5 | 285 | 230 | 255 | 290 | 275 | 200 | 250 | 290 | 265 | 155 | 235 | 275 | 255 | 135 | 225 | 270 |
The magnetism in Ni–Mn–X (X = In, Sn etc) alloys arises mainly because of the magnetic moment on the Mn sublattice [40]. The magnetic properties of the Ni–Mn–X alloys are dependent on the inter-atomic distance between the Mn atoms [30, 31]. The applied pressure affects the inter-atomic separation, and as a result the magnetic interactions are modified. Therefore the magnetocaloric properties of the alloy are also expected to change with pressure. The isothermal change in magnetic entropy (ΔSM) occurring because of a change in magnetic field gives a quantitative measure of the MCE. Generally, ΔSM for a given change of magnetic field is estimated from the isothermal M(H) curves using Maxwell's relation [41]. However, there exists literature suggesting that this method can result in somewhat erroneous estimation of ΔSM across a first-order phase transition [42, 43]. Here, we have therefore estimated the temperature dependence of ΔSM from the iso-field M(T) curves obtained at constant pressures using the following equation:
The M versus T curves for the Ni50Mn34In16 alloy in some representative magnetic fields at P = 0 and under applied pressure of 9.5 kbar are presented in figure 3. Each of these iso-field M(T) measurements was performed starting from a zero-field cooled state at a temperature well inside the martensite phase. The temperature dependence of ΔSM (calculated using the method described above) for the present alloy under various pressures, and for the magnetic field changes of 20 and 50 kOe, is presented in figure 4. ΔSM has a negative value at temperatures away from the MST–AST phase transition at the respective pressure. This is consistent with the negative value of dM/dT (see equation (1) which shows that ΔSM will be negative for negative dM/dT) at temperatures away from the MST–AST phase transition where the material is ferromagnetic. However, in the temperature regime of the MST–AST phase transition, ΔSM shows a positive peak (termed the inverse MCE). For a field change of 20 kOe (see figure 4(a)), ΔSM peaks at 6.8 J kg−1 K−1 near 244 K at ambient pressure which increases to 7.8 J kg−1 K−1 at 280 K under a pressure of 9.5 kbar. There is another peak in ΔSM(T) near 310 K which corresponds to the conventional MCE due to the paramagnetic–ferromagnetic transition in the AST phase the alloy. This peak value changes from −3.3 J kg−1 K−1 at ambient pressure to −2.9 J kg−1 K−1 under P = 9.5 kbar. For a field change of 50 kOe (see figure 4(b)), ΔSM peaks near 234 K, 256 K, 264 K and 274 K under 0 kbar, 3.4 kbar, 5.6 kbar and 9.5 kbar pressures respectively. The peak value of ΔSM increases from 10.4 J kg−1 K−1 under zero pressure to 12.3 J kg−1 K−1 under pressure of 9.5 kbar. The isothermal entropy change at ambient pressure matches closely that estimated using the Clausius–Clapeyron equation. The peak ΔSM value corresponding to the conventional MCE near 310 K changes from −6.5 J kg−1 K−1 at ambient pressure to −5.6 J kg−1 K−1 under P = 9.5 kbar. The peak ΔSM values for the inverse MCE in the present alloy sample for a field change of 20 kOe are comparable with that of Gd (nearly 10 J kg−1 K−1 near 292 K) for a field change of 70 kOe [44] and the peak ΔSM values for a field change of 50 kOe are larger than this. The peak value of ΔSM for the field change of 50 kOe is at all pressures smaller than that for the case of Ni45Co5Mn36.7In13.3 alloy where a ΔSM value of 28.4 J kg−1 K−1 is observed near 292 K for a magnetic field change of 70 kOe [45]. This is also smaller than ΔSM≈19 J kg−1 K−1 observed for Gd5Si2Ge2 alloy close to 276 K in a 50 kOe magnetic field [3]. However these values were calculated from isothermal M(H) curves. In the present case, ΔSM calculated under 3.4, 5.6 and 9.5 kbar pressures from isothermal M(H) curves for a field change of 50 kOe comes out as nearly 16.5 J kg−1 K−1, 19.2 J kg−1 K−1 and 20 J kg−1 K−1 respectively. These values are comparable to the 18.5 J kg−1 K−1 value obtained for this alloy at P = 0 using the same method [16]. For the present alloy the peak value of ΔSM increases with pressure. For Co doped Ni–Mn–Sb alloy [28] and some compositions of the Ni–Mn–Ga alloy [26], the peak value of ΔSM decreases with pressure. For some other compositions of Ni–Mn–Ga, the peak ΔSM is also reported to increase with pressure [26]. The ΔSM(T) curve for a field change of 50 kOe at ambient pressure shows an anomalous feature near the peak (at about 225 K; see figure 4(b)). The origin of this feature is not quite clear. However, from the experimental data it appears to be related to the change of slope (dM/dT) of the iso-field M(T) curves at these temperatures (near TAS and TAF) for magnetic fields in excess of 20 kOe. In our earlier work, a shoulder has also been observed in the ΔSM(T) curve estimated from the isothermal M(H) curves obtained at these temperatures [16]. We tend to believe that this shoulder is a feature associated with the field induced MST to AST phase transition in the present alloy [16] and probably not an experimental artefact. However, this anomaly is not observed in the ΔSM(T) curves obtained under externally applied pressure. This may be because of the fact that the martensite to austenite transition (and hence the respective TMCE peak), under pressures applied in present set of experiments, is shifted to significantly higher temperatures. In this higher temperature regime the above mentioned change of slope (dM/dT) of the iso-field M(T) curves is not observed near TAS and TAF for any value of applied magnetic field.

Figure 3. Magnetization (M) versus temperature (T) curves of Ni50Mn34In16 alloy under (a) ambient pressure (P = 0) and (b) P = 9.5 kbar, measured starting from a zero-field cooled state.
Download figure:
Standard image
Figure 4. Temperature (T) dependence of the isothermal magnetic entropy change (ΔSM) in Ni50Mn34In16 alloy under various applied pressures (P) estimated for a field change of (a) 20 kOe and (b) 50 kOe.
Download figure:
Standard imageWe now investigate the effect of pressure on the refrigerant capacity (RC) of Ni50Mn34In16. RC is defined as the amount of heat transferred between the cold and the hot reservoirs in an ideal refrigeration cycle using the alloy under a particular pressure as the working medium. It was calculated using a method available in the literature [16, 46]. For the estimation of the effective refrigerant capacity (RCEFF), the average hysteresis loss was calculated from isothermal M(H) curves at the respective pressure in the relevant temperature range and was subtracted from the RC. Figure 5 compares the value of TMCE peak, the peak value of ΔSM (ΔSpeak) and RCEFF for Ni50Mn34In16 alloy under various pressures for field changes of 20 and 50 kOe. As pointed out in the earlier discussion, ΔSpeak increases slowly with increasing pressure for both field changes. Moreover, in harmony with figure 4, the temperature TMCE peak increases with increasing pressure. The rate of increase of TMCE peak with pressure is near 3.8 K kbar−1 for a field change of 20 kOe, and 4 K kbar−1 for a field change of 50 kOe. This matches the rate of shift of TMS with pressure obtained from table 2. It is worth noticing that for pressure change from 0 to 9.5 kbar the TMCE peak increases from 244 to 280 K for a field change of 20 kOe and from 234 to 274 K for a field change of 50 kOe, though RCEFF decreases slowly but remains near 60 J kg−1 and 150 J kg−1 for field changes of 20 kOe and 50 kOe respectively. The decrease in RCEFF can be correlated with the narrowing of the temperature range Thot–Tcold with increase in pressure (see the inset to figure 5(a)). Here Tcold and Thot are the temperatures of the cold and the hot reservoirs respectively in an ideal refrigeration cycle using the alloy under a particular pressure as the working medium. The temperatures of the cold and hot reservoirs of the ideal refrigeration cycle for the present alloy increase with pressure. These temperatures increase to 265.7 K and 281.7 K respectively under 9.5 kbar pressure, as compared to 223 K and 247.7 K respectively for a field excursion of 50 kOe for P = 0. Thus the temperature regime of the MCE in Ni50Mn34In16 alloy increases towards room temperature with increasing pressure while the RCEFF remains nearly constant. The observation that the working temperature regime in Ni50Mn34In16 alloy increases to 280 K with pressure as compared to around 240 K in the parent Ni50Mn34In16 alloy suggests that the temperature regime can be further increased to room temperature with still higher pressure. This also gives a clue as regards tuning the temperature regime of the MCE in Ni50Mn34In16 alloy with the chemical pressure generated by the substitution of atoms in the alloy. An isoelectronic elemental substitution with a smaller atom is equivalent to external pressure. Such a substitution is expected to elevate the AST to MST transition temperature as has been reported for elemental substitution of In by Ga [47].

Figure 5. Pressure (P) dependence of the (a) temperature of the peak in the isothermal magnetic entropy change (TMCE peak), (b) peak value of the isothermal magnetic entropy change (ΔSpeak), and (c) effective refrigerant capacity (RCEFF) for field changes (ΔH) of 20 and 50 kOe for Ni50Mn34In16 alloy. The inset to (a) shows the P dependence of the difference between the temperature of the cold reservoir (Tcold) and the temperature of the hot reservoir (Thot).
Download figure:
Standard imageIt has been observed here that though the pressure dependence of TMCE peak follows that of TMS, the pressure dependences of ΔSpeak and RCEFF do not really follow the pressure dependence of any of the characteristic temperatures of the MST–AST phase transition in any field. It is therefore important here to find out whether the field–temperature dependence of the MCE continues to exhibit the same qualitative behaviour (as it did for P = 0) when external pressure is applied. This is done by investigating whether the temperature dependence of the isothermal magnetic entropy change, corresponding to a particular change of field, follows the same universal functional form (curve) in both the presence and the absence of externally applied pressure. Following the procedure described in the literature [48, 49], first the Y axis in figure 4 is normalized with the respective ΔSpeak value. Then the temperature axis in figure 4 is rescaled with a new variable θ as

where Tpeak = TMCE peak for the respective ΔSM(T) curve. The temperatures Tr1 and Tr2 are the two reference temperatures above and below Tpeak such that θ(Tr1,r2) = ±1. Two reference temperatures are used to avoid the effect of the demagnetization factor and the presence of any minority magnetic phase [49]. We have taken two reference temperatures such that ΔSM(Tr1,r2)/ΔSpeak = 0.5 for the respective ΔSM(T) curve with Tr1 < Tpeak < Tr2. With this criterion, Tr1 = Tcold and Tr2 = Thot for the respective ΔSM(T) curve. The ΔSM/ΔSpeak(θ) curves for field changes of 20 and 50 kOe under P = 0, 3.4, 5.6, 9.5 kbar are presented in figure 6. In figure 6 there is a reasonable overlap between the two ΔSM/ΔSpeak(θ) curves for field changes of 20 and 50 kOe within a narrow temperature range around the peak under all pressures investigated. The difference in the ΔSM/ΔSpeak(θ) curves for field changes of 20 and 50 kOe at temperatures away from the peak originates from the difference in peak shapes for the two field values. The lack of collapsing of the ΔSM/ΔSpeak(θ) curves for different magnetic fields to a single universal curve is observed in other systems also undergoing a first-order magnetic transition [49]. Further the change in the shape of the M(T) curves across the MST–AST transition with increasing magnetic field at a constant pressure in the present alloy (see figure 2) also contributes to the difference in ΔSM/ΔSpeak(θ) curves for different field values. However, it is interesting to investigate whether a universal ΔSM/ΔSpeak(θ) curve, with respect to variation in pressure for a constant field excursion, exists or not. ΔSM/ΔSpeak(θ) curves under various pressures for constant field excursions of 20 kOe and 50 kOe are presented in figures 7(a) and (b) respectively. In figure 7(b) the ΔSM/ΔSpeak(θ) curve for the field excursion of 50 kOe under P = 0 is not included due to the anomaly in the data near the peak (see figure 4(b)). Apart from this anomaly, there is a good overlap of this ΔSM/ΔSpeak(θ) curve (at P = 0) with the ΔSM/ΔSpeak(θ) curves under other pressures. The collapse of all the ΔSM/ΔSpeak(θ) curves in figure 7 to nearly a single curve suggests the existence of a universal ΔSM/ΔSpeak(θ) scaling function at least for pressure up to 9.5 kbar for a constant field excursion. Such a universal scaling function is expected in the case of a second-order phase transition. However, the transition in the present case is of first order and hence a universal behaviour of the curves is not obvious. One possible explanation for the observed universal behaviour is as follows. The peak in the isothermal ΔSM(T) curves under discussion is related to the field induced MST to AST transition in the alloy. These isothermal ΔSM(T) curves are estimated for a particular magnetic field excursion (ΔH = 20 kOe in figure 4(a) and ΔH = 50 kOe in figure 4(b)) under different external pressures. Further, the variations of the four characteristic temperatures TMS, TMF, TAS and TAF with magnetic field (see table 1) constitute the H–T phase diagram of the alloy. The H–T phase diagrams of the present alloy under P = 0 and 9.5 kbar (extreme values of pressure in the present investigations), constructed from the data in table 1, are presented in figure 8. Similar H–T phase diagrams have also been constructed for P = 3.4 and 5.6 kbar (not presented here for the sake of conciseness) and the following discussion applies to those as well. We see in the H–T phase diagrams (see figure 8) that, depending on the temperature and magnitude of the magnetic field excursion, an isothermal field excursion can lead to conversion of a particular fraction of MST to AST phase because of the field induced MST to AST transition at that temperature [33]. The ΔSM/ΔSpeak(θ) curves under different pressures have been constructed by normalizing ΔSM(T) with the respective ΔSpeak, and rescaling the T axis with the respective Tpeak and Tr1,r2 as explained earlier. For a given magnetic field excursion, the locations of Tpeak under different pressures are equivalent in the respective H–T phase diagrams. So this field excursion at the respective Tpeak, leads to an MST to AST transition to the same extent under all pressures. Similarly, the same field excursion at the respective rescaled temperatures leads to an MST to AST transition to extents which are similar under all pressure but vary with the rescaled temperature. For example, the field excursions of 20 and 50 kOe are shown in figure 8 at their respective Tpeak values. The field excursions of 20 kOe from point A1 to point A2 at the respective Tpeak in figure 8(a) and from C1 to C2 at the respective Tpeak in figure 8(b) lead to MST to AST transitions to similar extents as these are in equivalent positions in the respective H–T phase diagrams. The MST to AST transition is incomplete at point A2 in figure 8(a) as well as at point C2 in figure 8(b). To attain a complete AST phase, in figure 8(a) we need to increase the magnetic field up to the point A3 and in figure 8(b) we need to go up to the point C3. The extra field increments A2 to A3 and C2 to C3, required to complete the MST to AST transition, are similar in the two cases. Similarly, the field excursions of 50 kOe at the respective Tpeak from point B1 to B2 in figure 8(a) and from D1 to D2 in figure 8(b) are also equivalent. In both cases, the field induced MST to AST transition is near to completion at the respective Tpeak. It is expected that for a given field excursion, the case will be similar not only at the respective Tpeak but also at the respective rescaled temperatures. Thus for a constant field excursion, the ΔSM/ΔSpeak(θ) curves under different pressures can follow a universal curve. On the other hand, different isothermal field excursions under a given pressure lead to MST to AST transitions to different extents. For example, the field excursion path A1 to A2 (ΔH = 20 kOe) is not equivalent to the path B1 to B2 (ΔH = 50 kOe) in figure 8(a). These two field excursions lead to MST to AST transitions to different extents as explained in the previous discussion. For these dissimilar field excursions the extents of the field induced MST to AST transitions are expected to be different at the corresponding rescaled temperatures as well. Therefore such ΔSM/ΔSpeak(θ) curves do not follow a universal curve.
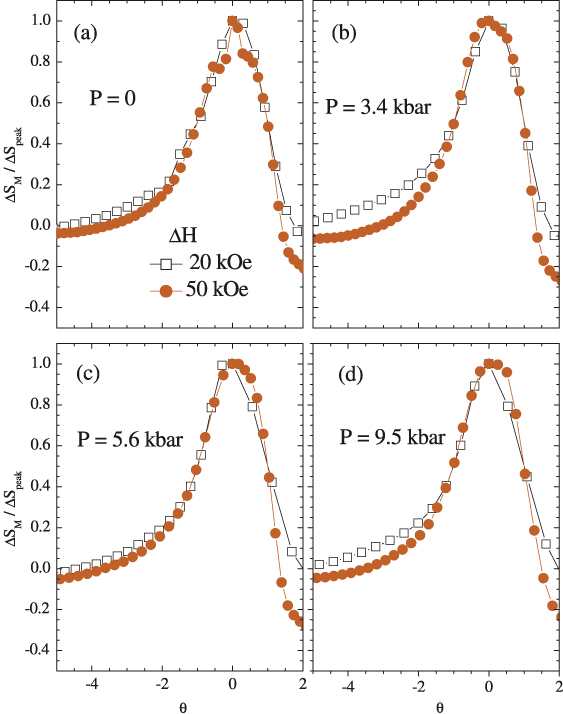
Figure 6. Rescaled temperature (θ) dependence of the normalized isothermal magnetic entropy change (ΔSM/ΔSpeak) for field changes (ΔH) of 20 and 50 kOe for Ni50Mn34In16 alloy under (a) ambient pressure (P = 0), (b) P = 3.4 kbar, (c) P = 5.6 kbar and (d) P = 9.5 kbar. See the text for details.
Download figure:
Standard image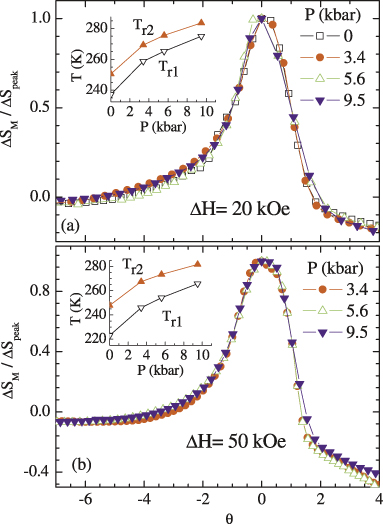
Figure 7. Rescaled temperature (θ) dependence of the normalized isothermal magnetic entropy change (ΔSM/ΔSpeak) for Ni50Mn34In16 alloy under various applied pressures (P) for field changes (ΔH) of (a) 20 kOe and (b) 50 kOe. The insets of (a) and (b) show the P dependence of the two reference temperatures (Tr1 and Tr2) for field excursions of 20 kOe and 50 kOe respectively. See the text for details.
Download figure:
Standard image
Figure 8. Magnetic field (H)–temperature (T) phase diagrams of Ni50Mn34In16 alloy under applied pressures (P) of (a) P = 0 and (b) P = 9.5 kbar. TMS, TMF, TAS and TAF are the four characteristic temperatures of the austenite–martensite transition in the alloy. See the text for details. Isothermal paths A1 to A2 in (a) and C1 to C2 in (b) represent field excursions of 20 kOe at the respective Tpeak values. Similarly, isothermal paths B1 to B2 in (a) and D1 to D2 in (b) represent field excursions of 50 kOe at the respective Tpeak values. Tpeak is the temperature where the isothermal magnetic entropy change peaks for the particular magnetic field excursion.
Download figure:
Standard imageThe universality of the ΔSM/ΔSpeak(θ) curve with respect to pressure can be useful for the estimation of the temperature dependence of the isothermal magnetic entropy change in the present alloy in a desired range of temperature (say at T>Tpeak) under a certain pressure, without actually performing an experiment with applied pressure. This may be done using the data available at other temperatures (say at T≤Tpeak). The insets of figure 7 show the pressure dependences of the two reference temperatures (Tr1 and Tr2) for field changes of 20 and 50 kOe. Both the temperatures increase with pressure.
4. Conclusion
Summarizing, the effect of hydrostatic pressure on the magnetocaloric effect associated with the martensitic phase transition in the Ni50Mn34In16 alloy has been studied in detail. The effect of a magnetic field is to shift the martensitic transition to lower temperature, while an applied pressure shifts the transition towards the higher temperature side. The effect of pressure on the magnetic phase diagram of the alloy has been investigated by studying the combined effect of pressure and magnetic field on the characteristic temperatures of the martensitic phase transition. All these characteristic temperatures increase nearly linearly with increasing external pressure. The temperature regime of the peak magnetocaloric effect is found to shift towards higher temperature with increasing pressure. The temperature of the peak isothermal magnetic entropy change increases to near 280 K under pressure of 9.5 kbar as compared to near 240 K at ambient pressure. The rate at which this peak temperature increases with increasing pressure is found to match the rate of enhancement of the martensite start temperature with increasing pressure. The peak isothermal magnetic entropy change in the alloy also increases with pressure. The effective refrigerant capacity, however, decreases slightly with increasing pressure. But it still continues to remain close to 150 J kg−1 for a field change of 50 kOe as the pressure is raised from ambient to 9.5 kbar. Though the pressure dependence of the magnitude and temperature of the peak in the magnetocaloric effect, and the effective refrigerant capacity of the alloy appear to be somewhat different qualitatively, the temperature dependence of the isothermal magnetic entropy change for a given field change is found to follow a universal curve under all pressures investigated. The present results show that pressure can be used to tune the temperature regime of the magnetocaloric effect in the Ni–Mn–In family of alloys. A pressure study of the underlying martensitic transition also provides a clue as regards tuning the temperature regime of the magnetocaloric effect with the chemical pressure generated by the atomic substitution.
Acknowledgments
The authors hereby acknowledge the help of Drs L S Sharathchandra and Ashish Khandelwal in applying pressure in the pressure cell and in mounting the sample in the magnetometer.