
Abstract
Recent clinical studies have demonstrated that photoacoustic imaging (PAI) provides important diagnostic information during a routine breast exam for cancer. PAI enhances contrast between blood vessels and background tissue, which can help characterize suspicious lesions. However, most PAI systems are either not compatible with commercial ultrasound systems or inefficiently deliver light to the region of interest, effectively reducing the sensitivity of the technique. To address and potentially overcome these limitations, we developed an accessory for a standard linear ultrasound array that optimizes light delivery for PAI. The photoacoustic enabling device (PED) exploits an optically transparent acoustic reflector to help direct laser illumination to the region of interest. This study compares the PED with standard fiber bundle illumination in scattering and non-scattering media. In scattering media with the same incident fluence, the PED enhanced the photoacoustic signal by 18 dB at a depth of 5 mm and 6 dB at a depth of 20 mm. To demonstrate in vivo feasibility, we also used the device to image a mouse with a pancreatic tumor. The PED identified blood vessels at the periphery of the tumor, suggesting that PAI provides complementary contrast to standard pulse echo ultrasound. The PED is a simple and inexpensive solution that facilitates the translation of PAI technology to the clinic for routine screening of breast cancer.
Export citation and abstract BibTeX RIS
1. Introduction
Photoacoustic imaging (PAI) is a promising, emerging modality in the medical field with implications for early cancer detection. PAI relies on the absorption of a short laser pulse followed by transient heating, thermoelastic expansion, and generation of ultrasonic waves. An ultrasound transducer then detects these waves to produce an image. The resulting ultrasound image has contrast proportional to the absorption of light—a parameter varying several orders of magnitude depending on the tissue type and optical wavelength (Oraevsky et al 1993). In soft tissue, the primary intrinsic optical absorber is hemoglobin, which is detectable up to several centimeters into the body at near infrared wavelengths. For diagnostic breast imaging, PAI maps blood vessels near suspicious lesions identified by x-ray mammography or ultrasound imaging. PAI can also map dyes to differentiate sentinel lymph nodes and aid axillary lymph node staging of breast cancer patients (Erpelding et al 2010). Initial clinical trials suggest that PAI can assist mammography for identifying cancer and aid the decision to biopsy (Ermilov et al 2009, Manohar et al 2007). In these studies, blood vessel clusters near a lesion indicate potential neovasculature or angiogenesis associated with common types of breast cancer.
Despite the promise of PAI for providing complementary information during a breast exam, existing systems have limitations. Initial systems implemented during clinical trials were not compatible with conventional ultrasound scanners (Ermilov et al 2009, Jose et al 2009). They required expensive custom hardware, a special imaging platform with the patient prone, or long scan times. Although real-time PAI has been demonstrated using handheld platforms, efficient light delivery to the region of interest remains a challenge (Kim et al 2010, Fournelle et al 2009, Yang et al 2007, Zemp et al 2008, Olafsson et al 2010, Fronheiser et al 2010, Bauer et al 2011). Photoacoustic (PA) signals are proportional to local energy deposition; thus, the control of the illumination pattern is paramount for imaging the entire tissue volume at an optimal signal-to-noise ratio and compensating for the optical scatter and absorption of superficial tissue. Early designs (Fronheiser et al 2010, Fournelle et al 2009, Kim et al 2010) exploited similar approaches of directing light around the ultrasound probe so that light enters the tissue at oblique angles and intersects the imaging plane in the tissue (figure 1, left). Such geometry confines the illumination pattern to specific depths, which is suboptimal for imaging the entire region of interest, especially near and far field structures. Other options involve an ultrasound probe with a hollow central bore (Chen et al 1993) or an optically transparent acoustic detector (Laufer et al 2009), both of which provide reflection-mode illumination. However, this approach requires an extensive redesign of the ultrasound probe and cannot be easily integrated into standard clinical scanners. This design also fails to provide ideal illumination into tissue.
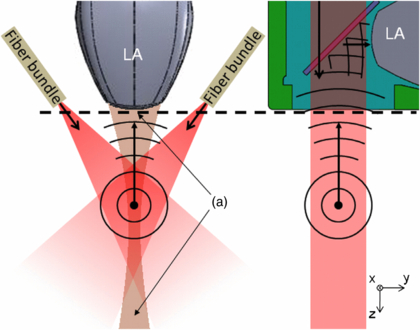
Figure 1. Two illumination schemes for PAI. (left) Standard dark-field illumination in a scattering medium using angled fiber bundles. (right) A direct illumination scheme using the PED. The first method has a longer optical path length to the acoustic imaging plane (tan) and contains undesirable dark regions (a). The PED (see figure 2 for more details) illuminates the entire imaging plane of the ultrasound linear array (LA) using the shortest optical path, which reduces loss due to scatter.
Download figure:
Standard imageThis project describes the photoacoustic enabling device (PED), an attachment designed for facilitating and improving PAI using a standard linear ultrasound array. The PED features an optically transparent acoustic reflector that allows for direct illumination into the imaging plane of the ultrasound transducer for PAI (figure 1, right). Preliminary studies indicate that the PED potentially provides a simple and low cost solution for integrating PAI with pulse echo (PE) imaging during a routine breast exam (Montilla et al 2010a, 2010b). The goals of this project are to (1) quantify the optical and acoustic properties of the PED, (2) compare the performance of the PED with a standard fiber bundle, dark-field illumination in scattering and non-scattering media, and (3) demonstrate dual modality PA and PE imaging in a live mouse with a pancreatic tumor. The results indicate that, compared to the more standard approach, the PED offers efficient light delivery and improved performance for PAI. The improved sensitivity and more uniform illumination pattern offered by the PED potentially facilitates routine screening for breast cancer using a dual modality PE and PA imaging system.
2. Material and methods
2.1. Design and fabrication of the PED
The PED was designed to attach to a linear array and featured an optically transparent acoustic reflector for delivering light and redirecting the PA waves to the ultrasound array, similar to previous work with a single element (Ranasinghesagara et al 2009, Maslov et al 2008, Rao et al 2010, Shi et al 2010). The design was generated using SolidWorks™ (Dassault Systèmes SolidWorks, Concord, MA), which allowed for rapid prototyping using a 3D printer (Connex350™; Objet, Billerica, MA) and a compatible rigid material (FullCure®720; Objet). The design (figure 2) incorporated a form-fitting mount specific to a clinical 10 MHz linear ultrasound array (L10–5; Zonare Medical Systems, Mountain View, CA). The optical subassembly, contained within an exchangeable tube, consisted of a standard SMA connector (figure 2(a)) for coupling to an optical fiber and a cylindrical or spherical lens (figure 2(b)) for controlling the illumination pattern. A glass plate (figure 2(f)) mounted in a water-filled chamber inside the PED acted as a perfect reflector of the ultrasound waves generated in tissue (Witte et al 2011). Two screws held the PED to the linear array. A thin film of petroleum jelly was used to form a watertight seal between the PED and the linear array. The inner chamber of the PED was filled with water for acoustic coupling through a small drain hole placed in the corner of the device. (figure 2(g)) An optically transparent acoustic membrane (Tegaderm™; 3M, St. Paul, MN) (figure 2(d)), affixed to the open front surface of the device provided the interface between the PED and tissue (figure 3). The total fabrication cost for the PED, including mechanical and optical components and 3D printing, was less than $200.
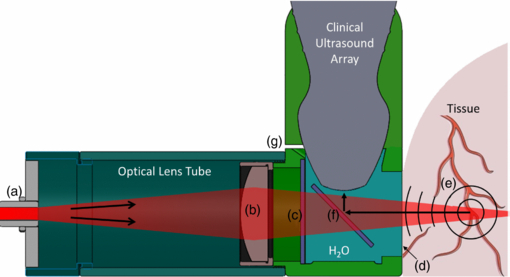
Figure 2. Cross-sectional view of the PED design as an attachment to a clinical ultrasound probe, providing simultaneous PA and PE imaging. Light enters the PED via a fiber optic connector (a) and propagates from left to right through the modifiable optical lens tube, which contains a cylindrical focusing lens (b). Light then passes through a glass window (c) and a thin transparent membrane (d) (Tegaderm™), which helps seal the acoustic coupling fluid (i.e. water). Light absorbing structures (e) within the tissue emit PA waves that propagate back through the membrane, reflect 90° off the glass plate (f) and are detected by the ultrasound array. The small drain hole (g) allows for the exchange of fluid in the liquid chamber.
Download figure:
Standard image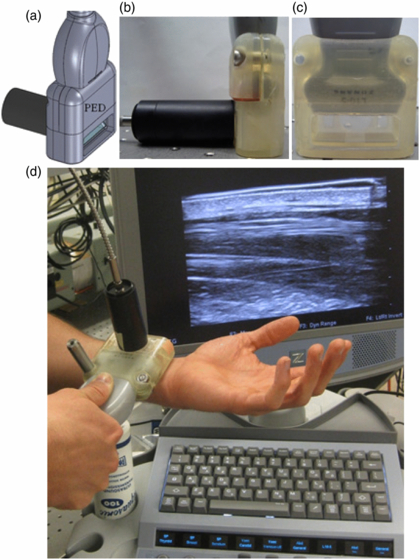
Figure 3. (a) 3D SolidWorks™ design of the PED, including optical fiber coupling. Side (b) and front (c) view. An acoustic membrane separates the coupling liquid inside the device from the tissue. The optical tube assembly was removed for the photograph in (c) to help visualize the optical transparency. (d) Photograph of the PED during PE imaging, featuring the L10–5 linear ultrasound array and Zonare Medical Systems z.one ultra Ultrasound System. The metal post was used to secure the probe to a translation stage for 3D imaging.
Download figure:
Standard image2.2. Photoacoustic and ultrasound imaging: instrumentation, data acquisition and analysis
A flow diagram for collecting PAI is displayed in figure 4. A pulsed laser source coupled to an optical parametric oscillator (OPO) (532 nm Surelite™ I-20 and OPO Plus; Continuum®, Santa Clara, CA), produced wavelength-tunable pulses at 20 Hz. The laser pulses coupled into a 1.5 mm diameter optical fiber (CeramOptec®, East Longmeadow, MA) and the other end connected to the PED optical lens tube. A clinical scanner (z.one ultra; Zonare Medical Systems) recorded both phase and amplitude radiofrequency data on 64 channels in parallel (Olafsson et al 2009). This system collects B-mode PA images at a frame rate of up to 20 Hz, limited by the pulse repetition rate of the laser. The PE ultrasound images were simultaneously obtained by triggering the scanner to transmit plane waves synchronized with the laser pulse. As a proof-of-concept for scanners with 3D capability, volume images were also acquired by collecting B-mode frames while translating the PED assembly with a linear motor (XSlide™; Velmex, Bloomfield, NY). Synchronization between the laser and ultrasound scanner was controlled by a variable pulse generator (9520; Quantum Composers®, Bozeman, MT). Data from the scanner was transferred via Ethernet to a PC running Matlab™ (Mathworks, Natick, MA) for post processing and display. Conventional sum-delay beamforming was also performed depending on the one-way (for PA) or two-way propagation (for PE) of the acoustic waves.
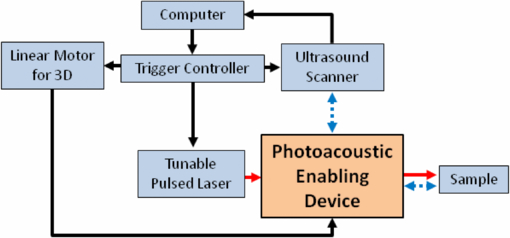
Figure 4. Block diagram of experimental setup. Components include: ultrasound scanner, 10 MHz ultrasound array (L10–5), wavelength tunable pulsed laser (5 ns, 700–950 nm), trigger controller, linear motor for 3D imaging with a linear array and a computer for post processing display. Lines represent the triggers (solid black), optical pulse (solid red), ultrasound propagation (dotted blue).
Download figure:
Standard image2.3. Quantifying acoustic transmission through the PED
We developed a bench top setup to measure the acoustic loss through the PED. No acoustic loss was expected from the acoustic reflector (figure 2(f)) due to total internal reflection above the calculated critical angle of 14°. We measured the acoustic intensity reflected from a centimeter thick steel plate in water with and without the PED (figures 5(a)–(b)). The acoustic backscatter was recorded at eight different near-orthogonal angles between the ultrasound probe and the steel block. This helped ensure that measurements were collected at the same orientation for each measurement (figure 5(c)). A Velmex™ B5990TS motorized rotary table rotated the transducer over a 10° range at 0.5° increments from the estimated orthogonal position. Per cent loss was calculated based on the difference in the peak acoustic intensity with and without the PED.
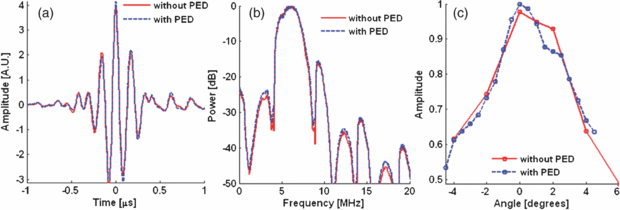
Figure 5. Comparison of acoustic propagation with (dashed blue) and without (solid red) the PED in PE mode. (a) A typical A-line signal at normal incidence from a steel plate. (b) Frequency response with and without the PED. (c) Maximum amplitude of the received echo at different angles with and without the PED. Loss through the PED was estimated at normal incidence (i.e., 0°).
Download figure:
Standard image2.4. Quantifying optical transmission through the PED
Optical loss through the PED was determined by measuring laser energy transmission in the range of 700 to 950 nm. This was compared with the theoretical optical transmission through the PED based on the absorption coefficient of water at the same wavelengths (Palmer and Williams 1974), 2.2 cm length of the water column, Fresnel reflection-coefficients of glass and the empirical transmittance of Tegaderm™.
2.5. Comparing the photoacoustic signal amplitude for the fiber bundle assembly and the PED
The amplitude of the PA signal using the standard dark field illumination scheme was compared with the on-axis illumination using the PED. A custom adapter attached to the 10 MHz probe held the ends of a bifurcated fiber bundle (NA .22) (±35° with respect to the probe) and directed the laser pulse toward the elevational focus of the ultrasound probe (17.5 mm from the probe surface). By contrast, the PED produced a collimated optical beam. PA signals from a black steel plate (1 cm thick) were collected as the plate was scanned away from the transducer using both illumination methods. For the initial test in a nonscattering media, the steel block was placed in water. To further evaluate the two methods in a scattering medium, the experiment was repeated using optical scattering that mimicked properties of breast tissue. The steel block was placed in a solution composed of 0.62% Intralipid® in water, yielding a reduced optical scattering coefficient (µs') of approximately 6.2 cm−1 (van Staveren et al 1991). The laser energy was measured at the output of each device to normalize the data based on the energy incident on the surface.
2.6. Real-time photoacoustic and ultrasound imaging using the PED
One of our goals was to demonstrate dual modality PA and PE imaging in vivo. Hence, we used the PED to image a mouse model of human pancreatic cancer. Panc-1 human pancreatic cancer cells were implanted in the flank of a severe combined immunodeficient mouse. Imaging occurred after six weeks when a tumor grew to approximately 5 mm in diameter. The mouse protocol was in accordance with the University of Arizona Institutional Animal Care and Use Committee. The PED assembly was placed above the anesthetized mouse (isoflurane 1–2%) and coupled with ultrasonic gel. Cross sectional PE and PA images of the tumor were acquired. Laser fluence at the surface of the mouse was 15 mJ cm−2. Scanning the mouse 10 mm perpendicular to the imaging plane provided volumetric data. The PED simultaneously collected PE and PA data with images automatically co-registered.
3. Results
3.1. Acoustic transmission through the PED
Acoustic loss through the PED was negligible, consistent with total internal reflection theory (figure 5). Acoustic loss at 10 MHz was approximately zero (−0.2% ± 0.1%). The acoustic loss across the entire frequency spectrum of the ultrasound transducer (5–10 MHz) was also insignificant. These results closely agree with the theoretical calculation by Ranasinghesagara et al (2009) using a fused quartz prism coupled with a single-element transducer.
3.2. Optical transmission through the PED
The net transmission of light through the PED was measured to be above 80% for wavelengths between 700 nm and 900 nm (figure 6). Using a model based on Fresnel-reflection theory, the measured transmittance of Tegaderm™ and published water absorption coefficients, we computed the total theoretical optical loss through the PED to be 20.4%. This includes a 0.8% loss through the cylindrical lens, 4.9% loss entering the PED water chamber, 2.4% through the acoustic reflector, 4.1% through the Tegaderm™ and 9.6% from water absorption. Of these losses, the only surface where a PA signal was observed was at the Tegaderm™. Water absorption is the single largest contributing factor to the total PED transmission and explains the drop in transmission above 900 nm. At higher wavelengths, other optically and acoustically transparent coupling fluids, such as silicone oil, may be suitable alternatives (Maslov et al 2008).
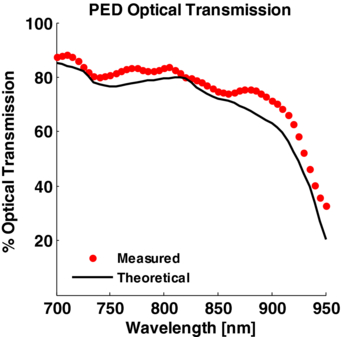
Figure 6. Characterization of light propagation through PED filled with water as a function of optical wavelength. The dotted red symbols denote the spectral transmission of the laser through the device (average of eight laser pulses). The solid black line is the theoretical transmission of light through a 2.4 cm column of water, accounting for water absorption and the calculated 11.9% reflection loss through the interfaces of the PED.
Download figure:
Standard image3.3. Effect of the illumination pattern on the photoacoustic signal
Figure 7 demonstrates that in a non-optically scattering medium the PED generated a larger PA signal at all depths compared to the off-axis fiber bundle illumination. Moreover, the amplitude of the PA signal was similar at all depths, consistent with the collimated illumination pattern of the PED. The PA signal from the fiber bundle reached a maximum at a depth of 20 mm, corresponding to the combination of the elevational focus of the ultrasound transducer and the highest optical fluence where light crossed the imaging plane (see figure 1).

Figure 7. PA signal at 800 nm from a strongly absorbing plate as a function of depth using the two illumination methods in a non-optically scattering medium (water). The PA signal was normalized to the light energy at the surface of the imaging target, which for this example was 6.2 mJ for the PED and 7.6 mJ for the fiber bundle. Differences in the signal amplitudes are primarily due to differences in the illumination pattern between the PED and fiber bundle configurations. Whereas the PED provided collimated light and a uniform illumination pattern through the entire imaging plane of the ultrasound transducer, the bundle produced less efficient illumination, especially outside the elevational focal depth of 17.5 mm.
Download figure:
Standard imageIn this experiment, the diverging light from the fiber bundle explains the shape of the curve for the fiber bundle in figure 7. If the divergence angle of the fiber bundle were to increase, the corresponding curve would drop in peak power and widen with respect to depth. Conversely, if the fiber bundle were collimated, the power versus depth curve would narrow and the peak power would increase, indicating the fiber bundle would be more depth specific.
Results of the same illumination experiment in an optically scattering medium (figure 8) demonstrate a remarkable enhancement in the PA signal using the PED. An 18, 14 and 6 dB signal improvement were measured at the 5, 10, and 20 mm depths, respectively. The strong PA signal recorded by the PED in the first 20 mm was primarily due to the highly efficient in-line illumination pattern compared to the optical bundle. At greater depths, optical scattering dominated, and the PA signal decayed exponentially. Even though the fiber bundle uses diverging light compared to the collimated illumination pattern of the PED, the total surface area illuminated by the fiber bundle (1.6 cm2) is comparable to that from the PED (2.3 cm2). The scattering effect of the medium is a dominant factor at increasing depths. Nonetheless, the collimated output of the PED provides the shortest optical path length and an improvement compared to the dark-field illumination.
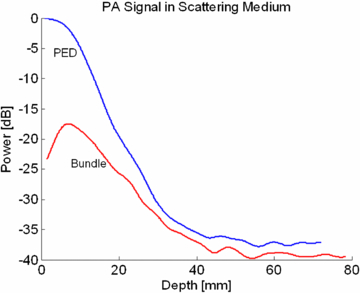
Figure 8. PA signal at 800 nm from a strongly absorbing plate as a function of depth using the two illumination methods in an optically scattering medium (µs' = 6.2 cm−1) similar to breast tissue. The PA signal from the PED at 20 mm is 6 dB higher after normalizing for the measured energy incident on the surface of the target. This is due to the efficient light delivery of the PED throughout the imaging plane of the ultrasound transducer. This is similar to the results of figure 7, except that the effect of optical scattering produces a decay of the optical transmission through the sample.
Download figure:
Standard image3.4. Real-time photoacoustic and ultrasound imaging using the PED
The system allowed for real-time B-mode PA and PE imaging, and volumetric data sets could be acquired in 5 s. PA and PE images were acquired from the mouse skin surface to structures below the tumor, as displayed in figure 9. The tumor is easily identified in the PE image due to the protrusion at the skin surface and decrease of the PE speckle in the center of the tumor. This hypoechoic region is consistent with an oxygen-deprived necrotic core often seen in late-stage tumors. The PE images also provide an anatomical frame of reference for the co-registered PA images (figures 9(a)–(c)). At 800 nm illumination, blood is the predominant absorber in the tissue. The different orthogonal sections through the mouse tumor reveal strong PA signals at the surface of the skin and a region around the center of the tumor. The strongest signals (11 dB over background) appear near the tumor at a depth of 3 mm. Increased vascularization on the perimeter of the tumor is consistent with angiogenesis often associated with growth of many tumors. Volumetric 3D imaging that combines PA and PE on a single scan potentially provides valuable and complementary diagnostic information for early cancer detection.
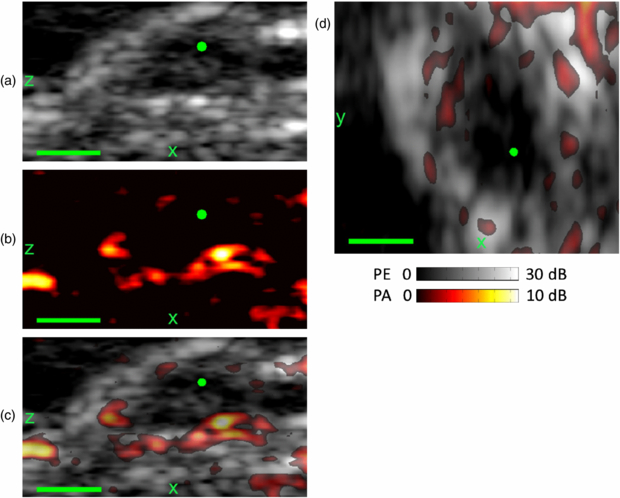
Figure 9. The PED was used to obtain in vivo PE (gray) and PA images at 800 nm (hot) of a tumor and surrounding region grown from Panc-1 pancreatic cancer cells six weeks after cell implantation in a mouse. Sagittal (xz) plane through the crest of the tumor for PE (a), PA (b), and superimposed (c) images. (d) Transverse (xy) superimposed PE and PA images at the tumor periphery. PA signals are detected throughout the thickness of the mouse-–from the skin surface to below the tumor. The apparent protrusion and hypoechoic region on the PE ((a), (c)) and the blood vessels at the perimeter of the tumor ((b)–(d)) each provide complementary information regarding the tumor and surround tissue. The green dot corresponds to the common point in each plane. Scale bar denotes 2 mm.
Download figure:
Standard image4. Discussion
This study described the PED, a device that facilitates PAI using a standard clinical ultrasound array and improves performance compared to traditional dark-field illumination methods. The tremendous 18 dB increase in sensitivity 5 mm deep into scattering medium expands the potential for translational research in PAI. Erpelding et al (2010), for example, imaged rat sentinel lymph nodes and lymphatic vessels 5 mm deep. Furthermore, the order of magnitude improvement of the PA signal in the first 5 millimeters opens doors for a variety of diagnostic applications, such as imaging deep polyps under the skin. Such depth has typically been difficult to extract optical properties with sub-mm spatial resolution.
We successfully transformed a standard clinical ultrasound array into a dual modality PA and PE in vivo imaging probe. As an add-on solution to an existing ultrasound array, the PED may be especially important to explore new imaging solutions that may not be possible with routine ultrasound PE imaging. Moreover, the simple and inexpensive design of the PED can be easily modified to function with most linear arrays. The PED can ultimately complement routine ultrasound breast exams (PE) by adding valuable vascular context (PA). This device might make clinical trials involving PAI more feasible.
Our latest PED prototype still presents hurdles to address before widespread acceptance in the clinic is possible. Sonographers may not be accustomed to the unorthodox 90° orientation of the probe relative to tissue. However, we are exploring new design options that remove this restriction, and future prototypes may operate using a standard orientation. In addition, B-mode data was collected in real-time, but signal processing was performed offline. We are working with Zonare Medical Systems to perform all beamforming, signal processing, and display in real-time on their clinical platform. Finally, all components of the PE and PAI system are portable, except for the tunable laser source employed for the PAI experiments. However, alternative light sources (e.g., laser diodes, LEDs) capable of fiber coupling have been demonstrated for PAI (Allen and Beard 2007). The PED provides an important first step towards a truly portable dual modality system transforming diagnostic imaging capabilities in the clinic for cancer detection and other applications.
The PED offers a simple, inexpensive solution for interfacing standard clinical ultrasound transducers for PAI. This approach provides efficient illumination with optical fiber coupling and potentially adds important diagnostic information related to tissue microvascularity and blood oxygen saturation during a routine ultrasound exam (Zhang et al 2007, Li et al 2008). A complementary dual modality system capable of PE and PAI activated by a simple switch on the ultrasound probe will enhance screening for cancer at its earliest stage and may reduce unnecessary biopsies. Simple modifications to the generic design will make the PED compatible for most linear ultrasound arrays on the market. Moreover, although we used collimated light for this study, the optical assembly of the PED allows for custom illumination patterns depending on the clinical application and required depth. Finally, the PED efficiently transmits visible and near infrared wavelengths. When combined with PA contrast agents, this opens new avenues for targeted molecular imaging of key tumor cell receptors associated with a variety of diseases, including metastatic breast cancer (Li et al 2008). The PED may facilitate translation of PA technology to patients for improved cancer prognosis.
Acknowledgments
Special thanks to Dr Mark Pagel and the Experimental Mouse Shared Service in the Arizona Cancer Center for assistance with the mouse preparation. Special thanks also to Derek DeBusschere and Zonare Medical Systems for their technical assistance with the ultrasound scanner. This work was supported in part by funding from the National Science Foundation (NSF-0853618), Better Than Ever Program and Arizona Cancer Center.