

Abstract
This paper describes the development of a small-sized reactive plasma pump driven by capillary bubble discharge for the purification of treated water. The apparatus we developed decomposes the pollutants in the water by using chemical species generated by the plasma discharge. The resulting stream of bubbles obviates the need for an external gas supply or pump to transport the water. A high-speed camera was used to investigate the bubble dynamics responsible for the pumping effect, which is achieved by selecting the shape of the capillary such that the bubble ejections within enhance the 'self-repetition' action required for the pumping motion. Our experiments showed that optimal bubble generation requires a consumed power of 17.8 W. A theoretical model was developed to investigate the pumping mechanism. We solve the problems associated with liquid oscillations in the U-shaped water reservoir by employing a non-uniform cross-sectional area in our model. The chemical reactivity of the device was confirmed by using emission spectroscopy of OH radical and by measuring the decomposition of methylene blue.
Export citation and abstract BibTeX RIS
1. Introduction
In recent years, various studies have been carried out to investigate water decontamination and purification using underwater plasma in response to a worldwide demand for clean water [1, 2]. Thus, it is known that the high chemical reactivity of free radicals generated by non-thermal plasma can decompose pollutants, such as persistent organic pollutant (POP), in water [3, 4]. These pollutants are dispersed throughout the entire ocean [5, 6]. Furthermore, sterilization effect of plasma is gathering attention in the field of food industry and plasma medicine [7, 8].
On the other hand, large equipment is unsuitable for the application of plasma treatment at household level. As reported in this decade [9–14], diaphragm discharge and capillary discharge are efficient for water treatment because this method does not require an external gas supply. The capillary discharge method relies on the application of DC voltage to generate a vapour bubble in the capillary because of Joule heating. Then, electrical breakdown is initiated in the bubble. A continuous discharge and bubble movement lead to the termination of the discharge state. The discharge is interrupted and the whole process is repeated. Because this method can operate as a pulse regime, the input energy is low. However, when these methods are applied to water purification, an external pump is needed to transport the water being treated.
Against this background, we developed a small-sized reactive plasma pump, which has the ability to transport a liquid by utilising vaporised bubble motion with the discharge inside the capillary. Because of the surface tension exerted on the air–liquid interface, the liquid in the capillary experiences a force in the direction of the air. The magnitude of the force is in inverse proportion to the diameter of the capillary. Hence, by combining two capillaries with different diameters, it is possible to generate a one-directional flow toward the large-sized capillary [15].
The operation of our pump is based on the Laplace pressure difference resulting from the change in the capillary diameter. The self-repetition property of bubble motion is well utilised to the apparatus [16]. The apparatus does not require an external pump to transport treated water. Furthermore, the major components of the present apparatus are the electrodes, reservoirs, and part containing the capillary. This simplicity is a great advantage in terms of portability and for application at the household level.
This paper presents the results of our investigation of the fundamental mechanism of the pumping effect, which we studied by analysing the relationship between the electrical waveform and optically observed bubble behaviours. In addition, we clarified the dependence of the pumping performance on the applied voltage level.
On the other hand, the advantage of the present apparatus, that is to say, the simple structure of the apparatus, does not allow us to conduct an elemental evaluation of the pump performance by measuring the flow rate with changing the hydraulic head [17, 18]. Although the pumping action is driven by the repetition of the pumping cycle, it is difficult to measure the pumping activity in a single cycle because of its fast operation and the structure of the apparatus.
Therefore, the pumping performance is evaluated by continuous operation and the development of a theoretical model based on the fundamental mechanism presented in section 3.1. A comparison of the experimental data and theoretical model showed that the dependence of the pump performance on the applied voltage level results from the time required for generating the bubble. Consequently, an optimal operating voltage is proposed.
Furthermore, the water purification performance of the apparatus was confirmed by using optical emission spectrometry to measure OH generation. In addition, a methylene blue solution was used to examine the decomposition activity.
2. Experimental setup
Figure 1 shows a schematic representation of the proposed reactive plasma pump. Two reservoirs are connected with a capillary part consisting of two glass pipes as shown in figure 2. The reservoirs have a cylindrical shape. The diameter of a reservoir should be enough small for observing the motion of liquid surface accurately. On the other hand, the capillary should be enough thin to concentrate the electric current for generating the bubble in the capillary. In our experiment, the cross-sectional area of the reservoir is SR = π = 133 mm2.

Figure 1. Schematic of experimental setup.
Download figure:
Standard image High-resolution image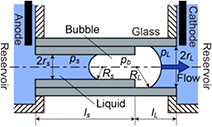
Figure 2. Detail of the capillary part with a bubble inside the glass tube. Bubble moves from left to right.
Download figure:
Standard image High-resolution imageThe potential difference was applied using a high-voltage amplifier (HAR-20R60, MATSUSADA PRECISION Inc.). The electric current and voltage were measured by a current probe (TCP312, Tektronix, Inc.) and a voltage probe (P6015A, Tektronix, Inc.), respectively. A DC voltage is applied between the stainless steel electrodes located in both reservoirs. The voltage is concentrated at the capillary part because of the high electrical resistance of the small diameter capillary. The current flow associated with the applied voltage generates a vaporized bubble inside the capillary part by Joule heating. The behaviour of the bubble that was generated in this way and the discharge inside the bubble were observed by high-speed camera (FASTCAM SA-X2, Photron). The camera recording was synchronised with the discharge waveform through the oscilloscope (GDS3724, NF, Inc.). As a protective measure, 100 kΩ resistance was employed because the discharge allows huge electric current flows in the circuit. The working liquid is a solution of sodium chloride in distilled water with a conductivity of 1.0 mS cm−1. It is difficult to operate the present device with ultra pure water. However, pollutant water basically contains contaminating materials and the conductivity is higher than pure water, which enhances the pump performance. The pumping performance was evaluated by measuring the growth of the hydraulic head in between the reservoirs. The position of the liquid surface is measured from images recorded by the digital camera (Nikon D5500).
Figure 2 shows an enlargement of the part containing the capillary consisting of two glass tubes with different diameters. These two tubes were bonded coaxially using poly(dimethylsiloxane) to form a capillary with an abrupt expansion. The reservoirs on the left and right were each provided with an electrode, i.e. the anode and cathode, respectively. The length and radius of the two capillaries, ls, lL, rs, and rL are 25.0, 5.0, 1.0, and 2.0 mm, respectively.
The occurrence of Joule heating in the capillary for an extended period increases the temperature of the liquid in the whole system. The measuring error due to evaporation from the liquid surface in the reservoirs was reduced by limiting the period during which the voltage was applied to 120 s. All the experiments were conducted under atmospheric pressure and at room temperature.
3. Results and discussion
3.1. Fundamentals of capillary discharge and bubble behaviour
First, the fundamental phenomena of capillary discharge and bubble motions are described in this section.
Figures 3 and 4 show the electric waveform and corresponding bubble behaviour, respectively. The state without a bubble in the capillary is set to be 0 s (figures 3 and 4(a)). A bubble is generated by Joule heating caused by the high current density in the capillary (figure 4(b)). The bubble enhances the electrical resistance in the circuit and reduces the current flow (figure 3(c)). The current is low and the voltage is 3.7 kV since the bubble functions as a resistor. Then, the volume of the bubble decreases as the electric current decreases. The bubble shrinks and moves to the right (figures 3 and 4(d)). Eventually, the right-hand edge of the bubble interface reaches the right-hand side of the reservoir. Then, the bubble is ejected from the capillary into the reservoir (figure 4(e)). In the figure, the bubble interfaces are observed to have moved. The multiple current spikes around 0.22 s indicate a discharges in the bubble.
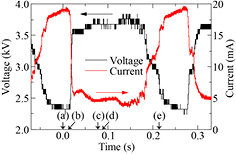
Figure 3. Electric waveforms at an applied voltage of 3.7 kV.
Download figure:
Standard image High-resolution image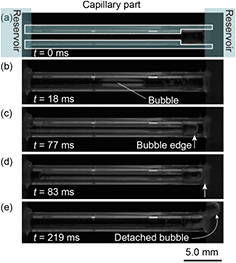
Figure 4. Sequential photo of bubble behaviour and discharge in the capillary part. Flow is generated from left to right.
Download figure:
Standard image High-resolution imageThe capillary is filled with water again at t = 0.25 s because of bubble movement. Then, the new bubble that is generated again promotes a rapid reduction in the current at around t = 0.3 s in figure 3. The duration of the period in which the current decreases is considered to be the interval between the moment at which the bubble is ejected (i.e. the termination of the discharge) and the generation of the next bubble. In the case of figure 3, this period was 50 ms [12]. Inside the capillary, transportation of the liquid is achieved by the bubble motion. Note that, because the current density is concentrated in the smaller capillary, bubbles are generated near the abrupt part in the capillary. This cycle is repeated with liquid continuously being transported along with the bubble motion while the voltage is applied. The mechanism of the one-directional bubble movement observed in figure 4 is explained as follows. The basic concept has its origins in the difference in the Laplace pressure that occurs because of the difference in the diameter of the glass tubes [15]. When a bubble exists in a capillary as depicted in figure 2, a pressure difference between the inside of the bubble and the surrounding liquid, which is known as the Laplace pressure, is generated due to surface tension. Employing the symbols used in figure 2, the pressure equivalents are as below [15]:
Here, σ denotes the liquid surface tension coefficient, pb denotes the vapour pressure in the bubble, and Rs and RL denote the curvature radius of the bubble surface in the small-sized and large-sized capillary, respectively. Assuming that the axial symmetry and the vapour pressure are uniform in a bubble, equation (1) can be transformed as below.
Equation (2) means that the difference in the capillary diameters causes a pressure difference in the bubble. When the radius of the small capillary, rs, is smaller than that of the large capillary, rL, pL is greater than ps because of the relation between the capillary radius and the liquid surface curvature. That is to say, the right-hand side reservoir can hold a liquid that corresponds to the difference between these pressures. From equation (2) it is expected that enlarging the difference in between the capillary diameters is effective to enhance the pumping force.
For voltages below 3 kV, no bubble generation and discharge was observed, because the current does not produce sufficient Joule heating to generate a bubble.
Figure 5 shows the electric waveforms in 2.0 s. The constant pulse-like waveforms are observed. These each pulses are corresponding to bubble motions. Then, the liquid is transported along with the sequential bubble ejection.
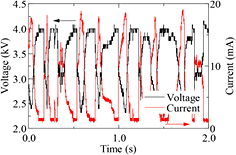
Figure 5. Electric waveforms at an applied voltage of 4.0 kV in 2.0 s.
Download figure:
Standard image High-resolution imageFigure 6 shows the consumed power, P, obtained by the measured voltage and current. The power increases linearly as the voltage increases. The data are organized in terms of the power dependence instead of applied voltage from next section.
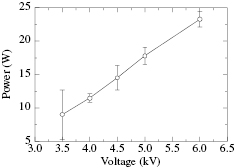
Figure 6. Consumed power with various voltages.
Download figure:
Standard image High-resolution image3.2. Pumping performance of device
This section presents the mechanism and an evaluation of the continuous pumping performance. The present pump is a system consisting of a reservoir and electrodes. From the viewpoint of applications, the advantage of this pump is that it can be assembled in a device without the need to install additional apparatus. It is also easy to fabricate because of its simple structure.
However, from an experimental point of view, it is difficult to evaluate the performance of this pump by using the typical validation method, which involves the use of a Q–H curve obtained by measuring the flow rate with a different head [17, 18].
Furthermore, the pump is driven by repeated bubble motion in a capillary. The driving force behind the pump operation, the Laplace pressure difference, is difficult to measure because of its small size and the short lifetime of the bubble in the capillary. In other words, it is difficult to evaluate the performance by observing the behaviour of a single bubble.
Therefore, the pump performance was evaluated by conducting a continuous operation. Additionally, we developed a theoretical model to investigate the mechanism of the pump based on the phenomena described in section 3.1.
Figure 7 shows the time variation of the transported amount of solution with various consumed power from 8.3 to 23.3 W. The transported amount was calculated by determining the hydraulic head difference, which is obtained by measuring the difference between the heights of the liquid surfaces of the two reservoirs (illustrated in figure 1). The amount that is transported increases with the evolution of time under all conditions. Converging behaviour is clearly observed for P = 14.5 and 17.8 W (figure 7). Furthermore, the rate at which the transportation amount increases with respect to time exceeds that at which the voltage increases except for the case of P = 23.3 W. This tendency was confirmed by calculating the initial flow rate as indicated by the gradients of the plotted lines in figure 7. The flow rate is a function of time because the head difference increases with the operation of the apparatus. The initial flow rate is the flow rate at which the pressure difference of the head is zero.
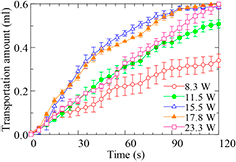
Figure 7. Time evolution of transported amount of solution with P = 8.3–23.3 kV. Error bars indicate the standard error.
Download figure:
Standard image High-resolution imageFigure 8 shows the initial flow rates for various applied voltages. Here, the initial flow rate is defined as the flow rate at which the pressure difference is zero, that is to say, the first 10 s that have elapsed after application of the voltage. The flow rate was found to increase as a function of increasing consumed power until 17.8 W. The results agreed with our estimation described in figure 7.
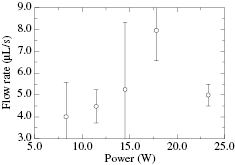
Figure 8. Initial flow rates for various consumed power obtained for the first 10 s in figure 7. Error bars indicate the standard error.
Download figure:
Standard image High-resolution imageThis result of the pump performance per unit power (8 µl s−1 at 17.8 W) is corresponding to 32% of earlier study (8 ml min−1 at 96 W) [13]. However, since our device can be operated by lower power, it is expected that easily apply to the small device and house-hold level.
Figure 9 shows the pressure difference when various voltage levels are applied for a period of 120 s, which is another important performance indicator of the pump. The head difference after 120 s is converted into pressure by using a cross-sectional area of the reservoirs, SR, for the calculation. Note that, as we mentioned before, the voltage application is limited to a period of 120 s to avoid excessive evaporation by long-time Joule heating. The temperature of the liquid in the reservoir was measured by using thermocouple thermometer (AD-5614, A&D Company, Ltd.). The temperature increases to 58.5 °C from 27.1 °C in the 120 s operation with 14.5 W.

Figure 9. Pressure difference obtained from the difference in liquid surface heights. Error bars indicate the maximum and minimum values.
Download figure:
Standard image High-resolution imageThe pressure difference increases with voltage. In other words, the time required to reach the maximum pressure difference decreases with increasing voltage.
The results in figures 7–9 enable us to conclude that as the voltage increases, the time required to reach the maximum pressure difference decreases when the voltage ranges from 8.3 to 17.8 W. The reason for the characteristic tendency at P = 23.3 W is explained at the end of section 3.3.
The result is explained as follows. The pumping effect is caused by repetition of the bubble-ejecting cycle. During the stage of Joule heating, the pressure difference caused by a bubble does not exist because of the absence of a bubble in the tube. After several seconds of operation, a difference in the water surface occurs. During the Joule heating stage, the head generates an inverse flow in the capillary (from right to left) until the next bubble is generated and stacking commences.
As is shown in figure 9, the pressure difference increases with voltage and converges to about 90 Pa. The value indicates the maximum pressure generated by the pump based on the Laplace pressure difference. An increase in the applied voltage allows a higher current to flow through the capillary. Then, faster bubble generation introduced by a higher Joule heating reduces the duration of the inverse flow. The detail of the mechanism is supported by the developed theory described in section 3.3.
3.3. Theoretical model for the liquid transportation
Here, we describe the theoretical model we developed to investigate the mechanism of the pump. The model, which is based on section 3.1, was developed with the aim of confirming the details of the tendencies displayed in figures 7–9.
Consider figure 10, which shows the streaming tube consisting of two reservoirs and the smoothly connected capillary part. The transportation of the liquid is considered as a set of U-shaped tube oscillation problems with different cross-sectional areas. The abrupt expansion in the capillary is ignored here. The tube is open at both ends to air. The phenomena associated with the pumping mechanism are simplified by considering the pressure difference, plap, explained in section 3.1, instead of the bubble motion responsible for generating the pumping activity in the capillary.
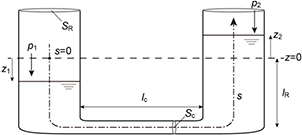
Figure 10. Theoretical model for the discharge pump system as represented by a U-shaped tube with a non-uniform cross-sectional area.
Download figure:
Standard image High-resolution imageLet z be the position of the surface of the liquid and let z = 0 be the liquid surface position when the fluid is at rest. Then cross-sectional area S(s) of the tube can be defined as below, where s (dashed–dotted line) is the streamline direction along with the modelled tube,
where, lR, SR, lc, and Sc, denote the length and cross sectional area of the capillary part and reservoir, with the subscripts 'R' and 'c' denoting Reservoir and Capillary, respectively.
The relation between the velocity potential function ϕ(s, t) and p is described in equation (4) as an unsteady irrotational Bernoulli equation.
where f(t) and q denote a function of time and flow velocity, respectively. The velocity q is a function of s and t, which is denoted by  where flow rate Q and cross sectional area S, ϕ are described as below,
Hence, equation (4) is described as follows.

When applying equation (6), between s = s1 and s = s2,
When the height of the water surface changes within the reservoir part, S1 = S2 = SR. The pumping pressure caused by the Laplace pressure difference is assumed to be the pressure difference of p1 − p2 = pLap. From condition (3), the integral of the area along s in equation (6) is described as below,
When ζ is the transported liquid volume from the static condition,  and
and  .
.
z1 and z2 are the liquid surface positions for the reservoirs on the left and on the right, respectively. Substitute the relation  and equation (7), then equation (6) is as below,

Therefore, the governing equation is described as below.

where k1 and k2 are constants including the parameters of the apparatus size. The general solution of the differential equation (9) is obtained as below.
where C1, C2, and C3 are integral constants. Next, the repetition of the cycle, which generates the pumping performance, is considered as follows.
- Stage-1. Liquid is transported because of Laplace pressure difference until the surface on the left side of the bubble reaches the abrupt part in the capillary (figure 2) within the period of Δt. The amount of transported volume in this period is denoted as ζLap.
- Stage-2. Then, the bubble is ejected into the reservoir on the right. After the bubble is ejected and until the next bubble is generated, inverse flow results from the existence of a head between the two reservoirs. Then after τ s, a new bubble is generated in the capillary and the inverse flow disappears.
Figure 11 illustrates the behaviour of the volume of the transported liquid. The stage during which the bubble moves (several hundreds of ms in figures 3 and 4) is relatively short in comparison with the measurement time (plots with a measurement every 5.0 s in figure 9). Therefore, the plot obtained by measuring the height of the liquid surface should be a solid line. In the nth cycle, ζ increases to ζrn from ζsn during the existence of a bubble in the capillary (Stage-1). After ejection of the bubble, ζ decreases to ζsn+1 by the inverse flow in Stage-2. Here, the subscripts 'r' and 's' represent Reach and Start, respectively.
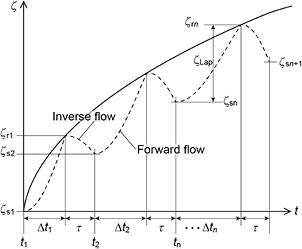
Figure 11. Time evolution of transported amount of liquid by theoretical model. The dashed and solid lines indicate microscopic and macroscopic behaviour, respectively.
Download figure:
Standard image High-resolution imageNext, we solve equation (10) for each nth cycle to obtain ζ as a function of time. First, the part representing the forward direction flow when n = 1, rewriting equation (11) with initial condition of  ,
,
In the inverse flow part, considering the new time axis tinverse,1 = t − (t1 + Δt1), which starts from t1 + Δt1 at zero (see figure 11). Rewriting equation (10) with the initial condition of  , for
, for  ,
,

In the same manner, in the forward flow part, if considering the new time axis tforward, n = t − tn, which starts from tn at zero. Hence, in the nth cycle, ζ is described as below for  .
.

For  ,
,

As is shown in figure 11, when  , in equation (15),
From the definition of our model (Stage-1),  . Therefore, we obtain the general solution of the transportation amount for the nth cycle as
  with respect to n, as follows.
The oscillating motion of the surface in a reservoir is not observed in our measurement within the measuring time scale.
The obtained curve (figure 9) should follow the plots of ζrn. The duration Δtn of Stage-1 satisfies the following equation from equation (14),

The denominator of equation (18) must be non-zero. From the condition of  , the maximum number of n is,
As shown in figure 9, the time t is described by integrating the duration of each cycle,
Equations (17) and (20) indicate the transported amount of liquid and the time as a function of n, respectively.
Figure 12 shows the dependence of heating time τ for ζ. Here, pLap is assumed to be 88.2 Pa as explained below and shown in figure 11. As shown in the graphs, as τ decreases ζ increases at an increasing rate in the model. This result agrees with the tendency of the experimental results when the applied voltage increases except for the case of P = 23.3 W as shown in figure 9.
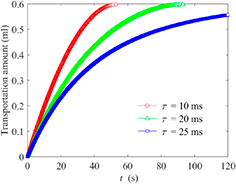
Figure 12. Dependence of τ on ζ in the theoretical model with pLap = 88.2 Pa.
Download figure:
Standard image High-resolution imageNext, as a typical example we focus on the case of 5.0 kV, which achieved maximum pressure difference in the experiment. The data are sufficiently converged in the period of observation. The maximum transported amount after 120 s is 0.59 ml, which corresponds to a pressure difference of 88.2 Pa.
The fitting result obtained when we use pLap = 88.2 Pa, is shown in figure 13 with τ as the fitting parameter. The other values were obtained from the experimental setup as lc = 30 mm, lR = 15 mm, rc = 1.0 mm, rR = 6.5 mm. The amount transported during a cycle ζLap, which originates from the bubble motion in the capillary, is difficult to observe. Here, we assume that ζLap = 7.9 × 10⁻¹⁰ m3, which is calculated when a bubble moves 1 mm in a capillary. When the fitting result was τ = 0.024 s, there is a good agreement with the electrical waveform data in figure 3, which implies that the heating duration is several tens of milliseconds.
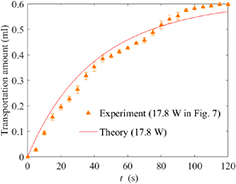
Figure 13. Fitting of theoretical model line with P = 17.8 W
Download figure:
Standard image High-resolution imageThe pumping frequency was obtained from the electric waveforms to confirm this discussion. As is shown in figure 3, the electric current waveform corresponds to the pumping cycle. By counting the pulse-like currents in a unit second, the number of pumping cycle repetitions can be counted as the pumping frequency. Hence, a high frequency corresponds to fast bubble generation.
Figure 14 shows the relationship between the pumping frequency and the flow rate. We defined the number of pulse currents per unit time as the frequency of bubble ejection. The pumping frequency is positively correlated with the flow rate. It is found that, as the frequency increases, in other words, as the heating duration decreases, the flow rate increases as is explained in the discussion above.
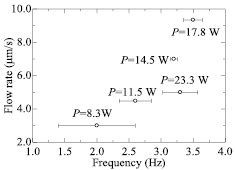
Figure 14. Relationship between pumping frequency and flow rate.
Download figure:
Standard image High-resolution imageAs we described above, a valid explanation is provided in the case of P = 8.3–17.8 W. However, as is shown in figure 7 (red squares), the behaviour of P = 23.3 W is extremely linear and different compared with the other cases. In fact, in the experiments, a strong discharge and many broken bubbles are observed especially at P = 23.3 W. We further investigated this specific discharge by obtaining the electric waveforms.
Figure 15 shows the voltage and current at P = 23.3 W (V = 6.0 kV). It shows the relatively long duration with no current flowing. The observation with the high-speed camera revealed that, the large bubble that was generated reaches the reservoir, the bubble tends not to eject from the capillary part because the Laplace pressure effect does not seem to be valid in the duration. In addition, the strong discharge accompanied with the large current of more than 20 mA complicates the bubble motion.
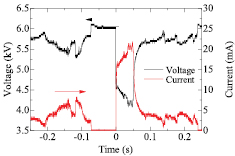
Figure 15. Electric waveforms at an applied voltage of 6.0 kV (P = 23.3 W).
Download figure:
Standard image High-resolution imageTherefore, the difference in the discharge regime is considered to be a factor of the characteristic pumping behaviour at V = 6.0 kV. In such a case, the applied energy is not used efficiently.
Our experiments enabled us to clarify the optimal operating range (3.5–5.0 kV). The most important requirement for device efficiency is to operate within the transient voltage range, i.e. below the voltage that initiates an undesirable discharge. Operation within the appropriate voltage range enables a higher flow rate to be obtained at a higher voltage.
3.4. Chemical reactivity for water purification
Lastly, the purification performance is evaluated.
Figure 16 shows the optical emission from a discharged bubble at V = 4.0 kV recorded by a spectrometer (Ocean Optics USB2000). We observed the typical optical emission spectrum for a capillary discharge within a NaCl solution as reported previously [19]. The spectrum originates from OH radicals at 289 nm and 309 nm and the sodium line at 589 nm is displayed in the spectrum. Hydrogen Hα(3d2D–2p2P0) and Hβ(4d2D–2p2P0) at 656.2 nm and 486.1 nm are observed, respectively. Furthermore, atomic oxygen multiplets OI(3p5P–3s5S0) at 844.6 nm is also observed [20].
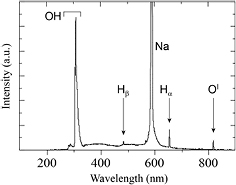
Figure 16. Optical emission spectra of the discharge at V = 4.0 kV.
Download figure:
Standard image High-resolution imageThese peaks indicate the effective chemical activity for decomposing organic material and killing bacteria.
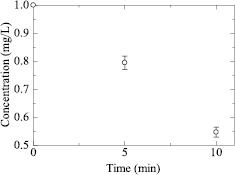
Furthermore, to examine the actual chemical reactivity of the water purification device, the decomposition of methylene blue was studied [21]. 10 ml of NaCl solution containing methylene blue at an initial concentration of 1.0 mg l−1 was prepared. The conductivity of the treated solution was 1.0 mS cm−1. After 5 and 10 min of operation at V = 4.5 kV, the concentration was measured by absorbance measurement system (Multi Direct, AQUALITIC). To measure the methylene blue concentration, the liquid in the both reservoirs was mixed. Therefore, the result indicates the average of right and left reservoirs.
The decomposition rate of 45% in 10 min was obtained as an indicator of water purification performance (figure 17). It is possible to transport treating liquid with decomposing pollutant at the same time by applying the present method to a small device without extra pump or gas supply device. The reservoir capacity is relatively small for measuring the pumping performance. The decomposition efficiency is considered to be related to the reservoir capacity. Therefore, further experiment is needed for optimization.
Figure 17. Decomposition of methylene blue at V = 4.5 kV operation. Error bar indicate a standard deviation.
Download figure:
Standard image High-resolution image
4. Conclusions
The main findings of the research presented in this paper are summarised as follows.
- (1)A small-sized reactive plasma pump driven by bubbles discharged in a capillary was developed as a water purification device. The operation of the apparatus is based on the Laplace pressure difference in bubbles moving between different sized capillaries. Hence, our device is designed such that both water transportation and purification can be achieved without the need for an external gas supply and pump system.
- (2)A theoretical model was developed to confirm the pump mechanism. It was found that an increase in the applied voltage enhances the generation of bubbles. This is attributed to higher Joule heating and increases the flow rate. The bubble generation frequency was found to be the highest at a consumed power of 17.8 W, which was experimentally determined to be the optimal operational condition to maximise the rate of liquid transportation.
- (3)The generation of free radical species for water purification was confirmed by optical emission spectrometry by measuring the ability of the discharge process to decompose methylene blue solution.
Acknowledgment
This work was supported by JSPS KAKENHI Grant Number 26249015 and 15K17966. We would like to thank Mr T Nakajima for variable technical support.