
Abstract
The temporal distribution of the incident fluxes of argon and titanium ions on the substrate during an argon HiPIMS pulse to sputter titanium with pulse lengths between 50 to 400 µs and peak powers up to 6 kW are measured by energy-resolved ion mass spectrometry with a temporal resolution of 2 µs. The data are correlated with time-resolved growth rates and with phase-resolved optical emission spectra. Four ion contributions impinging on the substrate at different times and energies are identified: (i) an initial argon ion burst after ignition, (ii) a titanium and argon ion flux in phase with the plasma current due to ionized neutrals in front of the target, (iii) a small energetic burst of ions after plasma shut off, and (iv) cold ions impinging on the substrate in the late afterglow showing a pronounced maximum in current. The last contribution originates from ions generated during the plasma current maximum at 50 µs after ignition in the magnetic trap in front of the target. They require long transport times of a few 100 µs to reach the substrate. All energy distributions can be very well fitted with a shifted Maxwellian indicating an efficient thermalization of the energetic species on their travel from target to substrate. The energy of titanium is higher than that of argon, because they originate from energetic neutrals of the sputter process. The determination of the temporal sequence of species, energies and fluxes in HiPIMS may lead to design rules for the targeted generation of these discharges and for synchronized biasing concepts to further improve the capabilities of high-power impulse magnetron sputtering (HiPIMS) processes.
Export citation and abstract BibTeX RIS
1. Introduction
High-power impulse magnetron sputtering (HiPIMS) plasmas are magnetron discharges which are operated in a pulsed mode with peak powers in the range of several kW cm−2 and duty cycles in the range of a few per cent or less. Based on this pulsing technique, the plasma density and ionization degree in the pulse can be very high while limiting the thermal load on the substrate, which has led to numerous applications [1].
The pulsed nature of the intense HiPIMS plasma, however, causes a very complex dynamic of the plasma. Most prominent is the formation of localized ionization zones or spokes, which rotate in the E × B direction in front of the target surface, with a velocity being 10 times smaller than the E × B drift according to single-particle motion [2, 3].
A HiPIMS pulse follows a sequence of five phases [4]: (i) a voltage is applied to the target and the plasma is ignited. During the very first microseconds, the plasma potential in front of the target becomes very negative of the order of −200 V [5, 6] causing strong electric fields. All ions are trapped and only those with very high energies or those that are created outside of the magnetic trap are able to reach the substrate. The gas temperature increases to 1200 K [7, 8]; (ii) in phase 2 (current rise), the current increases and a dense plasma torus is developing above the racetrack of the target. The voltage drop is most pronounced only in the sheath region in front of the target; (iii) (gas depletion) the working gas neutral density decreases due to gas rarefaction driven by the hot plasma [9]; (iv) in phase 4 (plateau/runaway), a steady state is reached with a plasma current depending on working gas and target material as well as on the self-sputtering coefficient; (v) in phase 5 (afterglow), the electron density decays following two time constants, a fast decay of the order of 30 µs followed by a much slower decay of the order of 3 ms [10]. The electron temperature rapidly decreases on a timescale of 30 µs as well.
The incident ion fluxes on the substrate have been measured by several groups using time-integrated and time-resolved ion mass spectrometry either monitoring at substrate level in direct line-of-sight to the magnetron target or sideways at the target level. The temporal resolution is often only 20 µs [11–14], which makes it difficult to resolve the HiPIMS pulses with typical pulse lengths of 70 to 200 µs. Most recently, time-resolved energy distributions with a resolution of 2 µs have been measure by Palmucci et al, but for very short pulses only [15]. In most cases, however, only time-averaged data or the time-dependent decay in the afterglow with decay times of the order of ms are discussed. Several contributions to the energy spectra of ions can be identified.
- Noble gas: argon ions are produced by ionization in the plasma bulk and impinge onto the surface with energies according to the sheath potential in front of the substrate.
- Metal species: The metal species may exhibit higher energies than the argon ions, because they originate as energetic neutrals from sputtering at the target surface according to a Thompson energy distribution. During the transport through the plasma, they may be ionized by electron impact in the dense plasma torus or by charge transfer reactions with argon ions. In high-density discharges, electron impact is dominant and due to the small mass of electrons, the kinetic energy of the fast neutrals is not changed by ionization and only a thermalization of the ions due to ion–ion collisions can alter their energy distribution. Finally, metal ions are accelerated in the plasma sheath in front of the target. Temporally resolved distribution functions indicate that argon ions impinge at the substrate prior to the incident metal ions [16].
- Reactive ions: in the case of electronegative plasmas, such as oxygen being employed in reactive sputtering, positive and negative ions contribute to the energy spectra. These species originate from the formation of negative ions in front of the target. They are accelerated in the cathode sheath [17–19] to high energies and may reach the substrate either as energetic negative ions or, after neutralization as fast neutrals, after ionization even as positive ions.
This illustrates that the transport of species from target to substrate in such a dynamic plasma is still an open issue, which is addressed experimentally and theoretically by many groups [2, 4, 20]. This dynamic has to be fully understood before a connection between the properties of the HiPIMS plasma and the film growth processes can be established. It is especially important to measure exact transport time constants for the time periods between ion generation, cross field transport and arrival at the substrate as a benchmark for advanced computer models of a HiPIMS discharge. As a result, growth processes can be tailored in much more detail by controlling the sequence of the arriving species, as being demonstrated by Magnfält et al [21].
In this paper we follow the dynamic of a HiPIMS pulse by combining three techniques, phase-resolved optical emission spectroscopy (PROES), time- and energy-resolved ion mass spectrometry (MS), and time-resolved measurement of the film growth using a rotating shutter experiment, as described in [22, 23]. We seek to connect the time-resolved growth rate with the temporal evolution of the energy- and mass-resolved incident ion fluxes.
2. Experiment
2.1. Deposition in the HiPIMS process
The experiments are performed in a vacuum vessel housing a 2 inch magnetron with titanium target, which is powered by a Melec HiPIMS power supply (see figure 1) producing rectangular voltage pulses. The substrate consists of a 1 square inch piece of silicon wafer, which is inserted into a 6 inch substrate holder using a load lock system. Argon gas is used as plasma forming gas at pressures between 0.25 and 1 Pa. A HiPIMS pulse length between 50 and 400 µs is used at a frequency of 300 Hz corresponding to different duty cycles. The average power is adjusted between 〈P〉 ≃ 60 W and 〈P〉 ≃ 100 W. Current and voltage at the target are monitored with a voltage–current (VI) probe. During current maximum after 40 µs, a specific peak power Ppeak is dissipated before the HiPIMS plasma reaches a plateau phase with a lower power of Pplateau. All experimental parameters are listed in table 1. At very short pulse lengths, the plateau phase is not reached. In addition, a stable operation at a pressure of 0.25 Pa and very short pulse lengths of 50 µs could not be realized.
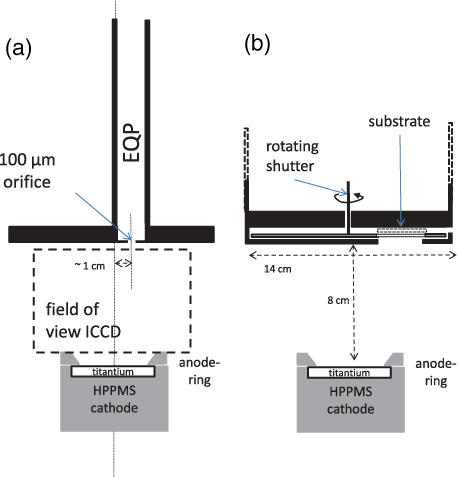
Figure 1. Sketch of the experimental setup: (a) measurement of the ion fluxes via an HIDEN EQP using a 100 µm orifice. The field of view for the ICCD camera is indicated as dashed line; (b) rotating shutter experiment to monitor the time-resolved film growth. For details see [23].
Download figure:
Standard image High-resolution imageTable 1. HiPIMS plasma parameters for different pulse lengths and pressures: average power 〈P〉, peak power Ppeak at 40 µs after ignition, power in the plateau Pplateau of the HiPIPMS pulse and voltage V at the target of the HiPIMS pulses. At 0.25 Pa and 50 µs, no stable discharge could be generated.
| p | Quantity | 50 µs | 200 µs | 400 µs |
|---|---|---|---|---|
| 0.25 Pa | 〈P〉 | 100 W | 70 W | |
| voltage | −600 V | −507 V | ||
| Ppeak | 1.8 kW | 0.76 kW | ||
| Pplateau | 1.2 kW | 0.5 kW | ||
| 0.5 Pa | 〈P〉 | 60 W | 100 W | 60 W |
| voltage | −526 V | −504 V | −442 V | |
| Ppeak | 5.26 kW | 3.5 kW | 0.97 kW | |
| Pplateau | 1.25 kW | 0.44 kW | ||
| 1 Pa | 〈P〉 | 60 W | 100 W | 70 W |
| voltage | −450 V | −437 V | −378 V | |
| Ppeak | 5.9 kW | 3.9 kW | 0.57 kW | |
| Pplateau | 3.3 kW | 0.38 kW |
It should be mentioned that the peak powers in our experiments are still moderate in the range of several kW, which converts for a 2 inch magnetron into a few hundred W cm−2. Only for short pulse lengths is the HiPIMS regime reached. Due to these moderate powers, however, the plasma build-up occurs much more slowly, which allows following this dynamic despite a time resolution of a few microseconds only.
A rotating shutter experiment is used to measure time-resolved deposition rates by placing a rotating slit with a width of 200 µm in front of the substrate, (see figure 1(b)) to spread the time-dependent growth flux onto the silicon substrate. The rotation of the shutter is synchronized with the HiPIMS pulses, so that a deposition profile is obtained, where the spatial variation of the film thickness corresponds to the temporal variation of growth rate in a single HiPIMS pulse. The temporal resolution at a rotation frequency of the shutter of 30 Hz is 25 µs. This method is described in detail in [22, 23].
2.2. Plasma diagnostic
The evolution of the plasma is measured by PROES using an intensified CCD camera (ICCD). By using bandpass filters, the emission of Ar neutrals at 760 nm, of Ar+ ions at 488 nm, of Ti neutrals at 396 nm, and of Ti+ ions at 307 nm is mapped.
Time- and energy-resolved mass spectra of positive ions are measured using a HIDEN EQP 300 HE instrument, which is mounted in line-of-sight to the racetrack of the magnetron target, as shown in figure 1. The signals are proportional to mass/charge ratio and energy/charge ratio, respectively. Therefore, doubly charged ions appear as peaks at half of the mass of the parent ion. The mass spectrometer is mounted in a differential pumping stage with a base pressure of 10−8 mbar and a sampling orifice of 100 µm. A multi-channel scaler (MCS) is used to store the signal from the secondary electron multiplier of the EQP in sync with the HiPIMS pulsing limited by the sampling rate of the MCS, which is of the order of 32 ns. To acquire sufficient signal intensity, we used a bin width in the MCS of 2 µs, and integrated at a given mass and energy the temporal evolution of the signal for 6 to 12 s. The energy is scanned in steps of 0.25 eV. These data correspond to a map of signal intensity versus time and energy. By integrating over all energies, a time-resolved total ion current is obtained.
After acquisition of the time- and energy-resolved ion currents, the data have to be corrected in principle for the mass and energy transmission function of the EQP. The comparison of absolute fluxes requires a proper calibration of the transmission function in connection with a calibration of the total fluxes using a retarding field analyser. This is usually performed by measuring different noble gas plasmas. The calibration of the energy transmission function at very low energies below 1 eV is even more difficult as being important for cold ions in the afterglow. Hamers et al [24] showed that the transmission function increases dramatically at these low energies due to a very large acceptance angle of the instrument. Consequently, very low-energy ions are detected very sensitively leading to a much higher signal in comparison to ions with energies above 1 eV. Such correction may, however, be small in our case, because the acceptance angle is geometrically limited by the orifice extractor distance. In addition, the very long drift tube in our version of the EQP (70 cm) acts as a space filter and blocks trajectories at large acceptance angles. In this paper, we do not apply correction factors, because we regard ions of very comparable mass and energy and analyse the temporal development of the ion fluxes only in a qualitative manner.
2.3. Synchronization of the data
The discussion of time-resolved data relies on an exact synchronization of the signals from the VI probe, the ICCD camera, the EQP and the rotating shutter experiment. The current and voltage signals indicate the exact begin and end of the HiPIMS pulse, which can be used as trigger to define an absolute time scale of the experiment. This synchronization remains, however, difficult because a proper treatment of electronic delays between the VI measurement and the signal acquisition system of all other diagnostics is mandatory. This challenge can be overcome by using the peculiar temporal structure of the data themselves to synchronize all signals. Especially, the end of the HiPIMS pulse induces very distinct features in all data sets: the light emission abruptly stops in the PROES measurement, the growth rate sharply decays in the time-resolved shutter experiments, and sharp changes in the ion current as measured by the EQP are observed at plasma shut off. Such distinct features are not that unique at the begin of the HiPIMS pulse in the data, because the plasma itself requires some time to build up leading to pronounced signals in ion current or emission at different times, as discussed in great detail in this paper. By adjusting the timescale for all data using the distinct features at the end of the HiPIMS pulse, we correct automatically for the different time-of-flights (TOF) of the ions in the mass spectrometer. By correlating this feature also to the abrupt drop in growth rate, as measured by the rotating shutter experiment, we define this timescale with respect to the measurement location of the shutter experiment, which is identical to the orifice of the EQP at the substrate position.
3. Results and discussion
3.1. Phase-resolved optical emission spectroscopy
ICCD camera measurements were taken for a 200 µs HiPIMS pulse at 0.5 Pa. By extracting only the emission on the symmetry axis of the experiment from the images and plotting it versus time, we create a phase-resolved optical emission map, as shown for the case of argon emission at 760 nm in figure 2(a). The variation of the plasma current is plotted as solid line in figure 2(b). Plasma ignition becomes visible as a distinct peak in ion current followed by a current rise to a maximum (Ppeak = 3.5 kW) and a decrease again due to the gas rarefaction (Pplateau = 1.25 kW), before an equilibrium at low current and lower plasma density in the plateau phase of the HIPIMS pulse is reached. One can clearly see that the argon neutral emission follows closely the variation in plasma current.

Figure 2. (a) Phase-resolved optical emission map at 760 nm of Ar neutrals for a 200 µs HiPIMS pulse at 0.5 Pa. The velocity of the emission structure at the onset of the HIPIMS pulse is indicated by the slope of the straight line revealing a velocity of 3.7 km−1. z = 0 mm corresponds to the location of the target surface. (b) Current as measured using the VI probe.
Download figure:
Standard image High-resolution imageIn addition, a distinct emission structure at the beginning of the HiPIMS pulse is observed, marked by the solid line in figure 2(a). Since figure 2(a) corresponds to a space versus time map, the distinct emission structure can be interpreted as an excitation zone, which travels from target to substrate with a velocity of 3.7 km s−1 (indicated by a straight line in figure 2(a)). Such a travelling excitation zone may be explained by several phenomena: (i) a disturbance of the plasma potential, induced by plasma ignition, moves from target to substrate as an ion acoustic wave, as demonstrated by Gylfason et al [25]. The strong electric field within that disturbance accelerates locally the electrons causing a travelling excitation of argon neutrals; (ii) as an alternative, one might postulate an electron beam that is generated upon plasma ignition travelling from the target to the substrate causing the excitation of argon neutrals. The velocity, however, is very low indicating a dependence on heavy particle motion (ions or neutrals) rather than on electron motion, where velocities of the order of 100 km s−1 would be expected. Nevertheless, the electron velocity might be largely reduced due the transport across the magnetic field lines.
Figure 3 shows the PROES data for Ar (a) (same data as figure 2), Ar+ (b), Ti (c) and Ti+ (d). One can clearly see that the maximum emission for Ar, Ar+, Ti and Ti+ is in sync with the maximum in plasma current. The emission of Ti+ during the current maximum extends further into the plasma bulk (almost to z = 40 mm) compared to the emission of Ti (to z = 30 mm) indicating that the sputtered Ti is efficiently transformed into Ti+ due to the intense ionization in the plasma bulk. This is opposite to the extension of argon ions (to z = 30 mm), which are most dominant only in front of the target.
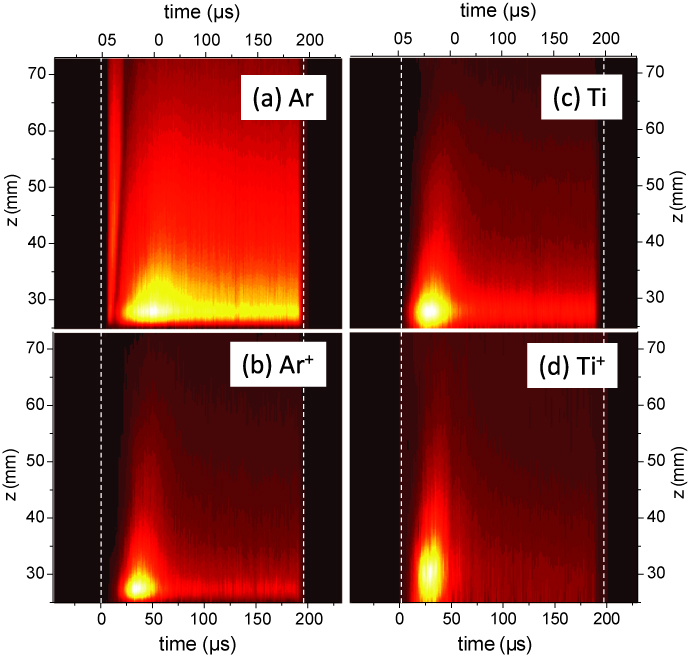
Figure 3. Phase-resolved optical emission data for a 200 µs HiPIMS pulse at 0.5 Pa: (a) Ar neutrals; (b) Ar ions; (c) Ti neutrals; (d) Ti ions. z = 0 mm corresponds to the location of the target surface.
Download figure:
Standard image High-resolution imageIt is interesting to note that the excitation zone which travels with a velocity of 3.7 km s−1 in the beginning from target to substrate is only observed for the excitation of argon neutrals. The travelling excitation zone is missing in the PROES data for argon ions or titanium species. This is reasonable regarding the explanation above: the travelling excitation zone corresponds to a region with energetic electrons causing mainly the excitation of the abundant argon neutrals. Argon ions, and titanium species, however, are most dominant in front of the target and cannot easily be excited by a strong electric field far away from the cathode surface.
3.2. Ion fluxes towards the substrate
The temporal evolution of the energy-integrated ion fluxes are plotted for a 200 µs HiPIMS pulse at a pressure of 0.25, 0.5 and 1 Pa in figure 4. In addition, figure 5 shows the temporal evolution of the energy-integrated ion fluxes in a HiPIMS plasma with pulse lengths of 50 µs (a), 200 µs (b) and 400 µs (c) for a pressure of 1 Pa. The following conclusions can be drawn.

Figure 4. Ion fluxes measured at substrate level for argon (dashed line) and titanium (solid line) for a 200 µs HiPIMS pulse at a pressure of 0.25 Pa and a voltage of 600 V (a), at a pressure of 0.5 Pa and a voltage of 504 V (b), and a pressure of 1 Pa and a voltage of 437 V (c). The average power is always kept at 〈P〉 = 100 W. The initial peak in the argon ion current is marked with 1, the peak in the late afterglow with 2 and the sharp peak after the end of the HiPIMS pulse with 3.
Download figure:
Standard image High-resolution image
Figure 5. Ion fluxes measured at substrate level for argon (dashed line) and titanium (solid line) at a pressure of 1 Pa for 50 µs (a), for 200 µs (b), and for 400 µs (c). The average power is between at 〈P〉 = 100 W. The initial peak in the argon ion current is marked with 1, the peak in the late afterglow with 2 and the sharp peak after the end of the HiPIMS pulse with 3.
Download figure:
Standard image High-resolution image- Initial peak in the argon ion current: due to the excellent temporal resolution, we may also identify a pronounced peak in the argon ion flux at the very beginning of the HiPIMS pulse. This is consistent with the travelling excitation zone described above. We assume that the excitation zone may also generate argon ions locally in front of the substrate, which are then observed as a peak in ion current, when the excitation zone arrives at the substrate within the first 50 µs after plasma ignition (marked as 1 in figures 4 and 5). According to that explanation, the height of that peak should scale with the neutral density in front of the substrate rather than the peak power of the HiPIMS pulse. This is exactly corroborated by the data: at 0.25 Pa, this initial peak is very small, despite a high peak power of 1.8 kW during the pulse (see figure 4(a)). In contrast, at a very high pressure of 1 Pa in figures 5(a) to (c), this peak is very pronounced and exhibits a similar height although the peak power varies by a factor 10 between Ppeak = 5.9 kW and Ppeak = 0.57 kW. It shifts only to later times after plasma ignition from 10 µs for the 50 µs pulse to almost 50 µs for the 400 µs pulse. This might be related to the decrease in absolute voltage for these pulses from −450 to −378 V as listed in table 1. This initial pronounced peak is absent in the titanium ion spectra. This is consistent, since the titanium neutral density in front of the substrate directly after the onset of the HiPIMS pulse is still small.
- Delay between argon ions and titanium ions: argon ions are observed earlier than titanium ions. This is consistent with findings in the literature [16], where it is explained by the fact that the sputtering requires some time to build up before titanium ions become visible.
- Peaks of ion current in the late afterglow: a peak in the ion current is observed after the end of the HiPIMS pulse (marked as 2 in figures 4 and 5). This peak is very pronounced at higher pressures as can be seen in figure 4(c).In principle, ion production in the late afterglow may be induced by Penning-ionization from collisions with metastables, which are created during the pulse by electron impact. The timescale of the ions in the afterglow follows, therefore, the slow dynamic of the decay of the metastable density. Vitelaru et al [26] measured this dynamic showing a metastable density of the order of 1010 cm−3, which decays following two time constants in the afterglow. However, since we observe a peak in the ion current rather than a monotonous decay, we disregard any explanation based on Penning ionization. Even more important, the energy balance for production of argon ions from argon metastables requires the collision of at least two metastables to create one argon ion. At the low pressures of our experiment, metastable–metastable collisions are very rare, so that any argon ion production from reactions with metastables can be neglected.Instead, we explain the ion current peak in the afterglow by the dynamic of plasma generation in HiPIMS: during the on-time of the pulse, an intense ion population is confined in the magnetic trap in front of the target. Due to the gradient in plasma potential, the ions are accelerated towards the target rather than towards the substrate [5]. Some ions are transported across the magnetic field lines towards the substrate and contribute to the ion flux at the substrate position [2, 5]. The transport time from target to substrate for these ions can be much larger than the transport time of neutrals due to the larger cross sections for ion–neutral collisions compared to neutral–neutral collisions. The arrival time at the substrate position is later for higher pressures, due to the collisional nature of the transport, as can be seen by the shift of the position of the ion peak if one compares the spectra at low pressure with the spectra at high pressure (marked as 2 in figures 4(b) and (c)).These transport properties are also able to explain the data in figure 5: an intense ion population is generated in front of the target at 50 µs during the current maximum as can be seen in the PROES data. This ion population travels from target to substrate and causes pronounced maxima in the ion current at approximately 300 µs after the ignition of the plasma pulse (marked as 2 in figures 5(a) and (b)) irrespective of the pulse length. This relates to a travel time of 250 µs. Any theoretical model of the dynamic of a HiPIMS plasma should be able to explain these time constants. Nevertheless, we can estimate the travel time for the ions following a drift motion in the positive column of the plasma outside of the magnetic trap and the substrate. The scaling of this drift time τ with pressure p is
 . Based on a cross section for ion–neutral collisions of the order of 4 × 10⁻¹⁵ cm−2 and assuming an electric field of 10 V m−1 [6] a time constant of τ∝ 250 µs at a pressure of 1 Pa would result. Due to the scaling with
this would go down to 175 or to 125 µs for a pressure of 0.5 Pa or 0.25 Pa, respectively, which is consistent with our experimental observation.This discussion illustrates that the timing of the arrival of the ions at the substrate depends very sensitively on their transport properties from target to substrate. At very high currents for example, the gas depletion in front of the target is significant reducing the scattering of the ions with argon neutrals. Consequently, the ion peak at the substrate will be more in phase with the HiPIMS pulse defined by the target current.Even the peak width of the ion current in the afterglow can be discussed using this picture: (i) during the HiPIMS pulse at 50 µs in figure 5(a) the peak power Ppeak = 5.9 kW implying a high ion temperature causing a broad peak in arrival times of the ion population; (ii) at a pulse length of 200 µs, the ion population reaches the substrate at the same time, but the distribution of arrival times is narrower indicating a lower ion temperature consistent with a peak power of only Ppeak = 3.9 kW. (iii) Finally, at 400 us, the ion population reaches the substrate during the on-phase of pulse and any distribution of arrival times is masked. Instead, we observe a pronounced and sharp peak (marked as 3 in figure 5(c)) when the arrival time of the ion population at the substrate coincides with the shut-off of the plasma. As described in the next paragraph, a short increase of the plasma potential occurs when the plasma is switched off due the preferential loss of the hot electrons. This causes an expansion of the substrate sheath causing a burst of ions towards the substrate. This effect scales with the ion density in front of the target and is, therefore, most pronounced when the arrival time of the ion population at the substrate coincides with the moment the plasma is switched off. Consequently, the pronounced peak appears at high pressures for longer pulses, because the travel time of the ion population is long (marked as 3 in figure 5(c)), and at lower pressures for shorter pulses (marked as 3 in figure 4(a)) because the travel time of the ion population is short.
. Based on a cross section for ion–neutral collisions of the order of 4 × 10⁻¹⁵ cm−2 and assuming an electric field of 10 V m−1 [6] a time constant of τ∝ 250 µs at a pressure of 1 Pa would result. Due to the scaling with
this would go down to 175 or to 125 µs for a pressure of 0.5 Pa or 0.25 Pa, respectively, which is consistent with our experimental observation.This discussion illustrates that the timing of the arrival of the ions at the substrate depends very sensitively on their transport properties from target to substrate. At very high currents for example, the gas depletion in front of the target is significant reducing the scattering of the ions with argon neutrals. Consequently, the ion peak at the substrate will be more in phase with the HiPIMS pulse defined by the target current.Even the peak width of the ion current in the afterglow can be discussed using this picture: (i) during the HiPIMS pulse at 50 µs in figure 5(a) the peak power Ppeak = 5.9 kW implying a high ion temperature causing a broad peak in arrival times of the ion population; (ii) at a pulse length of 200 µs, the ion population reaches the substrate at the same time, but the distribution of arrival times is narrower indicating a lower ion temperature consistent with a peak power of only Ppeak = 3.9 kW. (iii) Finally, at 400 us, the ion population reaches the substrate during the on-phase of pulse and any distribution of arrival times is masked. Instead, we observe a pronounced and sharp peak (marked as 3 in figure 5(c)) when the arrival time of the ion population at the substrate coincides with the shut-off of the plasma. As described in the next paragraph, a short increase of the plasma potential occurs when the plasma is switched off due the preferential loss of the hot electrons. This causes an expansion of the substrate sheath causing a burst of ions towards the substrate. This effect scales with the ion density in front of the target and is, therefore, most pronounced when the arrival time of the ion population at the substrate coincides with the moment the plasma is switched off. Consequently, the pronounced peak appears at high pressures for longer pulses, because the travel time of the ion population is long (marked as 3 in figure 5(c)), and at lower pressures for shorter pulses (marked as 3 in figure 4(a)) because the travel time of the ion population is short. - Sharp increase in the ion current at plasma shut off. In several experiments, a peak in ion current is observed directly after switch off of the plasma (marked as 3 in figures 4(a) and 5(c)). The inspection of the ion energies, as shown below, reveals that directly after the plasma shut off, the energy increases typically for 10 µs. This can be explained by a short increase of the plasma potential directly after switch off of the plasma, as also being observed by the emissive probe measurements of Mishra et al [5, 6]. When the plasma is switched off, the target sheath collapses and the hot electrons are no longer confined. For a short period of time, the plasma becomes more positively charged before the ambipolar current of positive ions reduces the plasma potential again. Due to this fast change in plasma potential, the sheath in front of the substrate quickly expands into the plasma bulk in front of the substrate. Suddenly, the ions in front of the substrate experience an electric field of the expanding sheath and are accelerated towards the substrate. This burst of energetic ions after switching off the plasma scales with the ion density in front of the substrate.
- Ion fluxes during the plateau phase of the pulse. As discussed before, the travel time of the ion population from magnetron target to substrate may be rather long. Nevertheless, we see a constant argon and titanium ion flux towards the substrate, which follows the plasma current. We assume that these ions can only be created from ionization of argon or titanium neutrals close to the substrate outside of the magnetic trap. Titanium neutrals that are sputtered at the target, following a Thompson energy distribution, exhibit a long mean free path and they may reach the substrate within 50 µs. This makes them much faster than the trapped ion population which has to travel across the magnetic field lines within 250 µs from target to substrate. Due to the ionization of the fast neutrals in front of the substrate, the ion current depends rather directly on the plasma current, which explains the close relationship.


Summarizing, we postulate four ion contributions impinging on the substrate at different times and energies: (i) after ignition, an ionization zone travels to the substrate and causes ionization of argon neutrals locally in front of the substrate leading to an initial argon ion burst after ignition, (ii) during the current maximum at 50 µs an ion population is created in front of the target, which reaches the substrate only after 250 µs or later depending on pressure; (iii) ionization of argon and fast titanium neutrals occurs also in front of the substrate, which contributes to an argon and titanium ion current in phase with the plasma current; (iv) at plasma shut down, a small burst of energetic ions is observed, when the ion density in front of the substrate is high. This burst of ions, is induced by a change in plasma potential due to the loss of hot electrons at the target, when the plasma is switched off.
3.3. Temporal evolution of the ion energy distributions
The dynamic of the postulated four contributions to the ion current in a HiPIMS plasma is analysed in more detail by regarding the temporal evolution of the energy distribution functions for a pulse length of 200 µs and a pressure of 0.25 Pa. The time-dependent energy spectra are shown as contour plots for Ti2+ in figure 6(a) and for Ti+ in figure 6(b), respectively. The energy distributions are plotted at 60, 100 and 220 µs in figure 6(c) together with a Thompson distribution function for a surface binding energy for titanium of ESBE = 4.9 eV [27, 28]

and a Maxwellian distribution shifted by Eshift with an ion temperature of Tions:
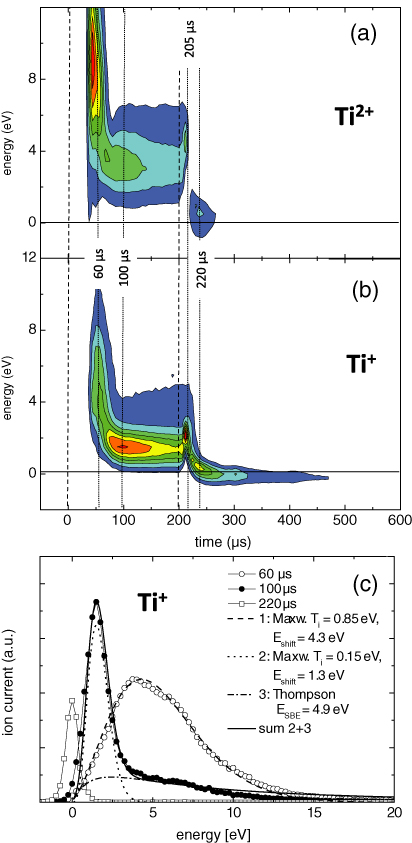
Figure 6. Contour plot of the ion current for a HiPIMPS pulse at 200 µs and 0.25 Pa for Ti2+ (a) and Ti+ (b); (c) energy distributions for Ti+ at 60 µs (open circles), at 100 µs (solid circles), and at 220 µs (open squares). Energy distribution according to equation (2) for Ti = 0.85 eV an Eshift = 4.3 (eV) (dashed line), for Ti = 0.15 eV an Eshift = 1.3 (eV) (dotted line), and according to equation (1) for ESBE = 4.9 (eV) (dashed dotted line).
Download figure:
Standard image High-resolution imageThe actual shape of the distribution function, as being sampled by the EQP, depends very sensitively on the acceptance angle of the instrument with respect to the shape of the distribution of the incident species in velocity space [29]. If we denote the direction towards the entrance orifice of the EQP as z, one has to integrate for a given velocity vz in the direction of vx and vy to derive the prefactor g(E) to account for the total ion current that is sampled. In the limit of a very small acceptance angle, which holds in our case, g(E) is assumed to be constant. The fitting of the energy distributions for different times is discussed as follows.
- At 60 µs, current maximum: during the current maximum between 40 to 60 µs the plasma is most intense, inducing a high flux of sputtered titanium, which eventually becomes ionized on its transport to the substrate. The energy of titanium Ti2+ is approximately twice that of Ti+ consistent with the stronger acceleration in the electric field due to the higher charge state compared to Ti+. The normalized intensities of Ti2+ reach their maximum already at 40 µs compared to 60 µs for Ti+. This is can be explained by the high electron temperature during the current maximum, which is able to ionize Ti up to Ti2+, whereas in the plateau phase at 100 µs the electron temperature is lower so that mainly Ti+ is created.The energy distribution of Ti+ can be very well fitted by a Maxwellian according to equation (2) with an energy shift of Eshift = 4.3 eV and an ion temperature of Ti = 0.85 eV. This is consistent with the transport of neutrals followed by their ionization in the plasma and thermalization by ion–ion collisions as described by Horwat et al [30]: titanium is sputtered as neutrals exhibiting a Thompson distribution function. The fast titanium neutrals are ionized by electron impact and if the resulting ion density is high, ion–ion collisions may cause a thermalization resulting in a shifted Maxwellian energy distribution, due to the forward direction of the sputter wind. The energy shift Eshift is composed of the forward direction from sputtering and the acceleration of the ions in the plasma sheath in front of the substrate. The very high apparent ion temperature of 1 eV may be linked to the energy of the fast neutrals. The energy distribution of Ti2+ can also be very well fitted by a Maxwellian according to equation (2) with an energy shift of Eshift = 8.5 eV and an ion temperature of Ti = 1.1 eV (not shown).
- At 100 µs, plateau phase: at 100 µs the HiPIMS plasma is in its plateau phase with a moderate current and a locally reduced density due to gas rarefaction. Figure 6(c) shows that the energy distribution can be best fitted by the sum of shifted Maxwellian with an energy shift of Eshift = 1.3 eV and an ion temperature of Ti = 0.15 eV and a Thompson distribution to account for the high-energy tail of the distribution. Such a bimodal distribution seems reasonable, because the plasma density drops in the plateau phase so that any thermalization of the ions is reduced. As a consequence the high-energy tail of the original Thompson distribution is still visible in the energy spectra of incident species on the substrate.
- At 210 µs, directly after plasma shut off: directly after plasma shut off, the ion energies increase by 1 eV as illustrated in figures 6(a) and (b). As introduced above, the loss of hot electrons after plasma shut off causes the plasma potential to rise for a few µs, inducing the burst of energetic ions, which was already seen in figures 4 and 5.
- At 220 µs, afterglow: in the late afterglow the ion energies are very small, indicating a very low electron temperature in the decaying plasma. The distributions can be well described by a shifted Maxwellian with energies Eshift and ion temperature Ti of the order of 0.1 eV, as described below.
Summarizing, we can state that the titanium ion energy distributions follows a shifted Maxwellian. The energy shift originates from the kinetic energy of the sputtered neutrals and from the acceleration in the substrate sheath. Ti2+ is more energetic than Ti+. The thermalization of the incident titanium ions is dominant due to the high plasma density during the current maximum of the HiPIMS pulse, but the decreasing collisionality during the plateau phase leads to a bimodal energy distribution with a low-energy thermal part and a high-energy tail.
3.4. Correlation of ion flux and and growth flux
In the following, we address the connection between the flux of energetic ions onto the target and the time-resolved growth rate for two cases: a HiPIMS pulse with a high peak power of Ppeak = 5.26 kW and with a low peak power of 0.97 kW to investigate the influence of the ionization degree on the growth dynamics.
3.4.1. HiPIMS pulse at high peak power Ppeak = 5.26 kW.
Figure 7 shows the energy distribution of argon and titanium together with the time-resolved growth rate for a HiPIMS pulse at 0.5 Pa with a pulse length of 50 µs and a peak power Ppeak = 5.26 kW. The energies are shown as contour plots for the ion currents with respect to energy and time. The energy distributions are integrated to yield a total ion current, as shown in figure 7(c) (same data as in figure 4(b)). Figure 7(d) shows the time-resolved deposition from the rotating shutter experiment as explained in [23].
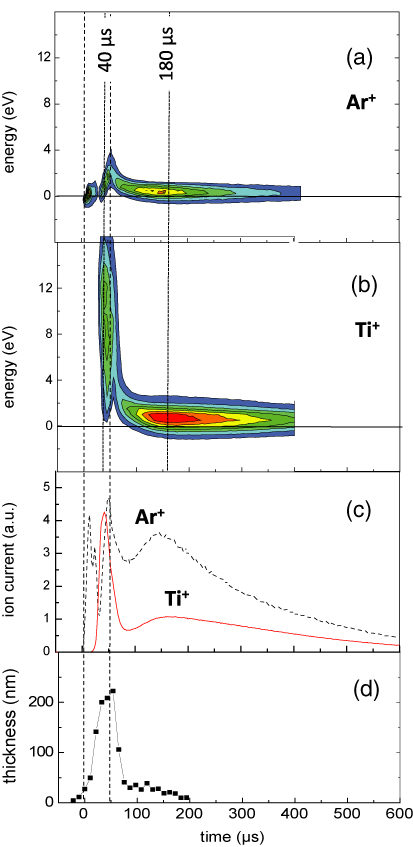
Figure 7. Ion energy distributions for argon ions (a), titanium ions (b) for a 50 µs HiPIMS pulse at 0.5 Pa as contour plots of energy versus time normalized to the maximum current. (c) Energy-integrated ion fluxes for argon (dashed line) and titanium ions (solid line). (d) time-resolved deposition after an exposure of the substrate for 6 h to the rotating shutter experiment (from [23]).
Download figure:
Standard image High-resolution imageOne can clearly see that energetic Ti+ ions are generated at 40 µs, whereas the energy of the argon ions remains moderate. The energy decreases significantly in the afterglow. Figure 7(d) shows that the time-resolved growth rate is consistent with the temporal evolution of the titanium ion flux. Only in the afterglow is a flux of titanium ions still visible, although film growth vanishes. This discrepancy might be an artefact, because the Ti+ ions exhibit very low energies in the afterglow for which the EQP is most sensitive due to the large acceptance angle [24]. Summarizing, one may conclude that film growth during the pulse is dominated by (i) incident neutrals due to their short transport time from target to substrate and by (ii) ions that are generated from fast neutrals directly in front of the target. These two contributions decay sharply after plasma shutdown since they are both in sync with the plasma current. In the afterglow, however, the growth rate may be dominated by ions since their transport time from target to substrate is long.
The energy distributions for Ar+ and Ti+ are shown in figure 8 at 40 µs (during the pulse) and at 180 µs (in the afterglow) after plasma ignition together with the model based on a shifted Maxwellian.
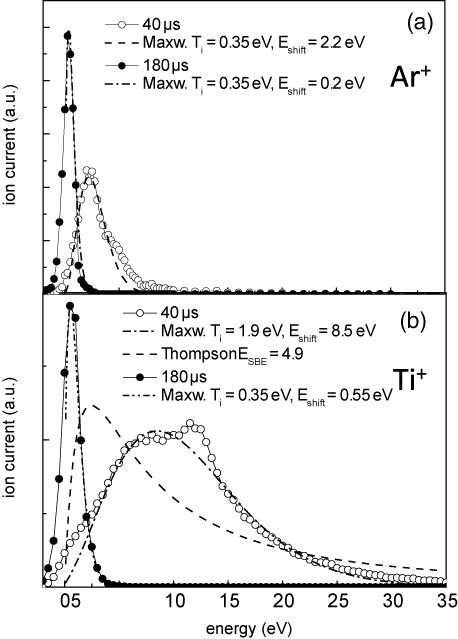
Figure 8. Ion energy distributions for argon ions (a), titanium ions (b) for a 50 µs HiPIMS pulse at 0.5 Pa at 40 µs (open circles) and at 180 µs (solid circles); Models according to equations (2) and (1), the parameters are indicated.
Download figure:
Standard image High-resolution image- Argon ions: the argon ion energy distribution (figure 8(a)) at 40 µs can be fitted with a temperature of the order of 0.35 eV and an energy shift Eshift of 2.2 eV during the plasma on-time induced by the sheath potential in front of the substrate. The ion temperature remains the same in the afterglow at 180 µs and only the energy shift Eshift reduces to 0.2 eV due the small sheath potential in the afterglow following the lowering of the electron temperature in the afterglow.
- Titanium ions: the distribution functions of Ti+ ions (figure 8(b)) at 40 µs can be fitted with an apparent ion temperature of Ti = 1.9 eV and a shift in energy of Eshift = 8.5 eV. Apparently, due to the high peak power, the ion–ion collisions are sufficient to cause a thermalization of the ions. The energy shift for titanium ions is considerably higher than for argon ions, because the energy of the incident titanium ions originates from the sputter process (see dashed line in figure 8(b) for the Thompson distribution) plus the acceleration in the substrate sheath. The distribution in the afterglow at 180 µs describes a cold group of titanium ions with Ti = 0.35 eV identical to that of the argon ions and Eshift = 0.55 eV.
3.4.2. HiPIMS pulse at a low peak power of Ppeak = 0.97 kW.
Figure 9 shows the energy distribution of argon and titanium together with the time-resolved growth rate for a HiPIMS pulse at 0.5 Pa and a pulse length of 400 µs a at low peak power of Ppeak = 0.97 kW. The energies are shown as contour plots for the ion current with respect to energy and time. The energy distributions are integrated to yield a total current as shown in figure 9(c). Figure 9(d) shows the time-resolved growth rate from the rotating shutter experiment in [23].
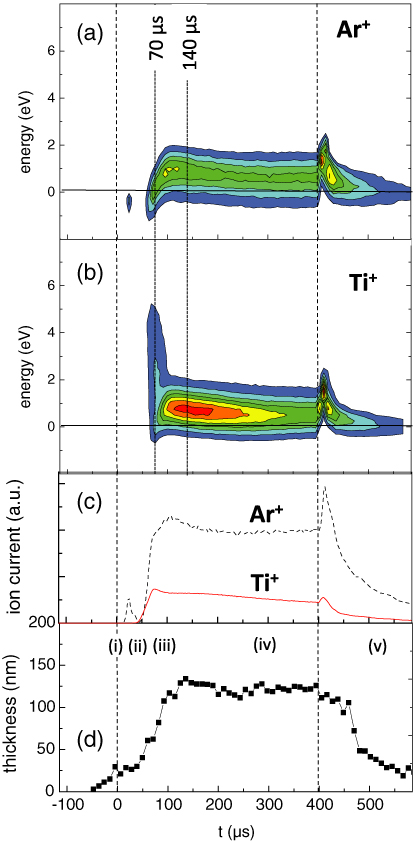
Figure 9. Ion energy distributions for argon ions (a), titanium ions (b) for a 400 µs HiPIMS pulse at 0.5 Pa as contour plots of energy versus time normalized to the maximum current. (c) Energy-integrated ion fluxes for argon (dashed line) and titanium ions (solid line). (d) time-resolved deposition after an exposure of the substrate for 6 h to the rotating shutter experiment [23].
Download figure:
Standard image High-resolution imageDue to the long pulse length, the sequence of the five phases of the HIPIMS pulse (indicated as roman numbers in figure 9(d)) can be identified with respect to the incident ion fluxes and growth fluxes:
- Ignition (i): in the very first beginning the growth rate is still small. During that phase a small burst of argon ions is hitting the surface. The small growth rate can only originate from titanium neutrals from the preceding HiPIMS pulses. No contribution of titanium to the incident ion flux is observed.
- Current rise and maximum (ii): the plasma current increases and causes an intense plasma bulk and an intense sputtering. The majority of the ions are generated in front of the target and cannot yet reach the substrate due to their long transport time. The sputtered neutrals however, may reach the substrate and contribute to film growth. The latter is most efficient for low pressures and long mean free path, as already discussed in our recent paper [23].
- Gas rarefaction (iii), plateau phase (iv): the current decreases due to gas rarefaction, which would also imply a reduction in sputtering at the target. Due to the lower gas density in front of the target, however, the transport from target to substrate improves, which may eventually result in an almost constant growth rate during the plateau phase. The ion fluxes are dominated by ionized neutrals in front of the substrate rendering the ion currents in sync with the plasma current.
- Decay (v): directly after plasma shut down, the generation of sputtered neutral titanium stops. The growth rate decays following the temporal evolution of the titanium ion flux.
This comparison between the time-resolved growth rate and the composition and energies of the particle fluxes illustrates that film growth during the plasma on time of the HiPIMS pulse is dominated by fast neutrals and by ions, which are created from ionizing neutrals in front of the substrate. During the off-time of the HiPIMS pulse, film growth is dominated by ions which may reach the substrate very late after plasma ignition due to their long travel time from target to substrate.
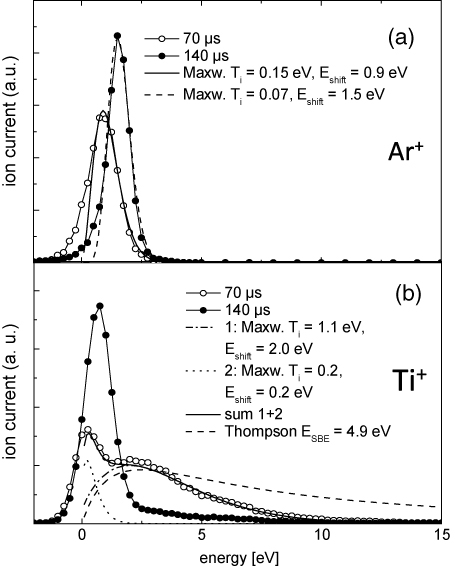
The energy distributions for Ar+ and Ti+ are shown in figure 10 at 70 µs (during the current maximum) and at 140 µs (during the plateau) after plasma ignition together with the model based on a shifted Maxwellian.
Figure 10. Ion energy distributions for argon ions (a), titanium ions (b) for a 400 µs HiPIMS pulse at 0.5 Pa at 70 µs (open circles) and at 140 µs (solid circles); models according to equations (2) and (1), the parameters are indicated.
Download figure:
Standard image High-resolution image
- Argon ions: the argon ion energy distribution (figure 10(a)) at 70 µs during current maximum can be fitted with a temperature of the order of Ti = 0.15 eV and an energy shift Eshift = 0.9 eV induced by the sheath potential in front of the substrate. The ion temperature decreases in the plateau phase at 140 µs to Ti = 0.07 eV, but the energy shift increases to Eshift = 1.5 eV. Apparently, the sputter wind of titanium neutrals eventually also accelerates the argon ions slightly.
- Titanium ions: the distribution functions of Ti+ ions (figure 10(b)) at 70 µs has to be fitted with a bimodal distribution using a cold group of titanium ions with an ion temperature of Ti = 0.2 eV and a very low energy shift of Eshift = 0.2 eV and a high-energy contribution with an ion temperature of Ti = 1.1 eV and an energy shift of Eshift = 2 eV. This bimodal distribution redistributes in energy space until a low-energy distribution with an energy shift of Eshift = 1 eV becomes dominant and a vanishing high-energy tail.
Summarizing, one can state that the analysis of the energy distributions for the 400 µs pulse clearly shows an energy input from the hot titanium ions, which cool down as the HiPIMS pulse progresses by an energy transfer to the abundant argon ions.
This peculiar temporal sequence of incident ions versus growth rate may lead to a targeted design of substrate biasing, as already introduced by Grecynski et al [13], to shape the energy input during film growth. Such substrate biasing concepts are, however, difficult to develop because it will depend very sensitively on all transport times between target and substrate, which depend sensitively on the geometry of the reactor and the exact nature of the plasma. This poses an important challenge for the future experimental and theoretical studies in this field.
4. Conclusion
The temporal distribution of the incident fluxes of ions on the substrate during a HiPIMS pulse with pulse lengths between 50 to 400 µs and peak powers up to 6 kW are measured by energy-resolved ion mass spectrometry. The data are correlated with the time-resolved growth rate from [23] and with phase-resolved optical emission spectroscopy of the dynamic of the HiPIMS plasma build-up and decay. Four ion contributions impinging on the substrate at different times and energies are identified.
- (i)After ignition, an ionization zone travels to the substrate and ionizes argon neutrals in front of the substrate leading to an initial argon ion burst after ignition.
- (ii)During the current maximum at 50 µs an ion population is created in front of the target, which reaches the substrate only after few 100 µs depending on pressure. The energy of this ion population arriving at the substrate may be very small, because they are only accelerated in the substrate sheath in the afterglow.
- (iii)During the on-time of the HiPIMS pulse, the ion current on the substrate is dominated by argon and titanium ions originating from ionized neutrals in front of the substrate. Due to the short transport time of neutrals from target to substrate, this contribution to the ion current is in phase with the plasma current. The kinetic energy of titanium ions is much higher than that of argon ions, since their energy originates from energetic neutrals from the sputtering process, which are eventually ionized in the plasma before they are finally accelerated in the substrate sheath. Depending on the ionization degree of the plasma, ion–ion collisions may cause a thermalization of these energetic titanium ions with ion temperature up to 2 eV. At lower ion density, a bimodal distribution for titanium ions is observed with a thermal contribution and a high-energy tail.
- (iv)At plasma shut down, a small burst of energetic ions is observed, when the ion density in front of the substrate is high. This burst of ions, is induced by a change in plasma potential due to the loss of hot electrons.
Based on the excellent temporal resolution of the ion fluxes and the growth fluxes, different timescales for transport processes are postulated, which will be investigated in more detail in the future. It will be especially important to use these values as a benchmark for the theoretical description of HiPIMS plasmas.
In future experiments, we will also monitor the incident flux of neutral species and attempt to quantify all incident fluxes. Finally, it will be important to expand the presented methodology to long pulses with high peak powers to also investigate the self-sputtering regime of HiPIMS.
At the end, these experiments may lead to design rules for the targeted generation of HiPIMS plasmas and for synchronized biasing concepts to further improve the capabilities of HiPIMS processes.
Acknowledgments
The authors would like to thank Norbert Grabkowski for his technical support. This project is supported by the DFG (German Science Foundation) within the framework of the Coordinated Research Center SFB-TR 87 and the Research Department 'Plasmas with Complex Interactions' at Ruhr-University Bochum.