


ABSTRACT
In this paper we report on a two-year study to estimate the Ne/O abundance ratio in the gas phase of the local interstellar cloud (LIC). Based on the first two years of observations with the Interstellar Boundary Explorer, we determined the fluxes of interstellar neutral (ISN) O and Ne atoms at the Earth's orbit in spring 2009 and 2010. A temporal variation of the Ne/O abundance ratio at the Earth's orbit could be expected due to solar cycle-related effects such as changes of ionization. However, this study shows that there is no significant change in the Ne/O ratio at the Earths orbit from 2009 to 2010. We used time-dependent survival probabilities of the ISNs to calculate the Ne/O abundance ratio at the termination shock. Then we estimated the Ne/O abundance ratio in the gas phase of the LIC with the use of filtration factors and the ionization fractions. From our analysis, the Ne/O abundance ratio in the LIC is 0.33 ± 0.07, which is in agreement with the abundance ratio inferred from pickup-ion measurements.
Export citation and abstract BibTeX RIS
1. INTRODUCTION
Interstellar neutral (ISN) atoms enter the inner heliosphere due to the relative motion between the Sun and the local interstellar cloud (LIC) and can be detected at the Earth's orbit. The Interstellar Boundary Explorer (IBEX; McComas et al. 2009) has measured interstellar atoms using its highly sensitive single pixel camera, IBEX-Lo (Fuselier et al. 2009). These observations of neutral atoms provide important information about the LIC, such as the LIC temperature, the direction and speed of its motion relative to the heliosphere, and the abundance ratios of the LIC components. Bochsler et al. (2012) estimated the Ne/O abundance ratio in the LIC using IBEX-Lo observations in 2009. They estimated that the Ne/O abundance ratio in the gas phase of the LIC is 0.27 ± 0.10. Bzowski et al. (2013) used a time-dependent model to calculate the survival probabilities of the ISNs and the flux ratio from Bochsler et al. (2012), and estimated the Ne/O abundance ratio in the gas phase of the LIC to be on the order of 0.160 ± 0.064.
In previous studies, the Ne/O abundance ratio in the LIC was estimated using pickup-ion (PUI) measurements (Gloeckler & Fisk 2007) and photoionization models (Slavin & Frisch 2008). Gloeckler & Fisk (2007) inferred the Ne/O ratio in the gas phase of the LIC as 0.38 ± 0.10 based on PUI measurements observed by SWICS on it Ulysses. The PUI method provides a very local sample, but is indirect in the sense that derivative populations are measured. The quantity sought (i.e., the abundance ratio) is obtained from a two-tier modeling. This method includes modeling the distribution of the parent populations of interstellar gas between the Sun and the detector and the production of PUIs via ionization of the neutral species by solar factors and subsequent PUI transport from the injection point to the detector location. Slavin & Frisch (2008) estimated the abundances of elements in the LIC via their photoionization models, in which the input parameters are constrained by the column densities of the LIC elements toward  CMa and observations of the neutral He atoms, PUIs, and anomalous cosmic rays. They estimated the Ne/O ratio of 0.37 in the gas phase of the LIC. These previous values are higher than the ratio inferred by Bochsler et al. (2012).
The abundances of elements in the interstellar medium (ISM) have also been studied with X-ray spectroscopy. Juett et al. (2006) estimated the interstellar Ne/O abundance ratio along several lines of sight as 0.185 ± 0.055. This estimate comes from the X-ray spectroscopy of absorption edges in bright X-ray binary stars, which are ⩾2 kpc from the Sun. The spectroscopic method provides column densities of kinematic components for several stars from long, multi-parsec lines of sight. This method requires interpretation of the components as well as identification of the component corresponding to the gas local to the Sun, i.e., belonging to the LIC. The ratio inferred by Juett et al. (2006) is consistent with the ratio derived from the standard solar abundances (Young 2005). The abundances of elements in solar system material are commonly adopted as references for the studies of the chemical composition of the ISM. The Ne/O solar abundance ratio has been studied in solar system material: the Ne/O abundance ratio is 0.153 ± 0.004 in solar energetic particles (Reames 1998), 0.14 ± 0.01 in the solar wind (Bochsler 2007), and 0.17 ± 0.05 in the solar photosphere (Young 2005).
The previous studies of the O abundance in the ISM took into account the depletion of O in the dust phase (Savage & Sembach, 1996; Meyer et al. 1998; Wilms et al. 2000; André et al. 2003; Linsky et al. 2006; Juett et al. 2006). Also the isotopic composition of the LIC, measured in the anomalous cosmic ray population, approximately agrees with the solar values: 20Ne/22Ne ∼ 13.7 and 16O/18O ∼ 500 (Leske 2000). These results suggest that the total abundances of gas and refractory material in the solar system and the LIC are similar to each other and then the neutral atoms missing from the gas-phase are depleted in dust grains. This hypothesis and the comparison of our result and the ratios estimated from the ISM and solar abundances will be discussed in Section 6.3.
In this study we revisit the Ne/O ratio directly observed at the Earth's orbit by IBEX by including more data, correcting the derivation for determining the abundance ratio, and including a time dependent survival probability of the ISNs. We analyzed the measurements of the ISN O and Ne for the 2009 and 2010 IBEX-Lo ISN gas observation seasons. From these measurements, we estimated the Ne/O abundance ratios at the Earth's orbit using two IBEX-Lo energy channels, with central energies of 279 eV (ESA 5) and 601 eV (ESA 6) for the incident neutral O. The method applied to the estimates of the Ne/O ratio at the Earth's orbit used by Bochsler et al. (2012) was reviewed and corrected due to the revised efficiencies of incident neutrals in IBEX-Lo sensor, which is discussed in Section 5. A possible change of neutral Ne/O ratio at the Earth's orbit could be expected due to solar cycle effects, such as a change of ionization radiation. Then the Ne/O abundance ratios at the termination shock (TS) were calculated using the time-dependent survival probabilities of ISN O and Ne following the approach of calculations proposed by Bzowski et al. (2013). The total Ne/O abundance ratio in the LIC was obtained from extrapolation of the Ne/O abundance calculated at the TS using the heliospheric interface filtration factors (Izmodenov et al. 2004; Cummings et al. 2002) and ionization fractions of oxygen and neon in the LIC (Slavin & Frisch 2008).
The paper is organized as follows: in Section 2 we briefly summarize the IBEX-Lo sensor and its measurements; Section 3 contains the analysis of the calibration data time-of-flight (TOF) spectra, the branching ratios, and the conversion efficiencies; Section 4 contains flight data analysis; Section 5 provides the discussion of the estimated Ne/O abundance ratios at the Earth's orbit with the refined method; Section 6 compares the Ne/O abundance ratio in the LIC with the previous studies; and Section 7 contains the conclusions from this investigation.
2. INSTRUMENT
The IBEX-Lo sensor measures neutral atoms from 10 eV to 2 keV in eight partly overlapping, logarithmically spaced energy bands (Fuselier et al. 2009). The spacecraft is orbiting the Earth in a highly elliptical orbit with a period of approximately eight days in 2009–2011 (McComas et al. 2009). Since the spin axis of the spacecraft points nearly toward the Sun, the ISN gas flow can be observed at the perihelion of the incoming ISN gas flow trajectories (see Figure 1 in Fuselier et al. 2009 or Figure 2 in Möbius et al. 2012). The ISN flow parameters from IBEX measurements are  km s−1, 79
 0
0 ecliptic longitude, and −498 ± 021 ecliptic latitude (McComas et al. 2012a). Due to the attraction of the Sun's gravitational force, the ISN gas flow speed increases to ∼48 km s−1 at 1 AU from the Sun. In the spring season (January to March), the Earth moves into the flow and the speed of the atoms relative to the IBEX-Lo sensor is ∼78 km s−1, which is the sum of the Earth's orbital speed and the flow speed at 1 AU from the Sun. Assuming that interstellar O and Ne atoms have the same flow speed as interstellar He, the bulk energy of the 78 km s−1 ISN O in the IBEX-Lo sensor is ∼505 eV and the energy of the ISN Ne is ∼630 eV. This assumption is reasonable because the O and Ne flow peak position in ecliptic latitude is very close to that of the interstellar He atoms (Möbius et al. 2012). These identical flow peak positions indicate that the speeds of the primary He and O flows are identical. We can consider the newly created neutral O atoms in the outer heliosheath due to the charge exchange between the interstellar oxygen ions and H atoms. These re-neutralized O atoms should have lower energy and higher temperature than the primary ISN O gas flow due to the decelerated and heated oxygen ions in front of the heliopause. They are called the secondary population and may be observed in shifted from the primary flow due to the lower kinetic energy. Since, in this study, we only consider the primary flow, the secondary component contributions were ignored. Only data measured in the relevant energy ranges during the spring season are used in the presented analysis.
The IBEX-Lo sensor consists of a collimator, conversion surface, electrostatic analyzer, and TOF spectrometer. The incident neutral atoms enter the instrument through the collimator and hit a diamond-like tetrahedral amorphous carbon conversion surface, which, even after many years in space, is covered with a thin water layer. After colliding with the conversion surface, a fraction of the neutral atoms is converted to negative ions and another fraction creates sputtered atoms, ions, and molecules from the conversion surface (Wurz et al. 2008), of which the negative ions are important for detection in IBEX-Lo. Noble gas atoms, such as He and Ne, only produce negative ions that are sputtered products. Hereafter the converted ions represent the negative ions due to the results of the incoming H and O atoms, and the sputtered products indicate the ions due to the result of the sputtering. The TOF spectra registered in the IBEX-Lo sensor include contributions both negative ions of the genuine interstellar atoms and those of the sputtered products, and thus are quite complex. They will be discussed in detail in Section 3. After the conversion or sputter process, the negative ions pass a toroidal energy/charge (E/q) filter (electrostatic analyzer, ESA), which has eight energy channels. Each energy channel has a relatively wide energy band, ΔE/E = 0.7. Finally, negative ions exiting the ESA are accelerated through a potential of 16 kV and enter the TOF detector section. The TOF mass spectrometer consists of two thin carbon foils and a microchannel plate (MCP) detector. Three TOF values (TOF0, TOF1, and TOF2) are determined between the two foils and the MCP in the TOF section. In our analysis we use the triple coincidence (three valid TOF values) events that satisfy the criterion: TOF0 + TOF3= TOF1 + TOF2, where TOF3 is a delay line measurement at the MCP detector that provides a rough position information. This is the so-called triple coincidence technique, which provides excellent noise and background suppression.
3. CALIBRATION DATA ANALYSIS
In order to obtain Ne/O ratios from the TOF spectra observed during the passages of the interstellar gas flow, we need to evaluate spectra measured during the pre-flight instrument calibration with pure neutral oxygen and neon beams, which reveal the presence of negative carbon and oxygen ions from sputtering on the conversion surface. We will first analyze these TOF spectra in detail in Section 3.1 and then derive C− and O− branching ratios for O and Ne of the expected impact energies in Section 3.2. These branching ratios, along with the absolute detections efficiencies will be the basis for the analysis of the flight data in Section 4.
3.1. The Time-of-flight Analysis
In order to understand the measured TOF spectra, extensive testing was performed in vacuum at the University of Berns calibration facility, MEsskammer für Flugzeit InStruments und Time-Of-flight (MEFISTO). During calibration, beams of several neutral species (H, He, C, O, and Ne) were used over an energy range of 10 eV to 2 keV in steps equal to the ESA energy channels (Wurz et al. 2008). To maintain consistency, we will use only TOF2 data with triple coincidence in the following analysis, where TOF2 is a flight time between two thin carbon foils in the TOF detector (Fuselier et al. 2009). Also, instrumental effects on heavy species, such as the energy loss at the carbon foils, are minimized in TOF2 over the other two TOFs. Hereafter we change the nomenclature and use TOF for TOF2. Figure 1 shows two sample TOF spectra recorded in the mass spectrometer of the IBEX-Lo sensor. The top panel shows the TOF spectrum for a 403 eV Ne-atom beam entering the IBEX-Lo sensor and passing through the corresponding ESA energy channel (ESA 6). Three peaks are observed in the TOF spectra at 17 ns, 58 ns, and 68 ns, which correspond to the flight times of hydrogen, carbon, and oxygen ions, respectively. Since Ne atoms do not form stable negative ions with sufficient efficiency, they cannot be directly identified in the TOF spectrum, but they do sputter material from the conversion surface. Therefore the mass peaks identified as H−, C−, and O− are caused by recoil sputtering of negative ions from the conversion surface due to the incoming Ne atoms.
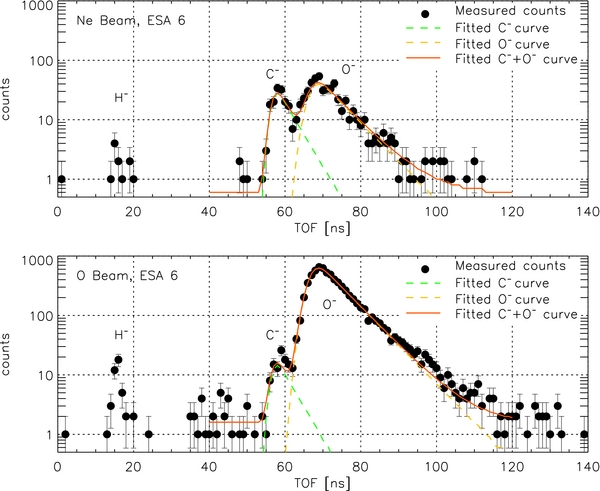
Figure 1. Time-of-flight spectra obtained with the IBEX-Lo sensor using an Ne-atom beam (upper panel) and O-atom beam (lower panel). The beam energy was 403 eV. The measured data points (black circles) of the C− and O− peaks have been fitted using a nonlinear least squares method of two exponentially modified Gaussians (see Equations (1) and (2)).
Download figure:
Standard image High-resolution imageUnlike Ne, O atoms are converted to negative ions on the conversion surface and are directly identified in a TOF spectrum. The bottom panel of Figure 1 is the TOF spectrum for a 403 eV O-atom beam passing through the corresponding ESA energy channel. One can see the dominant peak identified as O− and the relatively small peaks identified as H− and C−. The O− peak should represent the TOF distribution of the converted oxygen ions due to the incoming O atoms. A fraction of O atoms can also sputter H−, C−, and O− from the conversion surface. The amount of those sputtered products is typically relatively small at ESA energies close to the beam energy, but can be a considerable for lower ESA energies.
The shape of the TOF distribution in Figure 1 has extended tails toward long TOFs due to the energy loss during the ion passage through the thin carbon foil. Therefore, individual peaks in the TOF spectra were fitted by an exponentially modified Gaussian (EMG) function, which is written as
where C(t) denotes the number of counts per TOF interval (in this study the unit interval is 1 ns) and t is the TOF. The parameter a0 is the area of the peak, a1 is the peak center, a2 is the standard deviation of the Gaussian component (width), and a3 is the exponential slope describing the asymmetry of the peak (distortion), which characterizes the decay of the exponential distribution (Li & McGuffin 2008). As a consequence of the long tails, the TOF distributions of C− and O− are not fully resolved. In order to estimate the amount of each measured species, the two peaks were simultaneously fitted using a nonlinear least-squares method with the model from Equation (1) for each. The model equation is a sum of two EMGs and a constant background:

To avoid biased estimates, parameters representing the positions, widths, and distortions of two peaks were fixed. These fixed parameters were determined from the TOF spectra of C-atom beams and O-atom beams, also obtained during the calibration of the instrument (see Appendix A.1). The free fit parameters were the areas under two peaks and the background counts. A detailed description about the fitting is provided in Appendix A.2. In Figure 1, the green and orange dashed lines represent the fitted curves of the C− and O− peaks, respectively. The superposition of two fit curves with background counts is represented by the red line.
3.2. Branching Ratios in the Calibration Data
The converted ions and the sputtered products have different energy distributions. While converted ions have an energy distribution that is slightly shifted to lower energies than the bulk energy of the incoming neutrals, the sputtered products have broad energy distributions that start below the incident energy and extend down to very low energies (Möbius et al. 2012). The energy dependence of the branching ratios of three species, derived from the TOF spectra, shows the features of different energy distributions. The branching ratio is defined as a ratio of a peak area to the sum of three peak areas. The three peak areas identified as H−, C−, and O− in a TOF spectrum are specified by the areas under respective fitted curves. In Figure 2, which shows the branching ratios for 403 eV and 780 eV O-atom beams, the portion of the converted oxygen ions dominates in the ESA channel corresponding to the incident beam energy, but their importance decreases significantly in lower energy channels. On the other hand, the portion of sputtered C− and H− increases and levels off at energy channels below the energy channel of the incident oxygen beam (see also Table 1). For the Ne-atom beams, the same feature is clearly seen in the branching ratios of sputtered H− (see Table 1).
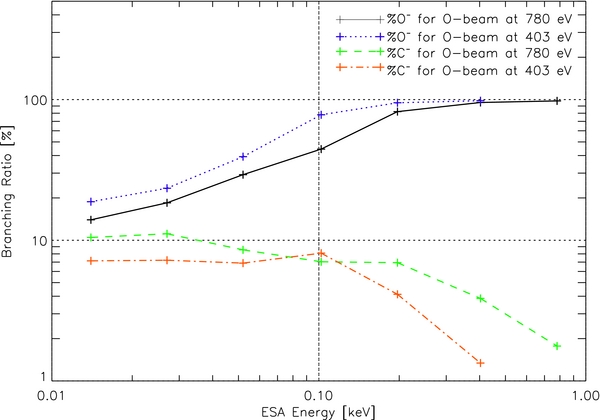
Figure 2. Branching ratios of the C− (green and red lines) and O− (black and blue lines) peaks in the TOF spectra of 403 eV and 780 eV O-atom beams.
Download figure:
Standard image High-resolution imageTable 1. Branching Ratios of H−, C−, and O− Peaks Derived from the TOF Mass Spectrometer Observations During Calibration at the MEFISTO Facility in Bern
| Species | Beam | ESAa | H− |  |
C− |  |
O− |  |
|---|---|---|---|---|---|---|---|---|
| (eV) | (Bin) | (%) | (%) | (%) | ||||
| Ne | 403 | 5 | 0.55 | 0.003 | 45.47 | 0.54 | 53.98 | 0.28 |
| 780 | 26.67 | 1.30 | 33.94 | 0.56 | 39.40 | 0.40 | ||
| 403 | 6 | 0.99 | 0.64 | 29.09 | 0.78 | 69.92 | 0.83 | |
| 780 | 0.69 | 0.22 | 41.94 | 0.41 | 57.37 | 0.27 | ||
| O | 403 | 5 | 0.97 | 0.02 | 4.13 | 0.05 | 94.90 | 0.06 |
| 780 | 10.99 | 0.19 | 6.93 | 0.06 | 82.08 | 0.16 | ||
| 403 | 6 | 0.47 | 0.0002 | 1.34 | 0.02 | 98.19 | 0.07 | |
| 780 | 0.78 | 0.01 | 3.86 | 0.05 | 95.36 | 0.09 |
Note. aDuring calibration, the center energies of ESA channels were set to the nominal beam energies, i.e., EESA 5 = 197 eV and EESA 6 = 403 eV.
Download table as: ASCIITypeset image
The central acceptance energy of ESA channel 6 for the incoming neutral O atoms is 601 eV and the center energy of ESA channel 5 is 279 eV after taking into account the energy loss at the conversion surface. The ESA ΔE/E is estimated to be 0.7. Those values were revised after the IBEX spacecraft was launched. Since the bulk energy of interstellar O atoms in the observer frame is 505 eV for the spring season, the interstellar O atoms can be observed as converted oxygen ions in the TOF spectrum of ESA channel 6 and as sputtered products (H−, C− and O−) in ESA channel 5. The 631 eV interstellar Ne atoms produce sputtered H−, C−, and O− in both ESA channel 5 and 6, but no converted neon because charged neon is not a stable product of the conversion process. The TOF spectra of the lower energy channels (i.e., ESA channels 4, 3, 2, and 1) also contain sputtered products from interstellar He atoms (Ebulk, He = 132 eV). Therefore, only the TOF spectra of two ESA energy channels, ESA 5 and 6, are used for the O and Ne analysis. The expected branching ratios for the ISN flow were estimated by a linear interpolation of the branching ratios derived from the TOF spectra of the calibration data in Table 1. The results are shown in Table 2. The uncertainties in Table 1 were computed from the uncertainties of the estimated area parameters by propagation of errors. In addition, we considered the conversion efficiency, as a ratio of converted and sputtered ions to incident atoms on the conversion surface. The conversion efficiencies were estimated from the calibration data. The conversion efficiency depends on both energy and species of the incident atoms. The expected conversion efficiencies for the interstellar atoms are also calculated by linear interpolation of the efficiencies estimated from the calibration data. The interpolated conversion efficiencies are in the last column of Table 2.
Table 2. Interpolated Branching Ratios for the Interstellar Ne and O Neutral Atoms
| Species | Beam | ESAa | H− (%) | C− (%) | O− (%) | C−/O− | Efficiency | ||||
|---|---|---|---|---|---|---|---|---|---|---|---|
| (eV) | (Bin) |  |
 |
 |
 |
 |
 |
α | σα | ηNeb | |
| Ne | 631 | 5 | 16.37 | 1.46 | 38.49 | 2.30 | 45.15 | 1.82 | 0.853 | 0.061 | 8.15 × 10⁻³ |
| Ne | 6 | 0.81 | 1.47 | 36.87 | 2.65 | 62.32 | 2.64 | 0.592 | 0.049 | 4.74 × 10⁻³ | |
 |
 |
 |
 |
 |
 |
β | σβ | ηOb | |||
| O | 505 | 5 | 3.68 | 0.77 | 4.89 | 0.23 | 91.43 | 0.86 | 0.054 | 0.003 | 1.90 × 10⁻² |
| O | 6 | 0.55 | 0.04 | 2.02 | 0.21 | 97.42 | 0.33 | 0.021 | 0.002 | 1.46 × 10⁻² | |
Notes. aThe ESA setting is the same as in Table 1: EESA 5 = 197 eV and EESA 6 = 403 eV. bThe conversion efficiencies have a large relative uncertainty of approximately 30%.
Download table as: ASCIITypeset image
4. FLIGHT DATA ANALYSIS
IBEX has observed the ISN gas flow distribution for O and Ne at the Earth's orbit for four interstellar flow "seasons," 2009 through 2012. A season is defined as the interval of time starting in early January and extending through February where ISNs are observed in the IBEX-Lo sensor. For the first two seasons in 2009 and 2010, the IBEX-Lo sensor was operated using all eight ESA channels in the low-angular resolution mode. The interstellar O and Ne flow was clearly observed in ESA channel 5 and 6. In 2011, the sensor was run in the high angular resolution mode using only two ESA channels (ESA 2 and 6). In 2012, the low angular resolution mode was used, but only ESA channel 6 was used, which is optimized for O. The special mode data for 2011 and 2012 have not been completely analyzed yet. The analysis of the Ne/O ratio for the special mode is difficult because of the missing information from ESA channel 5 and currently ongoing. In this study, we focus on the flight data from the first two years (IBEX orbit 14–19 in 2009 and 61–68 in 2010).
The IBEX-Lo sensor detects ISN atoms and globally distributed fluxes of neutral atoms produced through charge exchange of neutral interstellar atoms with ions in the heliosheath (Fuselier et al. 2012; McComas et al. 2012b). In addition, it detects energetic neutral atoms from the Earth's magnetosphere (Fuselier et al. 2010). In order to select only the ISN atoms, we used only the direct events within 3σ from the peak position of the angular distribution of ISNs in ecliptic latitude (between the two blue vertical lines in Figure 3). We then excluded data for the time intervals when the Moon was in the field of view of IBEX-Lo and the spacecraft passes through the Earth's magnetosphere or the magnetosheath (Fuselier et al. 2012).
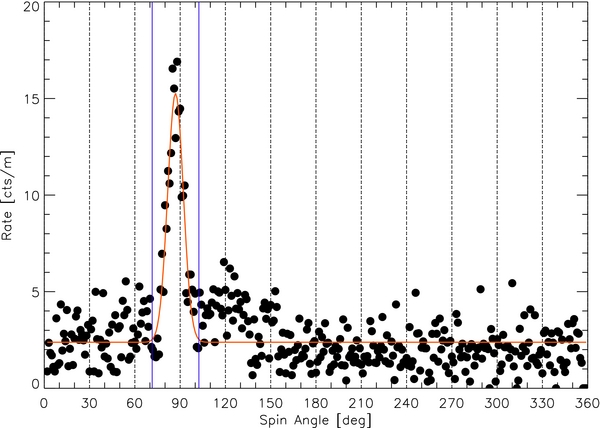
Figure 3. Angular distribution in spin angle of the neutral atoms registered in ESA 5 accumulated over IBEX orbit 14 to 19. The red line represents the Gaussian fit curve and the blue vertical lines indicate the ±3σ from the flow peak position.
Download figure:
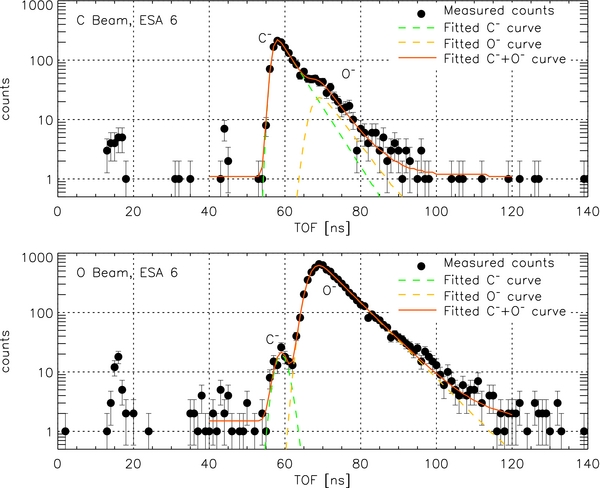
Standard image High-resolution imageFigure 4 shows the TOF spectra of the ISN flow measured by ESA channel 5 and 6 during 2009 and 2010 ISN spring seasons. The black circles represent the TOF distributions of the ISN gas flow. The error bar of each data point corresponds to Poisson statistical uncertainties. In order to determine the C−/O− ratios measured in flight with IBEX-Lo, the TOF peaks were fitted using a maximum likelihood method with the two EMG functions based on Poisson probabilities (see Appendix A.3). The fitted curves of individual peaks in the TOF spectra are shown in Figure 4 as the green and orange dashed lines for C− and O−, respectively. The red line indicates the superposition of the C− and O− peaks. The blue dashed line represents a peak of negative hydrogen ions, which is fitted to an EMG function with four free parameters.
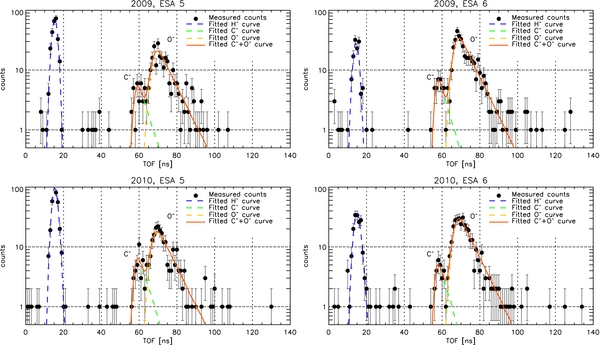
Figure 4. TOF spectra of observations in 2009 (top) and 2010 (bottom) in ESA channel 5 (left) and 6 (right) along with fitted curves. The dashed lines represent the fit curves of the individual peaks and the red line is the superposition of the C− and O− peaks.
Download figure:
Standard image High-resolution imageIn the TOF spectra, substantial H− peaks are observed. The conspicuous H− peaks result from both converted ions of the globally distributed H atoms and sputtering due to the interstellar O and Ne atoms. Indeed, the ISN flow peak in the angular distribution includes both a small fraction of globally distributed neutral atoms and ISN atoms. There is no way to directly distinguish these two sources of H− peak. Therefore, we produce two TOF spectra: one with direct events within ±3σ from the ISN gas flow peak in the angular distribution of the neutral atoms (between the two vertical lines in Figure 3), and the other with direct events outside the flow peak, which are mostly associated with the globally distributed neutral atoms (outside the two vertical lines in Figure 3). In these two TOF spectra, the areas of individual peaks were estimated by fitting an EMG function to each peak separately as described in Appendix A.3 and then normalized to the respective spin angle range: Anorm, X = AX/Δθ, where AX is an estimated area of peak, X denotes the species (H−, C−, and O−), and Δθ is a spin angle range for the flow peak or the distributed neutrals. The normalized areas of peaks in the spectrum of the distributed neutral atoms (Anorm, X, dist) were subtracted from the normalized areas of peaks in the spectrum of the ISN flow (Anorm, X, peak): AX = Anorm, X, peak − Anorm, X, dist. The branching ratio is a ratio of the normalized area of a peak to the total area: χX = (AX/∑XAX). The contribution of the distributed neutral atoms to the observed ISN flux is significant for the H− branching ratio, but it is only a small effect for the C− and O− branching ratios and it is correct for. The resulting branching ratios and the C−/O− ratios (χ) are summarized in Table 3. The total uncertainty of the branching ratio ( ), resulting from both the statistical uncertainty of the area parameter (σA) and the uncertainty between the fit curve and the measured counts (σfit), is given by
  , where σA is derived from Equation (A1) in Appendix A.2,
  , Ci are measured counts, C(ti) is the value of fit curve, and nf is the number of degrees of freedom. Since the bulk energy of the interstellar O neutrals (Ebulk, O = 505 eV) is largely in the energy window of the ESA 6 (E = 601 eV for the incident O atoms, ΔE/E = 0.7), O neutrals are optimally observed in this energy channel as converted oxygen ions. Due to the energy distribution of the sputtered products, 631 eV interstellar Ne atoms can be observed in both energy channels ESA 5 and 6 by the resulting sputtered carbon and oxygen ions. The sputtered carbon and oxygen ions due to the interstellar O atoms can also be observed in the ESA 5. Therefore, ESA 5 is optimal for observing sputtered products from both O and Ne. These features are seen in the branching ratios in Table 3. The oxygen ions are dominant in the TOF spectra of the ESA 6 (more than 80%), but the carbon and hydrogen ion content increases in the TOF spectra of ESA 5.
Table 3. Branching Ratios Measured by IBEX-Lo in 2009 and 2010
| Year | ESA | E a |  |
 |
 |
 |
 |
 |
C−/O− |  |
|---|---|---|---|---|---|---|---|---|---|---|
| (Bin) | (eV) | (%) | (%) | (%) | ||||||
| Before Subtracting the Contribution of the Distributed Neutral Atoms | ||||||||||
| 2009 | 5 | 279 | 47.61 | 1.78 | 7.72 | 1.74 | 44.68 | 1.98 | 0.173 | 0.040 |
| 6 | 601 | 19.52 | 0.80 | 8.80 | 1.46 | 71.68 | 1.55 | 0.123 | 0.021 | |
| 2010 | 5 | 279 | 58.90 | 2.24 | 7.89 | 1.84 | 33.20 | 2.14 | 0.238 | 0.057 |
| 6 | 601 | 29.49 | 1.71 | 6.71 | 1.41 | 63.79 | 1.99 | 0.105 | 0.022 | |
| ISN Flow Corrected for the Contribution of the Distributed Neutral Atoms | ||||||||||
| 2009 | 5 | 279 | 25.35 | 1.45 | 10.57 | 2.69 | 64.08 | 2.58 | 0.165 | 0.042 |
| 6 | 601 | 5.24 | 0.26 | 10.35 | 1.77 | 84.41 | 1.76 | 0.123 | 0.021 | |
| 2010 | 5 | 279 | 34.63 | 3.23 | 12.28 | 3.24 | 53.10 | 3.59 | 0.231 | 0.063 |
| 6 | 601 | 11.51 | 2.09 | 8.27 | 1.87 | 80.21 | 2.59 | 0.103 | 0.024 | |
Note. aHere E represents the center energies of the incident O atoms corresponding to ESA channel.
Download table as: ASCIITypeset image
The observations of the IBEX-Lo sensor reveal that the ISN He flow is observed with a very stable count rate, that only varies consistent with the changes in the ionization rate (Möbius et al. 2012). This tells us that the sputtering efficiency for He is very stable, which can then be transferred to the sputtering efficiencies for the heavier species. In addition, we perform regular MCP scans in flight to determine possible degradation of the MCP. After five years in flight we have not observed any signs of aging, i.e., efficiency change.
5. NE/O ABUNDANCE RATIOS AT EARTH'S ORBIT
The Ne/O abundance ratio at Earth's orbit is determined from the branching ratios and the C−/O− ratios derived from the calibration (Table 2) and flight data (Table 3). We denote αX as the branching ratios observed with the calibration Ne-atom beam, βX the branching ratios observed with the calibration O-atom beam, and χX are the branching ratios from the flight data, where X denotes species (H−, C−, or O−). Let N be a total number of negative ions registered in the TOF spectrum of the flight data. Note that the incoming neutrals are changed to negative ions passing through the conversion surface. Assuming that only ISN O and Ne atoms are observed in the IBEX-Lo sensor at the energies of interest, we formulate

where NNe and NO are the numbers of Ne and O atoms that strike the conversion surface, ηNe and ηO are the conversion efficiencies for Ne and O atoms, and  are the numbers of negative ions registered in the flight TOF spectrum for each negative ion species. This assumption is reasonable because the predominant heavy elements in the LIC are He, C, O, Ne, and N. Interstellar He atoms are only observed in lower energy channels (⩽ ESA 4) because of the low He bulk energy (∼132 eV; Möbius et al. 2012). The N density is a factor of two lower than that of Ne in the LIC (Gloeckler & Fisk 2007). Since the charge exchange cross-section for N and solar wind proton is comparable to the one for O (Lindsay & Stebbings 2005), a comparable fraction of the interstellar N atoms are ionized before reaching 1 AU. Therefore, the density of the interstellar N at the Earth's orbit is much lower than the O and Ne densities. Interstellar C is highly ionized in the LIC and thus is almost completely absent inside the heliosphere. Likewise, Mg through Fe are mostly ionized in the LIC and thus do not make it inside the heliosphere. Therefore, we expect useful negative ion yields of two elements O and Ne for the ESA energy channel 5 and 6. The number of negative carbon ions (or oxygen ions) registered in the flight TOF spectrum is the product of the total number of negative ions and the branching ratio of carbon ions (or oxygen ions):
Since the negative ions are produced by the incoming O and Ne atoms, the number of negative ions can be also derived from the branching ratios of the calibration data and their conversion efficiencies:
From Equations (4) and (5), the ratio of the number of negative carbon ions to number of negative oxygen ions can be estimated as:

where χ is the ratio of  to
to  . Now we rearrange this equation:
where α is the C−/O− ratio observed with the Ne-atom beam ( ), β is the C−/O− ratio observed with the O-atom beam (
 ), and γ is the ratio of the conversion efficiencies for Ne and O atoms (γ = ηNe/ηO). Equation (7) represents the Ne/O abundance ratio at the IBEX location (Earth's orbit). The left-hand side of Equation (7) is independent of energy, but the individual values on the right hand side depend on the center energy of the ESA channel. Therefore we are able to calculate four independent ratios from the two years of data and the two ESA channels. The results of the calculation of the Ne/O abundance ratios at the Earth's orbit from observations over the two years are compiled in Table 4. The errors of the ratios were determined with error propagation (Bevington & Robinson 1997). Since we use the time-dependent survival probabilities for 2009 and 2010 to estimate the ratio at the TS, the error-weighted mean of the ratios for the two ESA channels would be the Ne/O abundance ratio at the Earth's orbit (weighted according to the inverse variance). The weighted means of the Ne/O abundance ratio at the Earth's orbit are 0.93 ± 0.43 in 2009 and 0.94 ± 0.44 in 2010. While the small increase in the Ne/O ratio from 2009 to 2010 appears to be consistent with the slight increase in the ionization rates due to the rise in solar activity, the resulting mean values are still identical within their uncertainties. In the future, we plan to test the sensitivity of the observed Ne/O ratio to changing solar activity with additional observations taken in 2011 and 2012 in special observation modes, but this work is beyond the scope of this paper.
Table 4. Ne/O Abundance Ratio at the Earth's Orbit Observed in 2009 and 2010
| Year | ESA | Ea | Ne/O | σNe/Ob | Weighted Meanc |
|---|---|---|---|---|---|
| (eV) | (1 AU) | (1 AU) | |||
| 2009 | 5 | 279 | 0.761 | 0.255 | 0.93 ± 0.43(0.16) |
| 6 | 601 | 1.044 | 0.208 | ||
| 2010 | 5 | 279 | 1.342 | 0.369 | 0.94 ± 0.44(0.18) |
| 6 | 601 | 0.811 | 0.213 |
Notes. aHere E represents the center energies of the incident O atoms corresponding to ESA channel. bThe uncertainties are derived from the error propagation with the statistical errors of the branching ratios (αX, βX, and χX). cThe uncertainties of the weighted mean are the quadratic sum of the statistical errors derived from σNe/O and the relative errors of the conversion efficiencies (30%). The values in the parenthesis are the statistical errors. (weight = 1/σ2)
Download table as: ASCIITypeset image
The ratios found in this study are roughly twice the Ne/O ratio estimated by Bochsler et al. (2012), who found that (Ne/O)1 AU = 0.40 ± 0.15. This discrepancy is attributed to the addition of the ratio  in Equation (7), which appears to be omitted in the analysis of Bochsler et al. (2012). Bochsler et al. (2012) used the ratio (γ') of the O detection efficiencies for Ne-atom and O-atom beams, which is 0.40 ± 0.14. However, the O detection efficiency for a Ne-atom (or O-atom) beam is composed as the product of the branching ratio of oxygen ions and the conversion efficiency for a Ne-atom (or O-atom) beam during calibration. The resulting ratio of the two oxygen ion detection efficiencies can then be written as
  . The value of the ratio (γ') used in Bochsler et al. (2012) appears to correspond solely to the ratio of two conversion efficiencies (ηNe/ηO). The revised value of the ratio is ∼0.23, which is approximately twice the previous value.
6. DISCUSSION
6.1. Ne/O Abundance Ratios at the TS
The neutral Ne/O abundance ratio at the TS can be inferred from the neutral Ne/O ratio measured at the Earth's orbit and modulated by the ratios of the corresponding survival probabilities. Since the incoming ISN atoms are ionized by photoionization, charge exchange, and electron impact ionization, the survival probabilities between the TS and Earth's orbit should include all of these listed ionization processes. The simplest assumption for the survival probability is that the ionization rate of ISN atoms approaching the Sun obeys 1/r2 radial dependence (Bochsler et al. 2012) and is constant in time. However, the ionization processes strongly depend on species and vary with time on timescales from hours to the solar cycle periods and longer. For ISN He and Ne, photoionization is dominant, and charge exchange is negligible. However, charge exchange with solar wind protons is an important ionization process for ISN O. To correctly account for this process, we used the model of solar wind evolution during the solar cycle (Sokółet al. 2013). Using this model, Bzowski et al. (2013) developed a time-dependent method to calculate the survival probabilities of ISN atoms. They estimated the Ne/O survival ratios for four years (2009 to 2012). The normalized flux is defined as the ratio of the flux of a species to the density of the species at the TS (Fnorm, X = FX/nTS, X). Assuming the inflow velocities at the TS for the two species are identical, the normalized fluxes are equal: Fnorm, O = Fnorm, Ne. Then the normalized fluxes at 1 AU from the Sun differ only by survival probabilities of the two species. Using the same method, which Bzowski et al. 2012 used for the analysis of ISN He, to obtain the normalized fluxes of O and Ne at IBEX precisely for the observation conditions in 2009 and 2010, we calculated the ratios of effective survival probabilities averaged over each observation season. We obtained a Ne/O survival probability ratio ( ) equal to
  in 2009 and to
  in 2010. These ratios are subject to uncertainties related to the uncertainties in the ionization factors, as extensively discussed by Bzowski et al. (2013). The estimate of the uncertainty of the survival probability ratio is adopted from this paper. The neutral Ne/O abundance ratio at the TS is then calculated as

Adopting as a mean uncertainty of the survival probability ratios ±25%, we obtain neutral Ne/O abundance ratios at the TS as 0.10 ± 0.03. This value is in agreement with the abundance ratio ( ) estimated from PUIs observations (Gloeckler & Fisk 2007).
6.2. Ne/O Abundance Ratio in the LIC
The loss rate of ISN atoms traveling through the outer heliosheath is referred to as the filtration factor. Izmodenov et al. (2004), Cummings et al. (2002), and Müller & Zank (2004) have extensively studied these factors for heavy interstellar species. A typical filtration factor for O is 0.68 ± 0.02 (Izmodenov et al. 2004) and for Ne is 0.88 ± 0.04 (Cummings et al. 2002). The neutral Ne/O abundance ratio in the LIC can be found by multiplying the neutral Ne/O ratio at the TS with the ratio of the filtration factor for O and Ne:

where ζX is the filtration factor of the species X. With these corrections, one can use the Ne/O abundance at the TS to calculate the neutral Ne/O in the LIC. The neutral Ne/O abundance ratio in the LIC is 0.08 ± 0.02.
Finally, the total Ne/O abundance in the LIC is determined by multiplying the abundance ratio of the neutral gas by the ionization fractions of these species in the LIC:
where IX is the ionization fraction of the species X. We have used the ionization fractions given by Model 26 of Slavin & Frisch (2008), i.e., 0.186 for O and 0.804 for Ne. Then, the Ne/O abundance ratio in the local interstellar gas (neutrals + ions) is 0.33 ± 0.07. Table 5 shows the abundance ratios at all these locations.
Table 5. Ne/O Abundance Ratios from the Earth's Orbit into the LIC
| Locations | Ratios |
|---|---|
| (Ne/O) at 1 AU | 0.93 ± 0.43 (2009)/0.94 ± 0.44 (2010) |
| (Ne/O) at the TS | 0.10 ± 0.03 |
| (Ne/O)neutral in the LIC | 0.08 ± 0.02 |
| (Ne/O)neutral + ion in the LIC | 0.33 ± 0.07 |
Note. The abundance ratios were estimated from the IBEX-Lo observations with survival probabilities, filtration factors, and ionization fractions discussed in the text.
Download table as: ASCIITypeset image
Figure 5 shows a compilation of interstellar and solar Ne/O abundance ratios determined by different methods. The Ne/O abundance ratio in the gas phase of the LIC derived in our analysis is 0.33 ± 0.07 (the red diamond in Figure 5), which is ∼26% higher than the result of the first-year IBEX observations (Bochsler et al. 2012). There are two contributions to the difference: (1) we use different values for the efficiencies shown in the last column of Table 2 and a modified derivation to compute the Ne/O ratio at the Earth's orbit, (2) the abundance ratio was estimated using the time-dependent survival probability instead of a constant ionization rate with 1/r2 radial dependence. Without taking into account the  term and using only the corrected ratio of ionization losses, the Ne/O abundance in the LIC would be ∼0.16, as pointed out by Bzowski et al. (2013), in close agreement with the solar values. With
  term taken into account, our abundance ratio of 0.34 is consistent with the interstellar Ne/O abundance ratio obtained from the PUI measurement, excluding the fraction of O contained in grains (Gloeckler & Fisk 2007). If we use a constant ionization rates with 1/r2 radial dependence, the Ne/O abundance ratio is increased to ∼0.63, which is far away from the values derived in the previous studies.
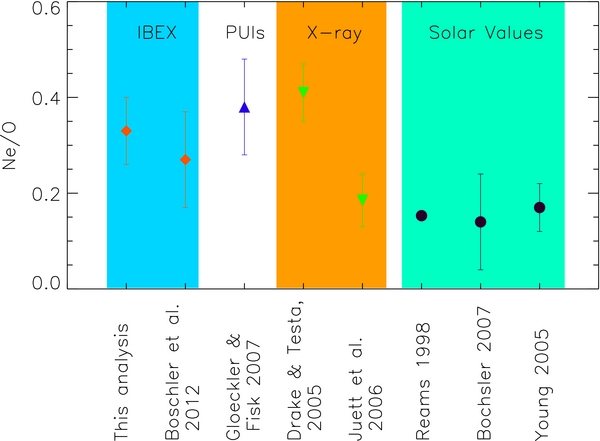
Figure 5. Ne/O abundance ratios in the local interstellar gas and at the Sun. The red diamonds are the results of the IBEX-Lo observations, the blue upward triangle is the value inferred by the PUIs observations, and the green downward triangles represent the abundance ratios adopted by the X-ray observations. The solar values are denoted as the black circles.
Download figure:
Standard image High-resolution image6.3. Comparison with the ISM and Solar Abundances
Solar abundance values have been used as a reference to compare with interstellar abundances. Using absorption lines, Asplund (2005) determined abundances in the solar photosphere, e.g., (O/H)solar ∼ 457 ppm and (Ne/H)solar ∼ 69 ppm, which results in a solar Ne/O abundance ratio of ∼0.15. Unlike for other elements, the solar Ne abundance cannot be determined directly from the photospheric spectrum due to the absence of absorption lines for Ne or Ne+. Therefore, the Ne abundance has been derived indirectly from the measurement of solar energetic particles (Reames 1998) and the EUV emission line of Ne IV-VI ions (Young 2005). Reames (1998) inferred 0.152 ± 0.004 as the Ne/O abundance ratio from gradual solar energetic particles. Young (2005) inferred a photospheric Ne/O abundance ratio of 0.17 ± 0.05, which is derived from spectra of the supergranule network and its cell center region. Bochsler (2007) estimated a solar Ne/O abundance ratio of 0.14 ± 0.01 from the solar wind observations. Overall, the solar Ne/O abundance ratios are approximately 50% lower than our ratio. Now we have to consider some controversies in the solar and ISM abundances.
Indeed, currently adopted solar abundances lead to discrepancies between the standard models of the solar interior and the helioseismological observations (Young 2005). Drake & Testa (2005) estimated the Ne/O abundance ratios in the atmospheres of 21 stars lying within 100 pc from the Sun based on emission line features in the X-ray spectra. The value inferred by Drake & Testa (2005) is 0.41, which is in good agreement with the abundance ratio inferred from helioseismology. Assuming the solar photospheric O abundance (Asplund et al. 2005), this higher Ne/O ratio leads to a higher Ne abundance (Ne/H)solar ∼ 187 ppm. The differences between the standard models and helioseismological measurements are still an unsolved problem.
The interstellar Ne/O abundance ratio has been also studied through the observations of the X-ray absorption edge. Juett et al. (2006) observed K-shell absorption edges of O and Ne in the spectra of neutron stars at ∼2 kpc from the Sun. They obtained 0.185 ± 0.055 for the line-of-sight integrated Ne/O abundance ratio in the ISM. They assumed that approximately 45% of O in the ISM might be hidden in dust grains. The presence of dust grains in the ISM is consistent with the observed interstellar extinction (Fitzpatrick 1999) and the interstellar O plays a fundamental role in modern dust models (André et al. 2003). Assuming that all grains are made of silicates, André et al. (2003) estimated the interstellar O abundances in the dust and gas phases: (O/H)dust ⩽ 180 parts per million (ppm) and (O/H)gas = 408 ± 13 ppm. The gas phase abundance is determined from the O column density along sight lines toward 19 early-type stars at distance between 1 and 10 kpc from the Sun. The resulting value is slightly higher than the O abundance derived by Meyer et al. (1998), (O/H)gas = 343 ± 15 ppm, which was derived from observations of the interstellar O absorption lines toward the stars lying within 1 kpc from the Sun. The value derived by Meyer et al. (1998) is in good agreement with the value derived by Slavin & Frisch (2008), (O/H) ppm in the LIC, which was estimated from their photoionization models. Based on these models they also inferred a LIC value for (Ne/H)gas is 123 ppm and adopt ∼35% as the fraction of O contained in dust grains. Therefore, Slavin & Frisch estimated 0.29 for the total Ne/O abundance ratio (gas + dust phase). Linsky et al. (2006) estimated (O/H)total ∼ 483 ppm in the ISM including 25% of O locked in dust grains. These previous studies indicate that 25%–45% of O in the ISM may be locked in the dust phase. Therefore, the total Ne/O abundance ratio in the LIC may be vary between 0.18 and 0.25, depending on the dust fractions for O in the LIC. However, the dust fraction of the interstellar O in the LIC is still under debate, and it is beyond the scope of this paper to settle on a standard model for dust fractions in the LIC.
In the process to estimate the Ne/O abundance ratio in the LIC from the measured ratio at the Earth's orbit, our results strongly depend on the models. Model 26 of Slavin & Frisch (2008) used the widely accepted hot Local Bubble model, which describes the ubiquitous presence of the soft X-ray background diffuse emission as the result of the emission from the interface between the hot Local Bubble plasma (T ∼106 K) and the warm LIC. In 2009, Welsh & Shelton pointed out that most of the diffuse soft X-rays are originated from the charge exchange between the solar wind ions and the inflowing ISNs and then the Local Bubble is filled with partially ionized cloudlets of temperature 7000 K surrounded by photo-ionized gas of temperature 20,000 K. This lower temperature plasma gas may lead to a lower ionization fraction for Ne and then a lower Ne/O abundance ratio approaching to the solar abundances. Therefore, the warm model may be a potential explanation for the higher Ne/O abundance ratio in the LIC than in solar abundances. However, Koutroumpa et al. (2009) stated that the temperature of the Local Bubble must be 105.65–106 K to be consistent with the solar wind charge exchange emissions and limits on the O VI emission. Frisch et al. (2011) raised a question about the exact flux of the X-rays from the solar wind charge exchange and pointed out the solar wind charge exchange models cannot explain the whole observed emission, especially in the direction of the heliosphere tail Like this there is still controversy between the solar wind charge exchange emission and cosmic soft X-ray background attributed to the hot Local Bubble. In this study, therefore, we follow the analogy of Slavin & Frisch (2008) and used the ionization fractions for O and Ne derived from their photoionization models.
7. CONCLUSIONS
In this study we analyzed the fluxes of the ISN Ne and O for two interstellar flow passages, 2009 and 2010, using two ESA energy channels (EESA5 = 279 eV and EESA6 = 601 eV for the incident O) of the IBEX-Lo. The Ne/O abundance ratio at the Earth's orbit has been estimated from the C−/O− ratios of the first two-year observations with the C−/O− ratios of pure Ne and O ground calibration beams. We used a revised version of the method applied to the analysis of the TOF spectra of the ISN atoms by Bochsler et al. 2012. The results show that the error-weighted Ne/O abundance ratio at 1 AU from the Sun is 0.93 ± 0.43 in 2009 and 0.94 ± 0.44 in 2010. There is a slight increase that could be an indicator for neutral O reduction due to more intense ionizing radiation at the rising phase of the solar cycle, but this increase is still within the statistical uncertainty and therefore there is no statistically significant change in the Ne/O abundance ratio at the Earth's orbit from 2009 to 2010.
We used an approach with a time-dependent ionization and survival probability to determine the Ne/O ratio at the TS. Using the filtration factors of the interstellar O and Ne atoms and their ionization fractions in the outer heliosheath from previous studies (Izmodenov et al. 2004; Cummings et al. 2002; Slavin & Frisch 2002), we obtained a total Ne/O abundance ratio of 0.33 ± 0.07 in the gas phase of the LIC. This Ne/O abundance ratio estimated from the IBEX-Lo observations is consistent with the ratios derived from the PUIs measurements (Gloeckler & Fisk 2007) and the photoionization models (Slavin & Frisch 2008). This ratio is higher than standard solar abundance ratios, but the observations of the anomalous cosmic rays suggested that the O and Ne abundances in the LIC and in the solar medium are consistent (Leske 2000). As mentioned in Section 6.1, there are two possible explanations to reduce the Ne/O ratio. The previous studies of the ISM abundances consider a fraction of the interstellar O is depleted onto the dust grains. The warm Local Bubble model (Welsh & Shelton 2009) may lead to a lower ionization fraction of Ne in the LIC and then derive a lower Ne/O ratio.
The authors are grateful to Martin Lee and Peter Bochsler for their valuable remarks to a draft of the paper. This work was carried out as a part of NASAs Interstellar Boundary Explorer mission with support from the NASA Explorer Program. M.B., J.M.S., and M.A.K. acknowledge the support by the Polish National Science Center grant 2012-06-M-ST9-00455. Some of us, J.P., H.K., M.B., and J.M.S., thank the International Space Science Institute (ISSI) in Bern (CH) and the science team on "Spatial and temporal studies of the heliospheric interaction with the local interstellar medium from SOHO/SWAN UV, IBEX neutral atom, and ACE and STEREO pickup ion observations" for their hospitality and very useful discussions.
APPENDIX: FITTING A TOF SPECTRUM
A.1. Determination of the Fixed TOF Parameters
The TOF spectra produced by a neon beam and an oxygen beam have three peaks identified as H−, C−, and O− (Figure 1). As mentioned in Section 3, these peaks are the results of the conversion and sputtering processes when the incoming neutral atoms hit the conversion surface. In order to estimate the number of registered negative ions (H−, C−, and O−) in the TOF spectra, the data points are fitted with the EMG function (Equation (1)). The observed H− peak in a TOF spectrum is clearly unique for each beam flux, and we can straightforwardly determine the four free parameters of the EMG function fitted to the data of the H− peak. The observed C− and O− peaks in a TOF spectrum are partly blended due to the distortion toward the longer times. The overlapping portion of the C− and O− peaks can cause an overestimate or underestimate of the parameters of the EMG function. In order to avoid biased estimates, it is necessary to determine the energy and species dependence of the EMG function parameters that are constants for each energy and species.
The TOF spectra registered with carbon and oxygen beams show a dominant peak identified as C− and O−, respectively, when the incident beam energy corresponds to the central energy of the ESA energy channel (see Figure 6). In the same TOF spectra, a minor peak is also observed to the right- (or left-) hand side of the dominant C− (or O−) peak. The data points of these two peaks identified as C− and O− have been simultaneously fitted using the least-square method by the model equation, i.e., Equation (2). The result of this fitting shows that a minor peak could have an inconsistent shape. For instance, the minor peak (O− peak) in the C-beam spectrum has a long tail toward large time, but the minor peak (C− peak) in the O-beam spectrum has a symmetric Gaussian shape instead of a long tail. However, the dominant peaks in the TOF spectra are consistent in their shape, i.e., the parameters of an EMG function for the dominant peaks roughly depend on both the incident energy and particle species. This discrepancy causes potential over- or underestimation of an individual peaks area. Therefore, we only use the results of the fitting for the dominant peaks of the TOF spectra in this analysis. The estimated parameters of the EMG function for the dominant peaks are represented in Table 6. These values will be used as fixed parameters when the TOF spectra of the other calibration data are fitted with the model equation (Equation (2)).
Figure 6. TOF spectra registered with the IBEX-Lo sensor using a C-atom beam (top panel) and an O-atom beam (bottom panel), respectively, at beam energy of 403 eV with the ESA 6. The data points (black circles) have been fitted simultaneously using the least-square method with the model equation (Equation (2)). The green and orange dashed lines represent the fitted curves of individual peaks identified as C− and O−, respectively. The red line indicates the superposition of two fit curves and background counts.
Download figure:
Standard image High-resolution image
Table 6. Parameters Obtained from EMG Curve Fit for Carbon Beams and Oxygen Beams when the Incident Beam Energies are Equal to the Central Energy of ESA Energy Channels
| Ea | C Beam | O Beam | ||||
|---|---|---|---|---|---|---|
| (keV) | Position (a1) | Width (a2) | Distortion (a3) | Position (a1) | Width (a2) | Distortion (a3) |
| 0.016 | 61.50 | 1.92 | 5.37 | 70.99 | 2.36 | 7.20 |
| 0.032 | 60.54 | 1.77 | 5.11 | 70.02 | 2.27 | 7.10 |
| 0.065 | 59.59 | 1.61 | 4.86 | 69.04 | 2.19 | 7.00 |
| 0.135 | 58.62 | 1.45 | 4.60 | 68.04 | 2.10 | 6.90 |
| 0.279 | 57.66 | 1.29 | 4.35 | 67.06 | 2.02 | 6.80 |
| 0.601 | 56.46 | 1.10 | 4.03 | 66.40 | 1.91 | 6.68 |
| 1.206 | 55.45 | 0.93 | 3.76 | 64.79 | 1.83 | 6.57 |
| 2.361 | 54.38 | 0.75 | 3.48 | 63.69 | 1.73 | 6.46 |
Note. aHere E represents the center energies of the incident O-atoms corresponding to ESA channel.
Download table as: ASCIITypeset image
A.2. Fitting of the TOF Spectra of the Calibration Data
In order to estimate the branching ratios, the TOF spectra registered in the IBEX-Lo using a neon beam and an oxygen beam are fitted by the EMG function. The data points of two peaks identified as C− and O− are simultaneously fitted with the model equation, which is the sum of two EMG functions and a background constant (see Equation (2)). The six parameters corresponding to the center position, width, and distortion are fixed with the values in Table 6. The free fit parameters are the areas under two peaks (denoted as A and B) and the background constant. The gradient-expansion method is used to compute a non-linear least squares fit to the model equation. An inverse of counts per bin (1/ci) is used as the weighting factors in this fitting process. The uncertainties of the area parameters can be computed as
where aj is a parameter (j = A or B) and  (Bevington & Robinson 1997).
A.3. Fitting of the TOF Spectra of the Flight Data
Unlike the calibration data, we deal with low counts in the flight data analysis. For the low counting statistics, Poisson statistics are appropriate and the maximum likelihood method can be used to estimate the branching ratios. The fitting method using the maximum likelihood method with Poisson statistics was developed by P. Bochsler. This method is used in the further part of this appendix.
To find the TOF spectra parameters in the flight data, we assume that the expectation value (μi) of the counts at a given TOF interval is based on a mixture of carbon and oxygen:

where A and B are the amplitudes of the C− and O− peaks, respectively. fi and gi are the normalized TOF distributions for the C− and O− peaks, respectively, which are computed using the fixed parameters from Table 6. For each value of μi, the Poisson distribution describes the probability P(ciμi) of obtaining the observed number of counts ci. The likelihood of observing any array of probabilities is a product of the probabilities over all TOF intervals:
where N is the number of TOF intervals in the array. In order to estimate the parameters A and B for an observed array of counts ci, we look for the maximum of the logarithm of the likelihood function and to that end we calculate the partial derivatives with respect to the parameters A and B:

Now we substitute Equation (A2) for μi and get the following two nonlinear equations:
They were solved using the iterative Newton method. The uncertainties of the two parameters A and B, σA and σB, respectively, can be calculated as
where the second derivatives are
(Bevington & Robinson 1997).