


ABSTRACT
The highly eccentric Be binary system δ Sco reached periastron during early 2011 July, when the distance between the primary and secondary was a few times the size of the primary disk in the H band. This opened a window of opportunity to study how the gaseous disks around Be stars respond to gravitational disturbance. We first refine the binary parameters with the best orbital phase coverage data from the Navy Precision Optical Interferometer. Then we present the first imaging results of the disk after the periastron, based on seven nights of five telescope observations with the MIRC combiner at the CHARA array. We found that the disk was inclined 27 6 ± 60 from the plane of the sky, had a half-light radius of 0.49 mas (2.2 stellar radii), and consistently contributed 71.4% ± 2.7% of the total flux in the H band from night to night, suggesting no ongoing transfer of material into the disk during the periastron. The new estimation of the periastron passage is UT 2011 July 3 07:00 ± 4:30. Re-analysis of archival VLTI-AMBER interferometry data allowed us to determine the rotation direction of the primary disk, constraining it to be inclined either ∼119° or ∼171° relative to the orbital plane of the binary system. We also detect inner disk asymmetries that could be explained by spot-like emission with a few percent of the disk total flux moving in Keplerian orbits, although we lack sufficient angular resolution to be sure of this interpretation and cannot yet rule out spiral density waves or other more complicated geometries.
Export citation and abstract BibTeX RIS
1. INTRODUCTION
A Be star is a "non-supergiant B star whose spectrum has or had at some time one or more Balmer lines in emission" (Collins 1987). In addition to the prominent line emission, other important observational characteristics of Be stars include infrared continuum excess and partial polarization of radiation. A general consensus to explain the emitting mechanism is free–free and free–bound emission from a rotationally supported equatorial-plane thin circumstellar disk formed from material ejected from the fast rotating central star. The observations (Porter & Rivinius 2003; Waters & Waelkens 1998) have shown that the distinctive phenomena of Be stars such as emission line profiles may vary over weeks to decades, due to the changes of physical conditions in the disk. One possible explanation for the short-term variations is rotational modulation of the circumstellar disk where the disk intensity profile is uneven azimuthally (Porter & Rivinius 2003), e.g., temperature or density enhancement at certain parts of the disk. As the enhanced region rotates, the integrated emission line profile varies. The long-term cyclic changes in the ratio of heights of the blueshifted and redshifted emission lines (V/R ratio) are observed in many stars, and attributed to a one-armed density wave precessing around the star (Hummel & Hanuschik 1997). Another remarkable variation is the transition between a normal B star and a Be phase where the disk is lost and rebuilt (de Wit et al. 2006).
Several mechanisms and models have been proposed to explain the formation of the gaseous disk (Porter & Rivinius 2003). The viscous decretion disk model pioneered by Lee et al. (1991) has successfully explained several key observations, and become the best candidate for explaining Be star disk formation. One key assumption in the model is that the central star is rotating rapidly. The initial velocities of Be stars are significantly higher than those of normal B stars, suggesting that fast rotation is crucial to Be phenomena (Martayan et al. 2006). In fact a recent spectrointerferometry survey of Be stars demonstrated the mean rotation rate Ω/Ωc = 0.95 ± 0.02 (Meilland et al. 2011). For such fast rotation, many instabilities such as non-radial pulsations could be sufficient to elevate stellar equatorial material into orbit (Townsend et al. 2004). Another key assumption in the viscous decretion model is a Keplerian rotation disk, which has been confirmed by recent spectrointerferometry observations of α Arae (Meilland et al. 2007) of β Canis Minoris (Kraus et al. 2012b).
δ Scorpii is a Be binary system with a high-eccentricity (e ∼ 0.94) orbit and a period of 10.74 years (Tycner et al. 2011). The binary nature was discovered with speckle interferometry by Labeyrie et al. (1974) near maximum separation. δ Sco is at a distance of 150+24−17 pc (van Leeuwen 2007). The primary of the system is a B0.5V star with a gaseous disk and the secondary is a B2V star (Bedding 1993; Tango et al. 2009). The orbital parameters of δ Sco have been revisited by several groups (e.g., Mason et al. 2009; Tango et al. 2009; Tycner et al. 2011). Tycner et al. (2011) combined radial velocity (RV) measurements from Miroshnichenko et al. (2001) with interferometric observation obtained with the Navy Precision Optical Interferometer (NPOI), and predicted the recent periastron on UT 2011 July 6 ±2 days.
δ Sco provides a unique opportunity to study active disk formation. The system did not show clear evidence of Be phenomena until the periastron in 2000. The brightness increased by 0.4 mag (Otero et al. 2001) in the visible, and spectroscopic observations showed strong Hα emission (Fabregat et al. 2000) during the 2000 periastron. The following spectroscopic and photometric observations confirmed the gradually increasing strength of Hα emission, which implied a developing circumstellar disk (Miroshnichenko et al. 2003; Gandet et al. 2002). The fact that it took two years for δ Sco to reach its optical maximum is not typical, because it took decades for other active Be disks to reach their highest optical brightness (Bjorkman et al. 2002; Telting et al. 1993). The disk started to fade in 2005 in both optical and infrared, while the Hα equivalent width was rising (Carciofi et al. 2006). The visible brightness of the system increased again in 2010,7 one year before the predicted periastron.
Recently, a number of observations were carried out on δ Sco coordinated with the periastron passage of the system which was anticipated at the beginning of 2011 July. This provided another opportunity to study the gaseous disk and how it responds to the increased gravitational disturbance. Possible physics behind the 2000 periastron activity is that when the effective surface gravity of the primary along the connecting line to the secondary is reduced, the rotation could become locally supercritical, releasing material into orbit (Harmanec et al. 2002). One of the goals of this paper is to test if this scenario happened again in the 2011 periastron. The data used in this paper are from an infrared and a visible interferometer. We carried out seven nights of H-band interferometry observations on δ Sco about one week after the predicted periastron to study the disk properties, and 128 nights in total of visible interferometer observations from 2000 to 2011 periastron to refine the binary orbital parameters.
The main goal of this paper is to verify if the disk grows during the secondary passage by quantifying the disk asymmetry after periastron. The gravity disturbance of the secondary due to tidal forces should make it easier for the primary to lose mass, and this extra mass might be ejected asymmetrically. Thus our observations could shed light on the Be disk formation mechanism. With excellent (u, v) plane coverage in the interferometry data, we are also able to constrain and discuss other properties of the binary system, such as inclination angles of the disk plane and orbital plane. In Section 2, we describe the data from the two interferometers. In Section 3, we focus on the binary and disk modeling of δ Sco. In Section 4, imaging results of the disk are presented for seven nights. Finally, in Section 5, we discuss the results from modeling and imaging.
2. OBSERVATIONS AND DATA REDUCTIONS
2.1. CHARA/MIRC Interferometry
The near-infrared observations of δ Sco were carried out using the Georgia State University Center for High Angular Resolution Astronomy (CHARA) interferometer array (ten Brummelaar et al. 2005). It contains six 1 m telescopes with baselines ranging from 34 m to 331 m, offering high angular resolution up to (λ/(2 × Baseline)) ∼ 0.5 mas at the H band (1.4 μm to 1.8 μm).
The Michigan Infra-Red Combiner (MIRC) at CHARA is an image-plane near-infrared combiner, designed to perform model-independent interferometric imaging (Monnier et al. 2004, 2006). Originally, MIRC was capable of combining four CHARA telescopes simultaneously, providing six visibilities, four closure phases, and four triple amplitudes. It has been upgraded at the beginning of 2011 July, just before the δ Sco observations, to a six-beam combiner to improve the (u, v) plane coverage. The upgraded MIRC is able to combine all six CHARA telescopes simultaneously, providing 15 visibilities, 20 closure phases, and 20 triple amplitudes. However, one of the CHARA telescopes has insufficient delay line range for a target as southerly as δ Sco. We ended up using five telescopes (except UT 2012 July 16), which gives 10 independent visibilities, and 10 closure phases, 6 of which are independent.
The Photometrical Channels (PCs) subsystem of MIRC are designed to measure the fluxes from individual telescopes in real time to calibrate visibilities. A prototype of PCs (Che et al. 2010) was installed in 2009. While it functioned well, the light throughput of each beam was five times lower than expected due to the lack of degrees of freedom for precise alignment. The design of PCs was modified and implemented during the same engineering run as the MIRC upgrade. The new version of PCs performs as expected and improves the signal-to-noise ratio of flux measurements (Che et al. 2012).
The enormously boosted (u, v) plane coverage and improved data quality not only allow MIRC to image more complex objects such as spotted stars but also increase the MIRC sensitivity to reach fainter objects. MIRC sensitivity was limited by the visibility calibration due to the uncertainty of the real time flux measurements of each beam. The uncertainty is reduced with the new version of PCs, which allows weaker MIRC visibilities to be well calibrated. We also re-aligned the polarization of some fibers to provide better instrumental fringe contrast.
We observed δ Sco on seven nights (Table 1) in 2011 July just after periastron with the upgraded MIRC. We used three calibrators and calculated their uniform disk sizes to be 58 Oph = 0.705 ± 0.04 mas, HD 160042 = 0.65 ± 0.05 mas, and 53 Ser = 0.45 ± 0.03 mas (Kervella & Fouqué 2008; Barnes et al. 1978; Bonneau et al. 2006). A typical (u, v) plane coverage of one night of δ Sco observation is shown in Figure 1. The data were reduced using the MIRC data pipeline (Monnier et al. 2007). In addition to the random error that is estimated in our pipeline, we must include errors associated with calibration of the changing transfer function. Based on a study of calibrators, we have adopted the following procedure. First, we apply a correction factor of 1.5 to visibilities squared and triple amplitudes. Next, we insist that the visibility squared errors are never below 0.1 × visibilities squared or. 001, whichever is lower, and that the triple amplitude errors are no less than 0.15 × triple amplitudes or. 00002. Lastly, we apply a minimum noise threshold of 1° for the closure phases.

Figure 1. (u, v) coverage of one typical night (2011 July 22) observation of δ Sco with upgraded MIRC. The observation was taken in the H filter, which is further divided into eight spectral channels.
Download figure:
Standard image High-resolution imageTable 1. MIRC/CHARA Observation Logs for δ Sco
| UT Date | Telescopes | Calibrators |
|---|---|---|
| 2011 Jul 10 | S1-S2-E2-W1-W2 | 58 Oph, HD 160042 |
| 2011 Jul 11 | S1-S2-E2-W1-W2 | 58 Oph |
| 2011 Jul 13 | S1-S2-E2-W1-W2 | 53 Ser, 58 Oph |
| 2011 Jul 16 | S1-S2-E2-W1 | 58 Oph |
| 2011 Jul 17 | S1-S2-E2-W1-W2 | 53 Ser, 58 Oph |
| 2011 Jul 20 | S1-S2-E2-W1-W2 | 58 Oph |
| 2011 Jul 22 | S1-S2-E2-W1-W2 | 58 Oph |
Download table as: ASCIITypeset image
2.2. NPOI Interferometry
The visible interferometric observations were obtained as an extension of the results presented in Tycner et al. (2011), which focused on refining the orbital parameters of the δ Sco system before the periastron passage of 2011. The data presented in Tycner et al. (2011) were acquired using the Navy Prototype Optical Interferometer, which was recently upgraded to fully operational status and is known as the NPOI. The NPOI is a six-element optical interferometer capable of simultaneously recording signal from up to 15 unique baselines at 16 spectral channels in the wavelength range 560–870 nm (Armstrong et al. 1998).
In this study we utilized all 96 nights (covering the 2000–2010 time frame) that were presented in Tycner et al. (2011), and we complemented this set with newly acquired additional observations on 32 nights in 2011, including three nights close to the periastron passage in 2011 July. The new NPOI observations have been acquired and reduced using the same procedure as described in Tycner et al. (2011) and references therein. The calibrator star ζ Oph (HR 6175, O9V) used to reduce the raw interferometric observations was the same as used previously. This allowed us to simply combine the data from the 32 nights in 2011 to the observational data set previously published in Tycner et al. (2011).
The resulting binary fits to each night of NPOI observations produced the angular separation (ρ) and the P.A. (θ) of the two stellar components. The previously unpublished 32 nights from 2011 are listed in Table 2.
Table 2. δ Sco Astrometric Measurements from NPOI in 2011
| UT Date | MJDa | Separation | P.A.b | σMajorc | σMinord | P.A. |
|---|---|---|---|---|---|---|
| (mas) | (°) | (mas) | (mas) | Error (°)e | ||
| 2011 Mar 11 | 55631.319 | 41.12 | 28.97 | 1.399 | 0.108 | 2.9 |
| 2011 Mar 13 | 55633.328 | 40.56 | 29.47 | 1.376 | 0.113 | 4.7 |
| 2011 Mar 16 | 55636.323 | 40.55 | 29.16 | 1.363 | 0.114 | 4.8 |
| 2011 Mar 28 | 55648.339 | 36.76 | 31.25 | 1.076 | 0.279 | 3.2 |
| 2011 Mar 29 | 55649.326 | 37.26 | 31.28 | 1.204 | 0.126 | 6.2 |
| 2011 Apr 2 | 55653.343 | 36.20 | 31.95 | 1.411 | 0.120 | 6.0 |
| 2011 Apr 5 | 55656.338 | 35.37 | 32.39 | 1.341 | 0.116 | 4.2 |
| 2011 Apr 12 | 55663.351 | 32.38 | 34.92 | 1.399 | 0.122 | 6.9 |
| 2011 Apr 13 | 55664.337 | 32.67 | 34.52 | 1.412 | 0.118 | 6.2 |
| 2011 Apr 15 | 55666.346 | 31.29 | 35.78 | 1.396 | 0.123 | 5.5 |
Notes. It includes the NPOI data obtained prior to 2011. aMJD = JD −2400000.5 bPosition angle of the secondary, east of north. cSemimajor axis of error ellipse. dSemiminor axis of error ellipse. ePosition angle of error ellipse, east of north.
Only a portion of this table is shown here to demonstrate its form and content. A machine-readable version of the full table is available.
Download table as: DataTypeset image
3. MODELING
3.1. Orbital Parameters from NPOI Data Only
The spectral resolution of the NPOI places the Hα emission from the disk and the continuum light from the stellar photosphere into separate channels (Tycner et al. 2003). Thus, line-free channels provide relative astrometry of the binary independent of the contribution from the disk. NPOI has observed δ Sco for more than 11 years since the 2000 periastron which provided the best available phase coverage of the binary system. Tycner et al. (2011) did a precise binary orbit fit with NPOI data before 2011 and predicted the 2011 periastron to be on July 6 ± 2 days. In this paper we include 32 more days of NPOI observations of δ Sco in 2011 from March to July, including a few nights around the predicted periastron. We fit a new orbit of δ Sco to all NPOI data. The new fit (second to the last column of Table 3) agrees well with Tycner et al. (2011) in general, as the new data are consistent with the old NPOI orbital data of δ Sco. Because the 32 new NPOI astrometric measurements are close to periastron, the orbital period and the time passage through the periastron are much better constrained. All NPOI data and the fitted orbit are shown in the left panel of Figure 2. The right panel of Figure 2 zooms in around the periastron. The new predicted periastron obtained by fitting to all NPOI data was UT 2011 July 3 12:40 ± 4:10.
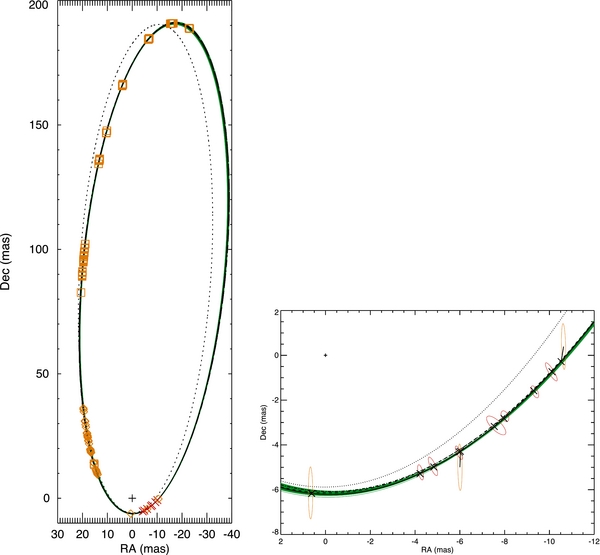
Figure 2. δ Sco secondary orbit. Left panel: the orange symbols represent NPOI data, the squares are old NPOI data from Tycner et al. (2011), the diamonds are new NPOI data measured in 2011. The red crosses are MIRC/CHARA astrometric measurements during 2011 July. The plus sign is the fixed primary. The green and black solid lines are the binary orbits from global model fitting to both NPOI and MIRC data (see Section 3.4), the black line is the best-fit orbit while the width of the green line represents the uncertainty of the orbit. The dotted line represents the orbit from Tango et al. (2009). The dashed line is orbit from Tycner et al. (2011). The dot-dashed line is the orbit from model fitting to both new and old NPOI data. Right: zoom in around the periastron of the orbit. The notations of the lines are the same as in the left panel. The orange ellipses represent the uncertainty of NPOI astrometric measurements at each epoch, while the red represent MIRC. The cross symbols are predicted secondary positions from the global model fitting at different epochs of MIRC and NPOI data.
Download figure:
Standard image High-resolution imageTable 3. The Orbital Parameters of δ Sco
| Parameters | Tango et al. (2009) | Tycner et al. (2011) | NPOI Only (New Fit) | NPOI and MIRC |
|---|---|---|---|---|
| a (mas) | 98.3 ± 1.2 | 99.1 ± 0.1 | 99.041 ± 0.030 | 98.94 ± 0.14 |
| i (deg) | 38 ± 6 | 32.9 ± 0.2 | 32.30 ± 0.30 | 34.12 ± 0.79 |
| Ω | 175.2 ± 0.6 | 172.8 ± 0.9 | 174.4 ± 0.6 | 175.0 ± 2.1 |
| e | 0.9401 ± 0.0002 | 0.9380 ± 0.0007 | 0.9387 ± 0.0005 | 0.9373 ± 0.0009 |
| ω | 1.9 ± 0.1 | 2.1 ± 1.1 | 0.2 ± 0.6 | −0.5 ± 2.5 |
| T0 (MJDa) | 51797.4 ± 0.1 | 51797.0 ± 0.5 | 55745.53 ± 0.16 | 55745.29 ± 0.19 |
| P (days) | 3922.7 ± 7.3 | 3950.8 ± 1.8 | 3947.73 ± 0.46 | 3945.4 ± 2.8 |
| Reduced χ2b | ⋅⋅⋅ | ⋅⋅⋅ | 0.51 | 2.5 |
Notes. aMJD = JD −2400000.5. bOf all NPOI data.
Download table as: ASCIITypeset image
3.2. Modeling the δ Sco Components
The modeling of δ Sco contains three components: the primary, the secondary, and the disk. Be stars are generally thought to contain a near-critically rotating star. However, most papers from literature have concluded δ Sco is not rotating close to the critical rate. One of the possible reasons is that they assumed of the primary star and the orbit, which is a reasonable approximation when the stellar inclination angle is unknown. We adopt a rapidly rotating model for the primary star. However, since the primary is not fully resolved by MIRC/CHARA and it is contaminated by the flux from the disk, the infrared interferometry data are not sufficient to constrain the primary parameters.
Therefore, we use a new way (Kraus et al. 2012b) to iterate the rapidly rotating stellar model (Aufdenberg et al. 2006) to get a set of stellar parameters that are consistent with observations from the literature. Then the stellar angular size can be estimated given the distance of 150 pc. The observations include vsin i = 157 km s−1 (Glebocki & Gnacinski 2005), V-band magnitude before 2000 periastron (no positive disk detection) Vmag = 2.31, apparent effective temperature Teff = 27,000 K (Carciofi et al. 2006; Miroshnichenko et al. 2001). We also use the H-R diagram as one more constraint to the model. The rapidly rotating stellar model contains six parameters: stellar mass, inclination angle, fractional angular velocity, polar radius, polar temperature, and gravity darkening coefficient. The last parameter is fixed to 0.19 (Che et al. 2011) for hot stars with radiative-dominated envelopes. This still leaves five free parameters but only four constraints, so we did a one-dimensional grid search of inclination angles and the resulting stellar model parameters are listed in Table 4. The detailed steps are listed below.
- 1.Fix stellar inclination angle.
- 2.Assign stellar mass of the first iteration to 15 M☉ (Tango et al. 2009).
- 3.Calculate stellar polar radius, fractional angular velocity, and polar temperature based on the vsin i, V-band magnitude, and apparent Teff measurements above using a rapidly rotating stellar model (Aufdenberg et al. 2006).
- 4.
- 5.
- 6.Compare the derived stellar mass from H-R diagram with the assumed mass in step 2. Iterate from step 2 until these two masses agree.
Table 4. Primary Stellar Parameters
| Inclination (°) | 40 | 30 | 25 | 20 | 17 |
| Mass (M☉) | 14.2 | 14.0 | 13.9 | 13.7 | 13.5 |
| Ω/Ωc | 0.66 | 0.79 | 0.87 | 0.96 | 0.997 |
| Polar radius (R☉) | 6.8 | 6.5 | 6.2 | 5.7 | 5.2 |
| Polar radius (mas) | 0.21 | 0.20 | 0.19 | 0.18 | 0.16 |
| Equatorial radius (R☉) | 7.3 | 7.3 | 7.3 | 7.4 | 7.4 |
| Equatorial radius (mas) | 0.22 | 0.22 | 0.22 | 0.23 | 0.23 |
| Polar temperature (K) | 28000 | 28000 | 29000 | 29000 | 30000 |
| Equatorial temperature (K) | 26000 | 25000 | 25000 | 23000 | 20000 |
| True luminosity (L☉) | 24000 | 22000 | 20000 | 18000 | 16000 |
| Apparent luminosity (L☉) | 25000 | 25000 | 25000 | 25000 | 26000 |
Download table as: ASCIITypeset image
Among the stellar models in Table 4, we adopt the 25° inclination angle model with Ω/Ωc = 0.87, which is the average value from Frémat et al. (2005). Actually, the difference between stellar models in Table 4 is less than 0.5% in terms of visibility, and this difference is negligible considering that the primary only contributes a small amount of H-band flux as we will see in the following sections. We further simplify the primary model with 25° inclination angle as a uniform ellipse since it is barely resolved by MIRC/CHARA. The mean diameter of the uniform ellipse from the fitted results is 0.22 mas at distance of 150 pc, and the ratio between the major and minor axes is 1.03. This leaves the flux fraction and stellar P.A. of the major axis as the only two free parameters for the primary. We should emphasize that the flux of each component we mention in this paper is the flux ratio to the total flux rather than physical units.
We adopted a simple uniform disk model for the secondary because the stellar size is too small to be resolved by MIRC/CHARA and there are no spectroscopic measurements of the secondary from the literature to constrain a rapidly rotating model as we did for the primary. Bedding (1993) measured the V-band magnitude difference between the primary and the secondary to be Δm = 1.5 ± 0.3 before the 2000 periastron. The effective temperature of the secondary is approximated with Teff = 22,000 K based on the spectral type B2V (Kenyon & Hartmann 1995). Given the primary's Teff = 27,000 K and radius = 0.22 mas, we calculated the radius of the secondary to be 0.12 mas, and the flux ratio of the binary in the H band to be 3.3:1, which is fixed in the following model fitting. The secondary has two more free parameters: its position relative to the primary.
In our model, the intensity of the disk is assumed to follow a two-dimensional Gaussian profile in the radial direction, with a hole in the center containing the central star. The disk model contains five parameters: the radius of the disk hole (Rdiskhole) and half-width at half-maximum (HWHM) of the intensity profile along the major axis, disk inclination angle (i), P.A. of the major axis (east of north), and flux fraction. The first four parameters are schematically visualized in Figure 3. The disk is assumed to be circular; the projected elliptical shape on the plane of the sky is caused by the inclination angle. Therefore, the radius of the disk hole and HWHM along the minor axis are scaled down by a factor of cos(i) compared with those along the major axis. As the inner edge of the disk is very close to the stellar surface, Rdiskhole along the major axis is fixed to the radius of the primary star along the major axis. The P.A. of the major axis of the disk is always matched to the P.A. of the major axis of the primary during the model fitting.
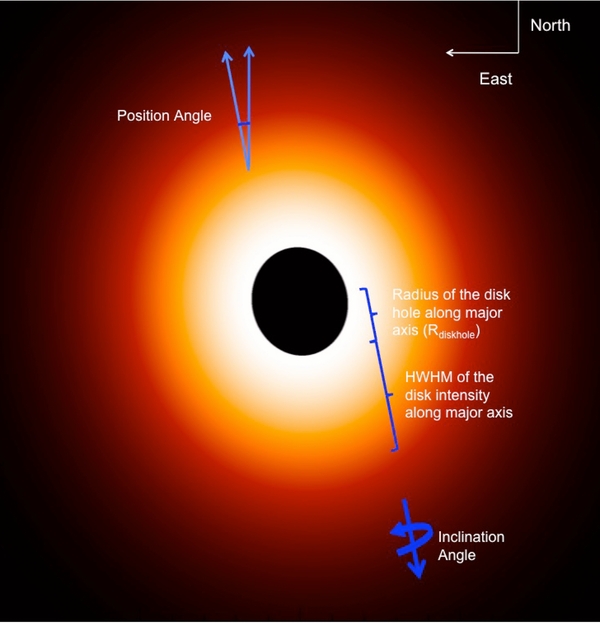
Figure 3. Two-dimensional Gaussian intensity profile of the disk model with a hole in the center. The geometry of the disk model is described by the radius of the disk hole along major axes (Rdiskhole), disk inclination angle (i), half-width at half-maximum (HWHM) of the intensity profile along major axis, and P.A. (east of north). The model disk image presented here uses the disk parameters from the global model (Section 3.4).
Download figure:
Standard image High-resolution imageThe sum of the flux fraction from the disk, primary, and secondary is a free parameter instead of fixed to the unit, because we find some large-scale envelope extended to several masses contributing a few percentage of the total flux. The envelope is so resolved that it acts as a scaling effect to the measured visibilities.
3.3. Astrometric Measurements from MIRC
We did a two-dimensional grid search of secondary position relative to the primary for each epoch of the MIRC data using a symmetric disk model for simplicity. The reduced χ2 of each pixel of the two-dimensional grid is conservatively scaled, being divided by the reduced χ2min of the grid because of the correlation between errors of data points. Then the new χ2 space is translated into likelihood space by likelihood ∼ exp (− 0.5 × χ2). The errors of the secondary position are defined by the error ellipse, which contains 68.3% of probability with minimum area. Figure 4 shows an example of the likelihood space of MIRC UT 2011 July 17 with the white solid error ellipse. The astrometric measurements from MIRC are listed in Table 5.
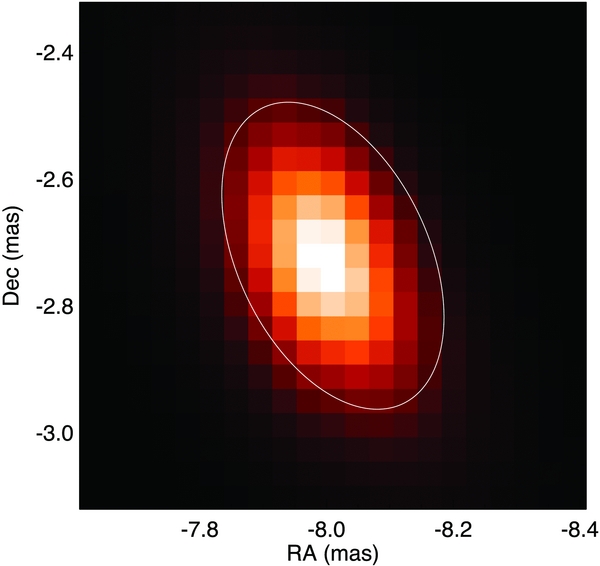
Figure 4. Likelihood space of secondary position from symmetric disk model fitting to 2011 July 17 MIRC data. The solid line is the error ellipse, which contains 68.3% of the probability.
Download figure:
Standard image High-resolution imageTable 5. δ Sco Astrometric Measurements from CHARA/MIRC
| UT Date | MJDa | Separation | P.A.b | σMajorc | σMinord | P.A. |
|---|---|---|---|---|---|---|
| (mas) | (°) | (mas) | (mas) | Error (°)e | ||
| 2011 Jul 10 | 55752.237 | 6.73 | 219 | 0.348 | 0.103 | 14.0 |
| 2011 Jul 11 | 55753.236 | 6.90 | 224 | 0.446 | 0.119 | 23.5 |
| 2011 Jul 13 | 55755.227 | 7.38 | 234 | 0.327 | 0.097 | 24.9 |
| 2011 Jul 16 | 55758.260 | 8.24 | 248 | 0.562 | 0.217 | 46.1 |
| 2011 Jul 17 | 55759.176 | 8.46 | 251 | 0.258 | 0.151 | 25.3 |
| 2011 Jul 20 | 55762.205 | 9.49 | 260 | 0.291 | 0.126 | 26.2 |
| 2011 Jul 22 | 55764.249 | 10.11 | 266 | 0.471 | 0.114 | 31.7 |
Notes. aMJD = JD −2400000.5 bPosition angle of the secondary, east of north. cSemimajor axis of error ellipse. dSemiminor axis of error ellipse. ePosition angle of error ellipse.
Download table as: ASCIITypeset image
3.4. Global Symmetric Disk Model
The disk may or may not be distorted by the gravitational force of the secondary during periastron. As a reasonable start, we assume the disk to be symmetric and fit the model to MIRC data of individual nights independently, namely the disk flux and size from different nights are not forced to be consistent. The details of each component of the model are described in Section 3.2. Table 6 lists only the disk parameter results of the model fitting. The errors of the disk parameters are estimated by bootstrapping the visibilities and closure phases from the same night based on baselines and triangles. The fact that the disk flux fraction of the total flux and the disk geometry are similar for models of different nights implies a stable inner disk during the period of MIRC observation time. The small variations may be due to the systematic error changes from night to night.
Table 6. Symmetric Disk Model from Individual Nights of MIRC Data
| UT Date | Disk Flux Fraction | ia | HWHMb | P.A.c | Reduced χ2d |
|---|---|---|---|---|---|
| (°) | (mas) | (°) | |||
| 2011 Jul 10 | 0.718 ± 0.008 | 24 ± 5 | 0.342 ± 0.015 | 27 ± 5 | 1.5 |
| 2011 Jul 11 | 0.760 ± 0.011 | 28 ± 4 | 0.366 ± 0.017 | 20 ± 3 | 1.1 |
| 2011 Jul 13 | 0.715 ± 0.010 | 31 ± 2 | 0.365 ± 0.013 | −9 ± 5 | 0.8 |
| 2011 Jul 16 | 0.749 ± 0.018 | 23 ± 2 | 0.319 ± 0.014 | 5 ± 8 | 0.8 |
| 2011 Jul 17 | 0.688 ± 0.007 | 21 ± 4 | 0.314 ± 0.014 | 11 ± 6 | 1.9 |
| 2011 Jul 20 | 0.694 ± 0.008 | 32 ± 3 | 0.363 ± 0.009 | 13 ± 5 | 1.4 |
| 2011 Jul 22 | 0.742 ± 0.005 | 38 ± 2 | 0.426 ± 0.021 | 33 ± 2 | 2.4 |
Notes. aDisk inclination angle. bHalf-width at half-maximum (HWHM) of the intensity profile along the major axis of the disk. cPosition angle of the major axis east of north. dTotal reduced χ2 of equally weighted visibility square and closure phase.
Download table as: ASCIITypeset image
In order to better control night-to-night systematic errors and to constrain the average disk properties, we construct a global model. Each component of the global model is essentially the same as described in Section 3.2. The properties of the symmetric disk are consistent through all seven MIRC/CHARA nights and the secondary positions are constrained to follow a Keplerian orbit. The global model is fit to both NPOI and MIRC data simultaneously. The model data from the fitted results and MIRC data on the same night are plotted in Figures 5–8. Table 7 lists the results of the disk, primary, and secondary parameters from the global model fitting. The fitted results of the orbit are listed in the last column of Table 3. The larger errors on the orbital parameters from the global model fitting compared with those from NPOI-data-only fitting suggest some inconsistencies between the MIRC and NPOI data due to calibration or other systematic errors. The reduced χ2 of each epoch of MIRC/CHARA data are reported in Table 8. The green solid line in Figure 2 shows the corresponding orbit, and the width of the line represents the uncertainty. Originally, the errors in Table 7 were obtained by treating data from each night as a whole package and bootstrapping the MIRC and NPOI packages separately with replacement. But this treatment does not properly take into account the astrophysical scatter of the disk properties. So to be more conservative, we use the standard deviations of the disk properties of each MIRC observation (Table 6) as the errors for the global model. From now on, all the model parameters mentioned below are from the global model fitting of both MIRC and NPOI data if not specified. Figure 9 shows the model images of the primary and its disk for the seven nights of MIRC/CHARA observation, overplotted with the predicted orbits.
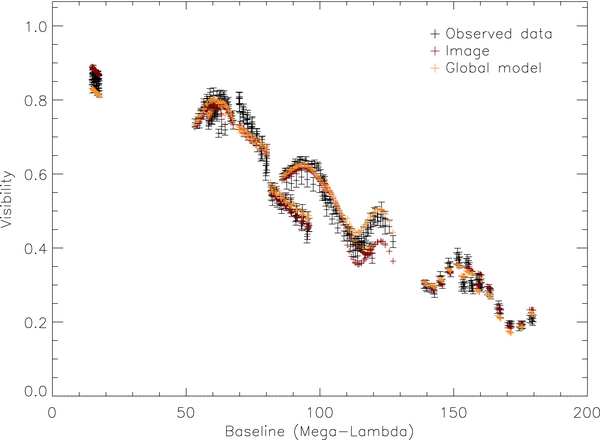
Figure 5. All visibilities of different baselines from MIRC observation on 2011 July 22 are plotted together. The observed data are in black, model data from the global model (Section 3.4) are in yellow, and the model data from imaging (Section 4) are in red. The notations are the same for the following Figures 6– 8.
Download figure:
Standard image High-resolution image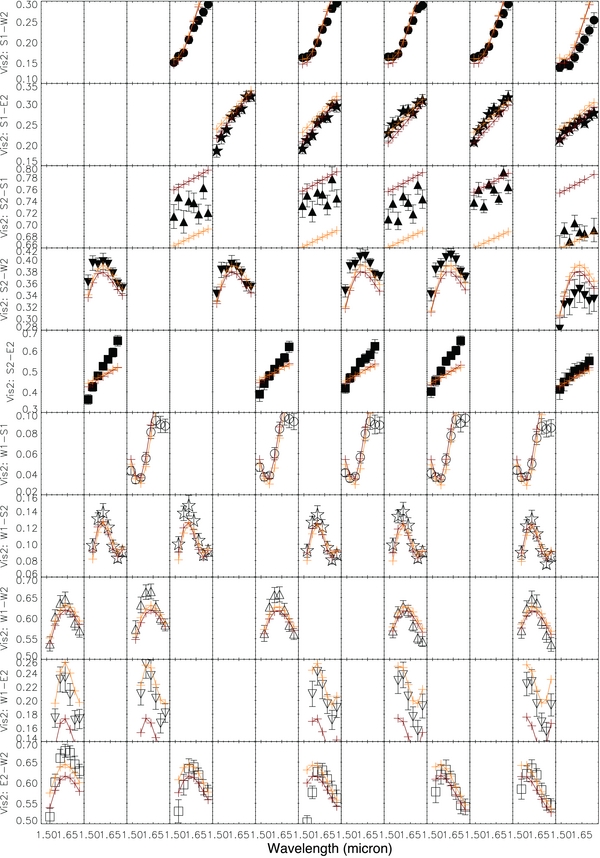
Figure 6. Visibility square of MIRC observation on July 22. See the notations in Figure 5.
Download figure:
Standard image High-resolution image
Figure 7. Closure phases of MIRC observation on July 22. See the notations in Figure 5.
Download figure:
Standard image High-resolution image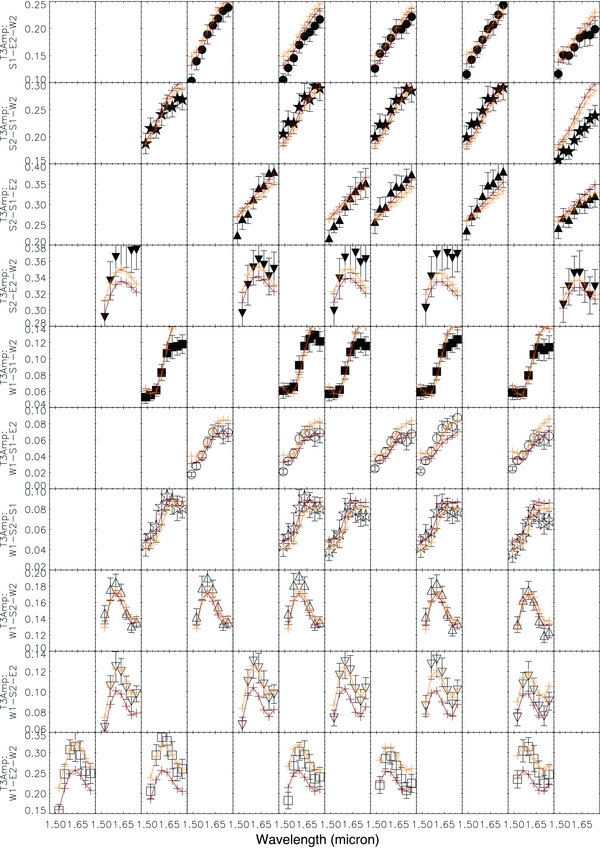
Figure 8. Triple amplitude of MIRC observation on July 22. See the notations in Figure 5.
Download figure:
Standard image High-resolution image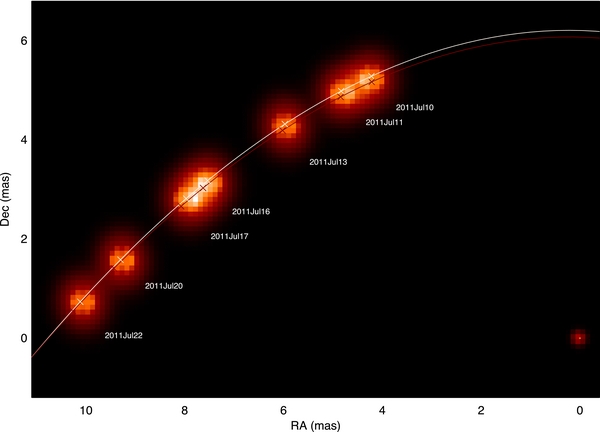
Figure 9. δ Sco images from the global model fitting of seven nights of MIRC/CHARA observations. The secondary is fixed at the origin for all seven nights, and the primary along with its disk change their positions relative to the secondary from night to night. The white solid line and crosses are the predicted orbit and primary positions on those seven nights from the global model. The red line and crosses are the orbit and positions of the primary from binary model fitting of NPOI data only.
Download figure:
Standard image High-resolution imageTable 7. Global Model Fit to Both NPOI and MIRC Dataa
| Parameters | Values from Model Fitting |
|---|---|
| Disk | |
| Flux fraction | 0.714 ± 0.027 |
| Radius of the hole along major axis (Rdiskhole, mas)b | 0.22 |
| Disk inclination angle (°) | 27.6 ± 6.0 |
| P.A. of major axis (°, east of north) | 9. ± 14. |
| HWHM of major axis (mas) | 0.341 ± 0.038 |
| Primary | |
| Flux fraction | 0.195 ± 0.019 |
| Radius along major axisb (mas) | 0.22 |
| Radius along major axisb (mas) | 0.21 |
| P.A. of major axis (°, east of north) | 9. ± 14 |
| Secondary | |
| Flux fraction | 0.060 ± 0.006 |
| Radiusb (mas) | 0.12 |
| Flux fraction in extended component | 0.032 ± 0.026 |
Notes. aThe orbital parameters of the global model are shown in Table 3, the reduced χ2 of each epoch of MIRC data are reported in Table 8. bFixed in the model.
Download table as: ASCIITypeset image
Table 8. Spotted Disk Model Fitting Results
| χ2 and Model Parameters | 10tha | 11th | 13th | 16th | 17th | 20th | 22nd | |
|---|---|---|---|---|---|---|---|---|
| Global model | Reduced χ2b | 2.61 | 2.14 | 1.63 | 2.36 | 2.46 | 2.28 | 2.38 |
| (Symmetric disk) | Reduced closure phase χ2 | 4.46 | 3.18 | 1.82 | 2.49 | 3.91 | 3.66 | 5.48 |
| Reduced visibility χ2 | 1.04 | 1.07 | 1.43 | 2.28 | 0.95 | 0.96 | 0.80 | |
| Spotted disk | Reduced χ2b | 1.03 | 1.02 | 1.03 | 1.07 | 1.47 | 0.95 | 1.87 |
| Reduced closure phase χ2 | 1.09 | 0.95 | 0.67 | 1.23 | 1.97 | 1.06 | 2.97 | |
| Reduced visibility χ2 | 0.98 | 1.08 | 1.40 | 0.98 | 0.95 | 0.85 | 0.73 | |
| Flux fraction in spot | 0.011 | 0.010 | 0.011 | 0.060 | 0.010 | 0.031 | 0.010 | |
| Spot P.A. (°) | 290 | 340 | 350 | 260 | 340 | 310 | 330 | |
| Spot distance (mas) | 0.84 | 1.49 | 1.50c | 1.42 | 1.50c | 0.73 | 1.21 | |
Notes. aThe dates are in 2011 July. bReduced χ2 is an average of that of equally weighted visibilities and closure phases. cThe spot distance to the center of the primary is limited to be smaller than 1.5 mas.
Download table as: ASCIITypeset image
We compare the parameters from the global model fitting with those from Millan-Gabet et al. (2010), which modeled δ Sco with data observed with MIRC/CHARA in 2007, and those from Le Bouquin et al. (2011) which modeled δ Sco with data observed with PIONIER/VLTI on 2011 June 4. The disk contributes 71.4% ± 2.7% of the flux in the H band in 2011, which is much higher than ∼30% flux contribution from the disk in 2007 from Millan-Gabet et al. (2010). This agrees with the visible photometry observation that Vmag in 2007 is at least 0.3 mag fainter than it is in 2011. However, the disk FWHM in the H band in 2011 is (0.34 + 0.22) × 2 ∼ 1.1 mas, which agrees with 1.18 ± 0.16 in 2007 from Millan-Gabet et al. (2010) and a little smaller than Le Bouquin et al. (2011), ∼ 1.5 mas. The relatively stable disk size in the H band may be because H-band flux only comes from the hot part of the disk, and the disk temperature beyond ∼1 mas is too low to contribute significantly to the H-band flux. According to our modeling, the flux contribution from the secondary is ∼6%, which agrees with 6.3% ± 0.5% from Le Bouquin et al. (2011). The P.A. of the disk in 2007 is 25° ± 29° (Millan-Gabet et al. 2010), which agrees with our result, 9° ± 14°. The orbital parameters are in general consistent with those from Tycner et al. (2011). The revised periastron timing from MIRC and NPOI data in 2011 of UT 2011 July 3 07:00 ± 4:30 agrees with that from NPOI data only.
The flux ratio from the large-scale envelope is found to be ∼3% (Table 7). This is not a calibration bias as we find the scaled-down visibilities from different nights of δ Sco observation using different calibrators. The possible explanation for the envelope is an extension of the circumstellar disk. MIRC only sees the H-band flux, which mostly comes from the inner part of the disk, but the real disk could be much larger as Hα emission line observations show (Meilland et al. 2011). The fully resolved envelopes in the H band are also found in other Be stars (Smith et al. 2012).
3.5. Spotted Disk Model
Although the fitting from the global model is good in general, the reduced χ2 of the closure phases of the MIRC data are much larger than unity (Table 8). The closure phases are sensitive to the asymmetry of projected images, and the large reduced χ2 indicate additional asymmetry of the system which is probably from the disk. In order to parameterize the amount of asymmetry, we simply add a bright spot to the disk to represent any asymmetry on the disk. This adds three more free parameters to the model: spot flux, spot P.A., and spot distance from the center of the primary. We fix the remaining model parameters from the global model with symmetric disk, and only let the three spot parameters be free and fit to the MIRC data of each night individually. This allows us to see how the point-like asymmetry varies from night to night, and gives us a sense of how asymmetric the disk is. The fitted results are shown in Table 8. Although the spot contributes less than 3% of the total flux in the H band with a few percent variation, the reduced χ2 of closure phases decrease by a factor of up to three (Table 8). The variations of the spot properties from night to night are discussed in Section 5.
4. IMAGING THE DISK
Imaging with interferometric data is a powerful method to characterize the intensity distribution, because it is independent of any simple physical models. Each baseline of an interferometer samples one data point on the (u, v) plane (Fourier space) of an image. Ideally, if a sufficient number of data points on the (u, v) plane are sampled, the image can be reconstructed by an inverse two-dimensional fast Fourier transform. However, in reality, because of the finiteness of (u, v) plane coverage, many different images fit well to the same interferometric data. Therefore, improving the (u, v) plane coverage is critical to interferometric imaging. The recently upgraded MIRC is able to combine up to six telescopes simultaneously to fully utilize the imaging capabilities of the CHARA array.
We employ the algorithm "Markov-Chain Imager for Optical Interferometry" (MACIM; Ireland et al. 2006) to reconstruct images of δ Sco. The algorithm has been validated by Lawson et al. (2006). Since the main goal of imaging is to detect if there is any asymmetry of the disk, we fix the primary and secondary parameters from the global model and subtract the interferometric data of the two stars to leave only image information for the disk part. We use a model image of the disk from the best global model fitting as an initial starting point for image reconstruction. The model image of the primary is later overplotted onto the disk image (Figure 10). The secondary is not shown in the image. The image grid is 40 × 40 with the pixel size of 0.1 mas.
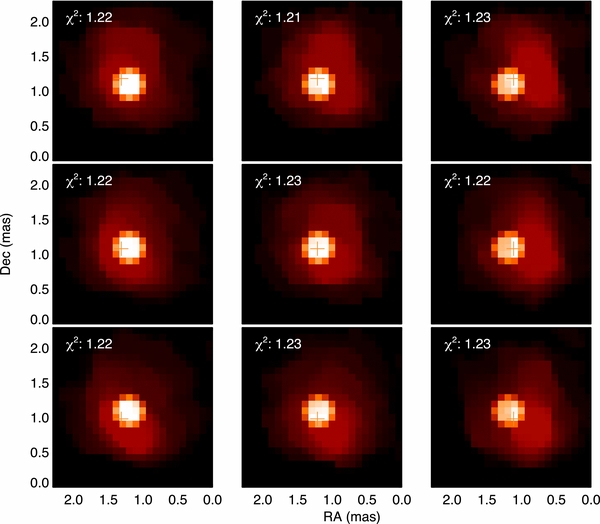
Figure 10. Central panel shows the primary plus disk image from MACIM when the properties of the secondary and the primary are fixed from the global model. The other panels show the same images when the secondary is shifted up or down and left or right with step size of 0.1 mas. The "+" sign in each panel represents a reference point from which the secondary is located 10.14 mas away with the position angle of 266°. The reduced χ2 of each image are shown in the panels. The disk images are plotted as intensity with power index of 0.7.
Download figure:
Standard image High-resolution imageInterferometry constrains the separation between the photocenters of two objects. In the case of δ Sco, one of the objects is the secondary, and the other is the primary plus the disk. Therefore, there is degeneracy between the positions of the secondary and the disk relative to the primary: one can move the disk relative to the primary to maintain the same photocenter separation as if the secondary is shifted. An example of how the positions of the secondary and the disk are related is shown in Figure 10. The central panel shows the imaging result of the primary and its disk when the secondary is fixed to the position estimated from the global model. The panels surrounding the central panel show the same images when the secondary is shifted 0.1 mas up or down and left or right corresponding to where the panel is relative to the central panel. 0.1 mas is about the uncertainty of the secondary position in the global model fitting. The primary is always fixed at the center of the images as a reference point for the disk. The plus sign in each panel is a reference point for the secondary, which is always located 10.14 mas away with P.A. of 26586 (east of north). From the figure, we find the disk always shifts a similar direction and distance as those of the secondary to keep the same photocenter separation. The reduced χ2 of all panels is all about the same. This implies for a range of secondary positions that the disk can always shift to compensate. As a result, even if the real disk is symmetric, the disk from imaging could be asymmetric if the secondary is placed at a wrong position relative to the primary star. MIRC data are not able to resolve the position of the secondary and the disk at the same time.
Therefore, we fix the separation between the primary and secondary stars estimated from the global model during the imaging process. The comparison of the reconstructed image and the MIRC data on one night is plotted in Figures 5–8. The first seven panels of Figure 11 show the images of the primary and the disk from the seven nights. The last panel shows the average image of all seven nights, and the angular resolution (λ/2 × baseline) of MIRC/CHARA at the lower right corner. The disk images vary from night to night. It is hard to distinguish if the variation reflects real disk structure or some artifact from the imaging reconstruction because the disk size is only about twice the angular resolution. We conclude that imaging the δ Sco disk is really at the limit of the imaging ability of MIRC/CHARA. The average image shows a mostly symmetric disk, with the elongation along north and south which agrees with the disk P.A. from modeling.
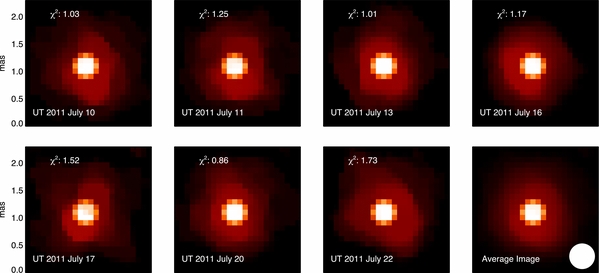
Figure 11. Disk plus primary images from seven nights of MIRC observations. The last panel shows the average images from all seven nights. The white circle in the lower right corner represents the angular resolution (∼0.5 mas) of MIRC/CHARA. The disk images are plotted as intensity with power index of 0.7 to see more details.
Download figure:
Standard image High-resolution image5. DISCUSSION
5.1. Binary Masses
The masses of the primary and the secondary can be better constrained with the revised binary orbit. The orbital period and semimajor axis from the global model are 3945.4 ± 2.8 days and 98.94 ± 0.14 mas. The parallax estimation of δ Sco revised by van Leeuwen (2007) is 6.64 ± 0.89 mas. The total mass of the primary and secondary stars derived from Kepler's law is Mtotal = 28 ± 11 M☉, the large error bar comes from the uncertainty of the parallax estimation. We also estimate the mass ratio of the primary and secondary stars based on the RV measurements from the 2000 periastron (Miroshnichenko et al. 2001). The likelihood space of the primary and secondary masses from the binary orbit and RV measurements are shown in Figure 12. The first panel shows a very broad likelihood distribution because of the large error on distance estimation. The last panel is the combined likelihood space. The contour represents a total 68.3% (1σ) of probability inside. As the primary mass is determined to be 13.9 M☉ from photometry and spectroscopic measurements in Section 3.2, the corresponding secondary mass from the combined likelihood space is ∼6 M☉.

Figure 12. Likelihood spaces of the primary and secondary masses estimated from binary orbit (first panel) and radial velocity (second panel) measurements. The last panel shows the combined likelihood from the two measurements; the contour represents total 68.3% (1σ) inside. The plus symbol in the last panel represents the binary masses derived from this work.
Download figure:
Standard image High-resolution image5.2. Inclination Angles
The inclination of the disk is 276 ± 60 from the global model fitting, which agrees with the assumed inclination angle of 25° of the primary in general. The inclination angle of the orbit is 34.12 ± 0.79 from the global model. The mutual angle between the disk plane and orbital plane is given by

where i1 and i2 are the inclination angles of the disk and orbital planes, and Ω1 and Ω2 are the ascending nodes. We have measured the ascending node of the orbit to be 1750 ± 21. The ascending node of the disk is less constrained due to two degeneracies: which side of the disk is closer to us; which direction the disk is rotating (Figure 13). Fortunately, using archival VLTI/AMBER spectrointerferometric data, we can determine the rotation sense of the disk by measuring the photocenter displacement between the blueshifted and redshifted line wing (Kraus et al. 2012b). For this purpose, we used δ Sco data (Meilland et al. 2011) recorded on UT 2010 April 19 and 20 in the He i and Brγ line using AMBER's high spectral dispersion mode of λ/Δλ = 12,000. We extract wavelength-differential phases (Figure 14, top), from which we compute the corresponding two-dimensional photocenter displacement vectors (Figure 14, bottom) using Equation (1) from Kraus et al. (2012b). The signs of the differential phases are calibrated using the method presented in Kraus et al. (2012a), which allows us unambiguously to assign the vector direction to the orientation on sky. For both the He i and Brγ line, we find that receding (redshifted) emission is offset to the northwest of the stellar continuum emission. This indicates the binary orbit and the disk are on retrograde orbits, eliminating two cases in Figure 13: cases 3 and 4. However, the P.A. of the disk from VLTI/AMBER does not agree with that from CHARA/MIRC, so we will report two sets of mutual angles. VLTI/AMBER gives a disk P.A. = 167° ± 3° for the Brγ line (Figure 14, left panel) and 158° ± 4° for the He i line (Figure 14, right panel). The average P.A. of these two measurements is 1638 ± 58. The mutual angle between disk and orbital plane is then either 1713 ± 47 or 1186 ± 60. If we use the P.A. of the disk, 9° ± 14°, from CHARA/MIRC, then the mutual angle is either 1703 ± 64 or 1188 ± 61.

Figure 13. Degeneracy of the disk orientation and rotation. The sizes of the disk and binary orbit are not scaled. The big left panel shows the binary orbit, and the small right panels show the four possibilities of the disk orientation and rotation. In each panel, the arrows represent the orientation of the rotation: clockwise or counterclockwise. Red means the disk or the secondary are rotating away from us, while blue means they are rotating toward us. Disk cases 3 and 4 are eliminated by the VLTI/AMBER data (Section 5.2).
Download figure:
Standard image High-resolution image
Figure 14. Using archival VLTI/AMBER data (2010 April 19 and 20; Meilland et al. 2011), we derive spectra (top row) and differential phases for three interferometric baselines (second row from top). From these differential phases, we compute for each spectral channel the two-dimensional photocenter displacement vector (third row from top). The data points are color coded according to their spectral channel, revealing that the receding (redshifted) part of the disk is located to the northwest of the star.
Download figure:
Standard image High-resolution image
5.3. Disk Asymmetry
Although the spotted models fit well to the interferometry data, the spot distances vary from night to night and the P.A.s of seven nights do not fit into a period. This is probably because our single-spot model is too simple to reflect the true asymmetry. The spot represents only some kind of average of the real asymmetry, therefore its behavior could appear to be complex from night to night. Also the orbital periods of the inner and outer disk are of order 0.5 to 1.5 days, respectively, assuming Keplerian rotation. Such short-period differential rotation could easily distort the asymmetry pattern and make it different every day. So the most we can get out of the spotted model fitting is that the inner part of the disk is only distorted about a few percent in terms of the H-band flux in a point-like asymmetry if there is any. This implies that the secondary passage did not trigger any strong mass outflow from the primary to the disk orbit during this periastron. Any asymmetry in the disk could be caused by some internal dynamic instability of the disk. This is supported by the photometric monitoring8 over the last few years which shows the disk started to brighten about 1 year before the 2011 periastron and stayed relatively stable during the 2011 periastron passage (∼10% flux variation in the V band). Halonen et al. (2008) also find some asymmetry in the Hα line that cannot be modeled by an axisymmetric disk in 2006 away from the periastron, supporting that the disk asymmetry is self-induced. However, this seems to contradict the 2000 periastron where many observations supported a growing disk during the periastron. Of course, the discussion of the disk in our paper is limited to the parts that emit H-band continuum flux, while we are not able to constrain the most extended disk regions (>1 mas). It is still possible that the outer part of the disk (traced by the Hα emission) is more significantly distorted as it is closer to the secondary. For instance, the disk radius measured in the Hα line is about 4.8 mas (Meilland et al. 2011). From the global model fitting, the distance between the primary and secondary at periastron is about 6.2 mas. So, the gravity force from the secondary is about 13 times stronger at the Hα disk edge than at the H-band edge.
6. CONCLUSION
δ Sco was expected to reach periastron in early 2011 July. We revised the binary orbit and studied the primary disk properties during the periastron with two interferometers: 32 nights of NPOI astrometric measurements during 2011 and 7 nights of MIRC/CHARA H-band five-telescope data about one week after the predicted periastron. We fit a global model where the secondary follows a Keplerian orbit and the disk properties are stable through all seven nights of CHARA/MIRC observation with respect to all of the data above plus another 96 nights of NPOI astrometric measurements before 2011 (Tycner et al. 2011). The revised the binary parameters agree with Tycner et al. (2011) in general and the new periastron estimation was UT 2011 July 3 07:00 ± 4:30. We also estimated the mass of the secondary, based on the revised binary orbit and RV measurements from Miroshnichenko et al. (2001), to be ∼6 M☉, with the primary mass 13.9 M☉ estimated from vsin i, apparent Teff, and V-band photometry measurements. The mutual angles between the disk mid-plane and orbital plane are estimated to be either ∼119° or ∼171° with the spectrointerferometric data from AMBER/VLTI to partially remove the degeneracy. From the fitted global model, we also find that ∼3% of the H-band flux comes from a fully resolved envelope. The primary disk was found to be mainly symmetric and stable, contributing 71.4% ± 2.7% of the total H-band flux throughout the seven nights of the CHARA/MIRC observation. This implies a quiescent inner disk and no ongoing material outflow after the periastron. But from closure phase measurements, we also found a weak asymmetry structure with less than 3% of the total H-band flux for a spot-like pattern. However, this does not rule out other complicated asymmetric patterns due to the limited angular resolution.
The Navy Precision Optical Interferometer is a joint project of the Naval Research Laboratory and the US Naval Observatory, in cooperation with Lowell Observatory, and is funded by the Office of Naval Research and the Oceanographer of the Navy. The CHARA Array is funded by the National Science Foundation through NSF grants AST-0307562, AST-0606958, AST- 0908253, and by the Georgia State University. Funding for the MIRC combiner came from the University of Michigan and observations were supported through National Science Foundation grants AST-0352723, AST-0707927, and AST-0807577. We thank the NPOI project staff for their support acquiring the NPOI data and Ashley Ames for assistance with NPOI data reduction.
Facilities: CHARA (MIRC) - Center for High Angular Resolution Astronomy interferometer, NPOI - Navy Prototype Optical Interferometer, VLTI (AMBER) - The Very Large Telescope Interferometer