


ABSTRACT
It has long been thought that intermediate-mass black holes (IMBHs) might be located in the cores of globular clusters. However, studies attempting to confirm this possibility have been inconclusive. To refine the search for these objects, Baumgardt et al. completed a series of N-body simulations to determine the observational properties that a host globular cluster should possess. Keys to revealing the presence of an IMBH were found to be the shape of the cluster's core proper motion dispersion profile and its surface density profile. Among the possible host clusters identified by Baumgardt et al., NGC 6266 was found to be the most suitable object to search. Hubble Space Telescope Wide Field Planetary Camera 2 images with an epoch difference of eight years were, therefore, used to measure this cluster's internal proper motion dispersion profile from 0.8 arcsec to 17 arcsec from the cluster center. This profile and the surface density profiles obtained by Noyola & Gebhardt and Trager et al. were then compared to those produced by N-body simulations of NGC 6266 with and without an IMBH. We find that a centrally located IMBH is not required to match these profiles, but that an IMBH with a 1σ upper limit mass of less than a few thousand M☉ cannot be excluded. To establish the existence of this object, the exact location of the density center and more precise velocity measurements within the inner 1 arcsec of this center are required. Our best-fitting model of NGC 6266 without an IMBH yields a cluster mass of M = 8.22 ± 0.17 × 10⁵ M☉, leading to a mass-to-light ratio of M/LV = 2.05 ± 0.04.
Export citation and abstract BibTeX RIS
1. INTRODUCTION
The cores of globular clusters have long been thought to be likely sites for the formation of an intermediate-mass black hole (IMBH). Over 20 years ago Peterson et al. (1989) suggested that the globular cluster M15 possessed a centrally located 1000 M☉ IMBH. This claim was supported by the study of Gebhardt et al. (1994) that used surface brightness profiles and radial velocity measurements of 144 stars located within 10 arcsec of the cluster center. Gerssen et al. (2002, 2003) subsequently probed the inner core region of M15 using Hubble Space Telescope (HST) by measuring the radial velocities of 64 stars located within 2 arcsec of the cluster center. Although the presence of an IMBH was not required to explain their measurements, they could not rule out such an object if it had a mass of 1.7–3.2 × 10³ M☉. Finally, using radial velocity measurements within 1 arcsec of the M15 core, Kiselev et al. (2008) claim that an IMBH is present with a mass between 1 and 9 × 10³ M☉.
Other globular clusters have also been suggested to possess IMBHs. Indeed, measurements of the ratios of globular cluster core sizes to their half-mass radii have been used to support the view that a significant fraction of these clusters possess an IMBH (Trenti 2006). Gebhardt et al. (2002, 2005) used radial velocity data to argue that a 20,000 M☉ IMBH is located in the center of G1, the largest globular cluster in M31. Several other investigators have suggested that a 40,000 M☉ IMBH is located in the center of ω Centauri (Noyola et al. 2008, 2010; Jalali et al. 2012). Recently, Lützgendorf et al. (2011) also found kinematic evidence for a 17 ± 9 × 10³ M☉ IMBH in the center of NGC 6388.
Theoretical models provide several different pathways for the formation of an IMBH within a globular cluster. These objects could be created by the runaway mergers of massive stars (Portegies Zwart & McMillan 2002; Portegies Zwart et al. 2004; Taniguchi et al. 2000; O'Leary et al. 2006), or the accretion of significant amounts of interstellar material onto a stellar mass black hole (Kawakatu & Umemura 2004). Indirectly, support for the existence of IMBHs is also provided by an extrapolation of the MBH–MBulge relation for supermassive black holes in galactic nuclei (Magorrian et al. 1998; Ebisuzaki et al. 2001). This extrapolation leads to the prediction of a typical black hole mass of a few thousand solar masses for globular clusters.
Despite this body of evidence, the existence of IMBHs in globular clusters is still unsettled. Illingworth & King (1977) showed that the surface brightness profile of M15 and its central velocity dispersion could be explained by a modest population of centrally located neutron stars. Dubath et al. (1994) found a much lower value of 14 km s−1 for the M15 central velocity dispersion than the 25 km s−1 reported by Peterson et al. (1989), reducing the need for an IMBH. Additional radial velocity data obtained by Dull et al. (1997) further reduced the core velocity dispersion by about 1.4 km s−1. Using multi-mass Fokker–Planck models they found that post-collapse models only required the presence of a central population of neutron stars containing about 3% of the total cluster mass. Subsequently, Baumgardt et al. (2003a) showed that numerical N-body simulations could also explain the M15 brightness profile without an IMBH. Finally, McNamara et al. (2003) measured the M15 internal proper motion dispersion profile from 0 7 to 156 of the cluster center and found that it did not require the presence of an IMBH. Baumgardt et al. (2003b) also challenged the assertion that G1 contains an IMBH. Based on an N-body simulation, they found it was not necessary to invoke the presence of an IMBH. The mass of the IMBH suspected to be present on the core of ω Centauri has also been significantly revised downward from 40,000 M☉ to a 1σ upper limit of 12,000 M☉ (Anderson & van der Marel 2010; van der Marel & Anderson 2010). Other methods for detecting IMBHs in clusters have also been suggested, like observations of the mass segregation profile of stars in clusters (e.g., Gill et al. 2008), searches for radio and X-ray emission coming from accreting IMBHs (e.g., Maccarone & Servillat 2008), or IMBH detection through tidal disruption of passing white dwarfs (Rosswog et al. 2008). However, none of these methods has so far provided conclusive evidence for the existence of IMBHs in star clusters.
In this study we use the internal proper motion dispersion profile of NGC 6266 to investigate whether this globular cluster contains an IMBH. We find that it is not necessary to invoke an IMBH to explain its proper motion dispersion and surface density profiles, but that the presence of an IMBH with a mass of less than about 2000 M☉ cannot be ruled out.
In the following text, Section 2 presents the rationale for the search for an IMBH in NGC 6266; the observational data and procedure used to measure its proper motion dispersion profile are presented in Sections 3 and 4. Sections 5 and 6 describe the method used to compute the internal proper motion dispersion profile and the N-body model simulations. Our assessment of the need for an IMBH in NGC 6266 is discussed in Section 7.
2. TARGET SELECTION: THE CHOICE OF NGC 6266
Baumgardt et al. (2005) used N-body simulations to determine the observational parameters a globular cluster should have if it contained a centrally located IMBH. They found that candidate clusters would have a central surface brightness profile with a power-law slope between −0.1 and −0.3 and a King concentration factor of about c ≈ 1.5. Noyola & Gebhardt (2006) measured these properties for 37 galactic globular clusters using the Wide Field Planetary Camera 2 (WFPC2) of the HST. Based on these values, Baumgardt et al. (2005) identified nine clusters as likely hosts for an IMBH: NGC 5286, 5694, 5824, 6093, 6266, 6388, 6397, 6541, and 6715.
Among these clusters, NGC 5824, NGC 6397, and NGC 6541 have relatively high central concentrations and were, therefore, judged not to be the best objects to search. NGC 6715 has a long half-mass relaxation time and was, therefore, given lower weight. NGC 5286, 5694, 6093, and 6388 have distances of >10 kpc making it difficult to accurately measure their core proper motion dispersion profiles. In contrast, NGC 6266 is a nearby, massive cluster whose properties fall within the range predicted for globular clusters that might possess an IMBH. It was, therefore, selected as our target object.
3. THE HST WFPC2 IMAGES
All of the images used in this study were obtained with the WFPC2 on board the HST. This instrument was in service from 1993 December to 2009 May when it was replaced by the Wide Field Camera 3. The WFPC2 consisted of four 800 × 800 pixel cameras located near the HST focal plane. The field of view of three of these cameras formed an "L" shaped pattern. Their scale was 0.1 arcsec pixel−1. The fourth camera was located at the junction of the base and upper portion of the "L," had a scale of 0.046 arcsec pixel−1, and a field of view of 34'' × 34''. It was referred to as the Planetary Camera or PC. The images used in this study were obtained with the PC. First epoch images, which have NGC 6266 roughly centered in the PC, had already been obtained in 2000 May and August. They used the F555W filter and had exposure times of 1, 30, and 140 s. The approximate visual magnitude range of the stars measured in this study is ΔV = 14–19. Second epoch NGC 6266 images were obtained using the PC, with the same filter and exposure times, in 2008 April. On the first and second short exposure images, the cluster location differed by 48 and 31 pixels in x and y, respectively. For the deeper exposures, the cluster center positions differed by 102 and 151 pixels in x and y. The images used to measure the proper motions are listed in Table 1. In addition to the above images, two blue F439W images (U5AQ1704R and U5AQ1705R) were downloaded from the HST archive. They were used along with F555W images to construct a color–magnitude diagram of our program stars.
Table 1. HST WFPC2 First and Second Epoch Images
| Data Set | Date | Exp | Data Set | Date | Exp | Data Set | Date | Exp |
|---|---|---|---|---|---|---|---|---|
| (s) | (s) | (s) | ||||||
| U67E020DR | 2000 Aug 21 | 1 | UA2V010EM | 2008 Apr 6 | 1 | UA2V010GM | 2008 Apr 6 | 30 |
| U67E020ER | 2000 Aug 21 | 1 | UA2V010CM | 2008 Apr 6 | 1 | UA2V0107M | 2008 Apr 6 | 140 |
| U5AQ1701R | 2000 May 4 | 3 | UA2V010DM | 2008 Apr 6 | 1 | UA2V0108M | 2008 Apr 6 | 140 |
| U5AQ1702R | 2000 May 4 | 30 | UA2V0101M | 2008 Apr 6 | 3 | UA2V0109M | 2008 Apr 6 | 140 |
| U5AQ1703R | 2000 May 4 | 30 | UA2V0104M | 2008 Apr 6 | 3 | UA2V010AM | 2008 Apr 6 | 140 |
| U67E0209R | 2000 Aug 21 | 140 | UA2V0102M | 2008 Apr 6 | 3 | UA2V010HM | 2008 Apr 6 | 140 |
| U67E020AR | 2000 Aug 21 | 140 | UA2V0103M | 2008 Apr 6 | 3 | UA2V010IM | 2008 Apr 6 | 140 |
| U67E020BR | 2000 Aug 21 | 140 | UA2V0105M | 2008 Apr 6 | 30 | UA2V010JM | 2008 Apr 6 | 140 |
| U67E020CR | 2000 Aug 21 | 140 | UA2V0106M | 2008 Apr 6 | 30 | UA2V010KM | 2008 Apr 6 | 140 |
| UA2V010BM | 2008 Apr 6 | 1 | UA2V010FM | 2008 Apr 6 | 30 |
Download table as: ASCIITypeset image
4. DETERMINATION OF THE PROPER MOTIONS
The NGC 6266 proper motions were determined following the procedure employed by McNamara et al. (2003) in their study of M15 which also utilized WFPC2 images. Stellar positions were measured on the HST images in the manner described by Anderson & King (1999, 2003). This procedure analyzes images with small offsets to measure the under-sampled HST/PC point-spread function. The accuracy of the derived positions was assessed by comparing positions from images obtained at the same epoch. The internal agreement between these x and y values was about ±0.02 pixels for unblended, well-exposed stars, but this precision declines for bright and faint stars.
The goal of this study was to measure the cluster's internal proper motion dispersion profile. Therefore, target stars were chosen based on their potential to yield high-quality proper motions. To be included in this study a star had to meet the following criteria: (1) the counts in its central pixel had to exceed the local background level by at least a factor of 10, (2) its four brightest pixels had to exceed a preset minimum value, (3) its total count had to exceed a minimum value, (4) none of its pixels could be saturated, and (5) it could not be located within 4 pixels of an image defect or a neighbor that had a pixel count greater than 33% of the target star's central pixel count. This last criterion was especially restrictive in the crowded field of NGC 6266. Changing this criterion by 1 pixel altered the sample size by about 40%. An additional important factor that affected the sample size was the different location of the cluster on the first and second epoch images. However, these offsets did not affect the inner core profile where the influence of the IMBH would be the strongest. Taken together, the above criteria greatly limit the number of target stars. However, since the eight-year internal motion within NGC 6266 is expected to amount to only 0.06 pixels, only high-quality motions were desired. The dense stellar background within this cluster makes it difficult to precisely measure the positions of faint stars.
Image distortions were removed using higher order terms in the proper motion solutions rather than a distortion map. The usual terms for zero point, scale, and orientation were included as well as quadratic terms in x and y, an xy cross term, and a radially dependent magnitude term. Cluster stars served as reference objects. The orientation of the reference frame is that of HST image UA2V0108M. This choice has no bearing on the conclusions of this study. The same general least-squares routine as employed by McNamara et al. (2003) was employed in this investigation.
Proper motions were derived for 886 stars. Figure 1 shows their vector point diagram. A few field stars or poorly measured objects are evident, but the vast majority of stars are cluster members. A color–magnitude diagram of these stars based on HST archive F555W and F439W images of NGC 6266 is shown in Figure 2. To be used in the internal motion analysis a star's motion was required to have been measured on at least three image sets. Four hundred and sixty-six stars met this criterion, 45 of which were located within about 3 arcsec of the cluster center. Stars meeting these criteria are shown as filled circles in Figure 2. Having at least three independent measurements helped ensure that the proper motion had been accurately measured. Histograms of these proper motions are shown in Figure 3. Gaussian distributions provide satisfactory fits. The measured dispersions are σx = 0.051 ± 0.001 arcsec per century and σy = 0.048 ± 0.001 arcsec per century. Table 2 provides a list of these proper motions. From left to right the columns provide: a sequential target number, the number of image sets on which the star's motion was measured, the position of the star on HST image UA2V0108M, an instrumental visual magnitude and B − V color, and the proper motion and its error in units of arcseconds per century in x and y, respectively. The position of the cluster on these images and their different limiting magnitude did not allow the colors of all the program stars to be measured.
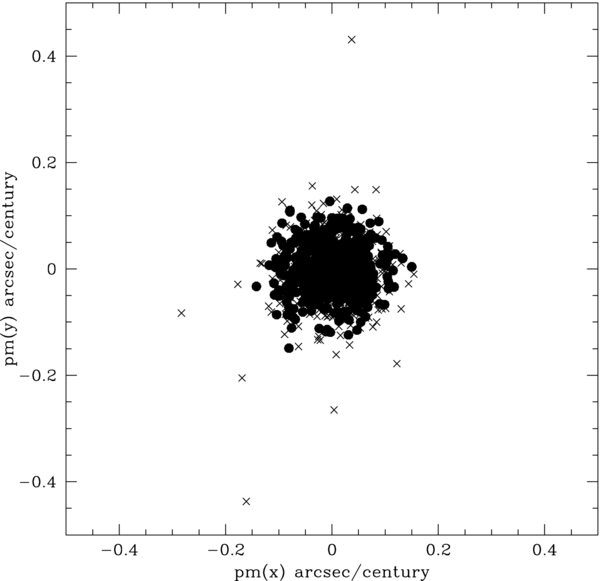
Figure 1. Plot of the relative proper motions of all 886 stars measured for this study. The x- and y-axes have units of arcseconds per century. The cluster concentration at zero motion is evident. Filled circles correspond to stars whose motions were measured on at least three image sets, crosses correspond to motions measured on one or two image sets. To avoid the complication this latter group poses to the internal motion analysis all stars were required to be measured on at least three image sets.
Download figure:
Standard image High-resolution image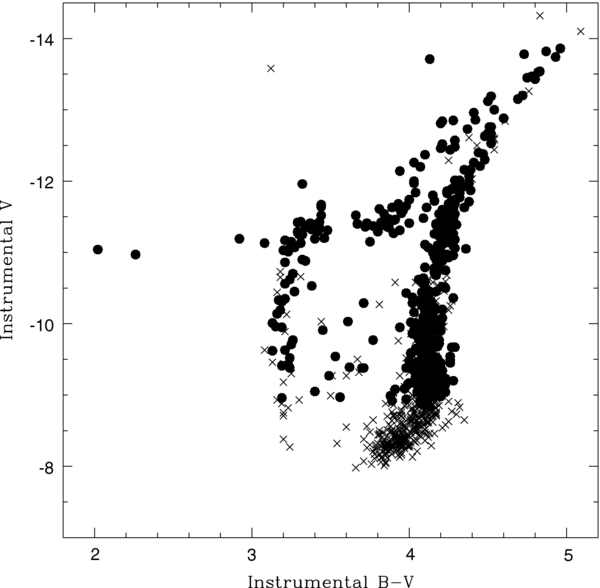
Figure 2. Instrumental color–magnitude diagram of NGC 6266 based on archive HST F814W and F555W images. Solid circles show all 466 NGC 6266 stars used to compute the internal proper motion profile. Stars that were measured on fewer than three image sets are shown as crosses and were not used to compute the profile. The sharp boundary between these two groups at faint magnitudes reflects our desire to target high signal-to-noise stars.
Download figure:
Standard image High-resolution image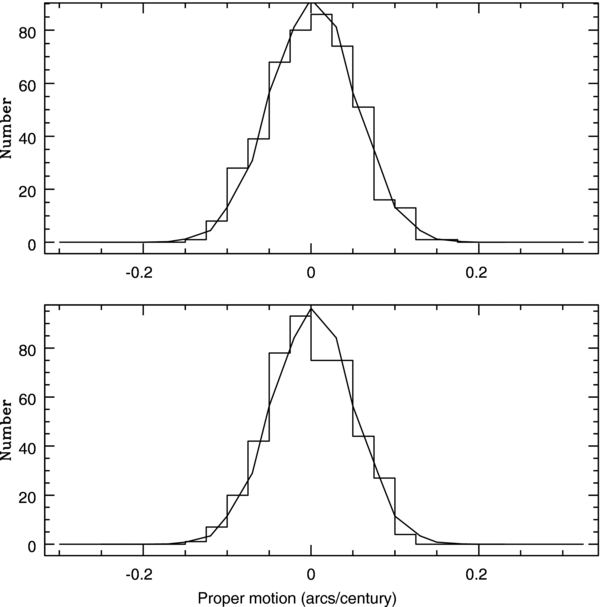
Figure 3. Proper motion histograms of the 466 stars used in this study and Gaussian fits to their distributions. The horizontal axis units are arcseconds per century. The dispersions in x and y, respectively, were 0.051 and 0.048 arcsec per century. The average motions of the sample in x and y were −0.002 and 0.000 arcsec per century, respectively.
Download figure:
Standard image High-resolution imageTable 2. NGC 6266 Proper Motion Data
| Number | Image Sets | x | y | Inst V | Inst B − V | μx | Error | μy | Error |
|---|---|---|---|---|---|---|---|---|---|
| (pixels) | (pixels) | ||||||||
| 1 | 3 | 63.73 | 493.08 | −11.62 | 4.28 | 0.014 | 0.007 | 0.085 | 0.002 |
| 2 | 5 | 70.65 | 406.58 | −11.04 | 3.23 | 0.002 | 0.035 | −0.012 | 0.040 |
| 3 | 6 | 72.76 | 252.16 | −9.23 | 4.07 | 0.001 | 0.010 | 0.053 | 0.010 |
| 4 | 6 | 73.96 | 275.53 | −8.88 | 4.07 | −0.004 | 0.011 | −0.008 | 0.023 |
| 5 | 3 | 74.76 | 147.16 | −10.90 | 4.17 | −0.095 | 0.007 | 0.017 | 0.005 |
| 6 | 3 | 78.24 | 123.32 | −11.30 | 4.23 | 0.048 | 0.009 | −0.001 | 0.006 |
| 7 | 3 | 81.74 | 665.63 | −11.06 | 4.29 | −0.005 | 0.009 | 0.033 | 0.008 |
| 8 | 3 | 88.37 | 648.60 | −11.09 | 4.28 | −0.055 | 0.012 | −0.003 | 0.011 |
| 9 | 6 | 95.39 | 379.64 | −9.78 | 4.15 | 0.043 | 0.013 | 0.032 | 0.006 |
| 10 | 3 | 96.79 | 188.33 | −12.01 | 4.32 | 0.005 | 0.003 | −0.016 | 0.004 |
Download table as: ASCIITypeset image
5. COMPUTATION OF THE INTERNAL PROPER MOTION DISPERSION PROFILE
The internal proper motion dispersion profile was computed using the procedure described by Jones (1970), Meylan & Mayor (1991), and McNamara et al. (2003). For each radial bin the observed proper motion dispersion in one coordinate, σo is
where μk is the proper motion of star k and n is the number of stars in the sample. The mean proper motion of the sample is assumed to be zero. The internal proper motion dispersion is then given by the equation
where ζk is the standard deviation of the kth star's proper motion. The error in σi was computed as σi(1/2N)1/2 (Pryor & Meylan 1993; Meylan & Mayor 1991; Trumpler & Weaver 1953). The proper motion dispersion profile was computed using equally spaced radial bins except for the last bin which extended out to the limit of the HST image. The adopted spacing was largely dictated by the number of stars in the inner bin sample. Our desire was to have the first bin contain ⩾8 stars so that the error in the rms dispersion would be small enough to provide meaningful information. A bin size of 1.5 arcsec was found to satisfy this need. To test the sensitivity of the measured profile to the adopted cluster center the profile was computed using the center positions determined by Djorgovski & Meylan (1993), Harris (1996), Beccari et al. (2006), and Noyola & Gebhardt (2006). These locations were within about 40 pixels of each other on a PC image. A fifth profile was computed using the average of these four locations. The resultant profiles are shown in Figure 4. In general, they have the same flat shape indicating that the computed profile is relatively insensitive to the assumed core location. The profile based on the Harris cluster center shows an upturn in the inner core region, but its 1σ error bar is consistent with a flat profile. In our subsequent analysis, the profile based on the cluster center determined by Noyola & Gebhardt (2006) is used. This profile, computed using a slightly smaller bin size of 1.2 arcsec, is provided in Table 3. Profiles were also computed using stellar proper motions determined from at least two and four image sets. They were very similar to those shown in Figure 4 even though the number of stars in a bin could differ by more than a factor of two.
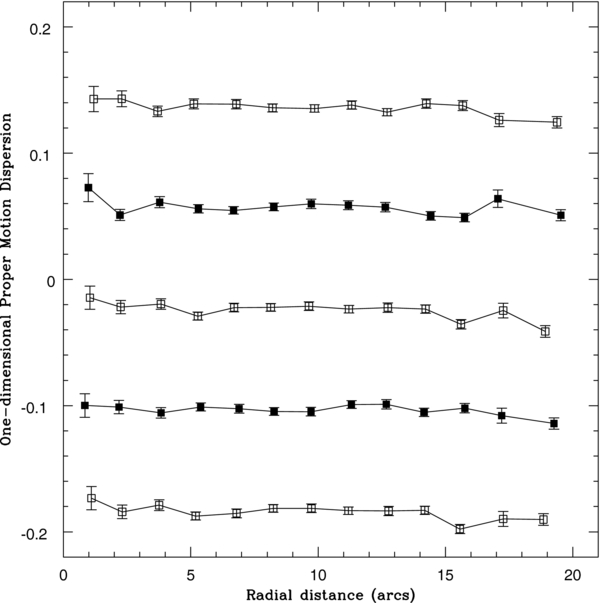
Figure 4. From top to bottom the internal proper motion dispersion profile for NGC 6266 based on the cluster center found in Djorgovski & Meylan (1993), Harris (1996), Beccari et al. (2006), and Noyola & Gebhardt (2006). The bottom profile is based on an average of the above center locations. The x-axis measures distance from the assumed cluster center in arcseconds. The y-axis provides the internal proper motion dispersion in arcseconds per century, offset from each other for clarity. The proper motion dispersion profile is essentially flat between 0.7 arcsec and 18 arcsec from the cluster center.
Download figure:
Standard image High-resolution imageTable 3. NGC 6266 Dispersion Profile Using the Noyola & Gebhardt (2006) Cluster Center
| Mean r | Number | σx | Error x | σy | Error y | σ | Error |
|---|---|---|---|---|---|---|---|
| 0.77 | 8 | 0.060 | 0.015 | 0.048 | 0.012 | 0.053 | 0.009 |
| 1.88 | 18 | 0.050 | 0.008 | 0.045 | 0.008 | 0.047 | 0.006 |
| 3.09 | 19 | 0.035 | 0.006 | 0.054 | 0.009 | 0.041 | 0.005 |
| 4.12 | 32 | 0.046 | 0.006 | 0.044 | 0.006 | 0.045 | 0.004 |
| 5.48 | 42 | 0.054 | 0.006 | 0.048 | 0.005 | 0.050 | 0.004 |
| 6.76 | 32 | 0.044 | 0.006 | 0.054 | 0.007 | 0.048 | 0.004 |
| 7.83 | 47 | 0.047 | 0.005 | 0.047 | 0.005 | 0.047 | 0.003 |
| 8.97 | 52 | 0.049 | 0.005 | 0.040 | 0.004 | 0.044 | 0.003 |
| 10.13 | 34 | 0.047 | 0.006 | 0.046 | 0.006 | 0.046 | 0.004 |
| 11.41 | 38 | 0.054 | 0.006 | 0.049 | 0.006 | 0.051 | 0.004 |
| 12.59 | 36 | 0.055 | 0.006 | 0.048 | 0.006 | 0.051 | 0.004 |
| 13.83 | 30 | 0.049 | 0.006 | 0.046 | 0.006 | 0.047 | 0.004 |
| 16.91 | 78 | 0.046 | 0.004 | 0.041 | 0.003 | 0.043 | 0.002 |
Download table as: ASCIITypeset image
6. N-BODY MODELING
To test whether NGC 6266 contains an IMBH N-body simulations were constructed. All simulations were made with the Graphical Processing Unit (GPU)-enabled version of the collisional N-body code NBODY6 (Aarseth 1999) on the GPU cluster of the University of Queensland. The simulations started from King (1962) models with varying initial central concentrations c, half-mass radii rh, and IMBH masses. Stellar evolution was modeled according to the stellar evolution routines of Hurley et al. (2000) and using a metallicity of [Fe/H] = −1.18 as given by Harris (1996). All simulations started with N = 50,000 stars distributed according to a Kroupa (2001) mass function in the mass range 0.1 < m/M☉ < 100. The time period covered by the simulations was T = 12 Gyr. Ten snapshots spaced by 50 Myr intervals between 11.0 and 11.5 Gyr were overlaid and compared with NGC 6266.
The surface density profile was determined from the luminosities and positions of all stars in the combined snapshot file, excluding only the brightest giants. The velocity dispersion was determined from all stars with apparent V magnitudes in the range 14 < V <18.5 at the distance of NGC 6266, similar to the magnitude range of stars for which proper motions were measured. To decrease the statistical noise of the N-body data, the infinite projection method of Mashchenko & Sills (2005) was used when calculating the surface brightness and velocity dispersion profiles.
Since direct N-body simulations with the number of stars typical for globular clusters (roughly 2 × 10⁶ in the case of NGC 6266) are currently not possible, smaller clusters were simulated and then scaled to NGC 6266. To perform the scaling, we determined the projected half-light radius for the combined data set of the different snapshots and scaled the model cluster down in radius such that its projected half-light radius was equal to the half-light radius of NGC 6266 as given by Harris (1996), rhp = 0 92. This corresponds to 1.82 pc at the distance of NGC 6266. Simultaneously, the mass of the simulated cluster was increased such that the relaxation time remains unchanged and the velocities of the stars were increased correspondingly. A similar method has been used by Baumgardt et al. (2003b) to model G1 and by Jalali et al. (2012) to model ω Cen and we refer the reader to these papers for a more complete discussion of scaling. To determine the best-fitting model for NGC 6266, a grid of simulations was constructed by varying the concentration parameter c of the King model, the initial half-mass radius RHi of the cluster, and the mass of the central IMBH. Five different values for c = 0.5, 1.0, 1.5, 2.0, 2.5 and five different values for RHi = 2.0, 3.0, 5.0, 7.0, 10.0 pc were used with either no IMBH or an IMBH with either 1% or 2% of the cluster mass at the end of the simulations. For each of the 75 grid points we made three simulations starting from different random number seeds and averaged the results. In order to increase the number of models which we can compare to NGC 6266, we also interpolated linearly between the grid points.
We determined the velocity dispersion and surface brightness profile of each cluster after scaling together with their uncertainties using the infinite projection method of Mashchenko & Sills (2005). The surface brightness profile was determined from all stars still bound to the cluster. Stars were weighted by their luminosities excluding only very bright stars with L > 10 L☉. The velocity dispersion was determined from those stars which fall into the same luminosity range as the observed stars. We then used a χ2 test to find the best-fitting cluster model, taking into account observational errors as well as model uncertainties. For the χ2 test we used the surface brightness profile as determined by Noyola & Gebhardt (2006) and the velocity dispersion profile for the Noyola & Gebhardt cluster center as determined in this work. Since the surface brightness profile from Noyola & Gebhardt only extends out to 100'', the profile given by Trager et al. (1995) was used to increase the radial coverage to 300''.
Figure 5 shows the χ2 maps for the best-fitting models without an IMBH. Shown are χ2 maps for the surface density, the velocity dispersion, and a χ2 map for the combined fit. Good-fitting models for the velocity dispersion alone lie in a relatively small region going from RHi = 6 pc for clusters starting from low-concentration models to RHi = 2 pc for high-concentration ones. This is due to the dynamical evolution of the clusters and the scaling in half-mass radius which we apply to them at the end of the runs. In order to match the velocity dispersion of NGC 6266, the unscaled half-mass radii of our model clusters have to be around 12 pc at T = 12 Gyr. Since core-collapse times decrease with the initial concentration of a cluster, and since clusters expand after core collapse due to heating by binary stars, extended low-concentration clusters and dense high-concentration clusters lead to the best fit of the velocity dispersion. Best-fitting clusters for the surface density follow a different distribution and come mainly from models starting with RHi = 4.5 pc, so that the best-fitting models for the combined data set come from a relatively small region in half-mass radius versus concentration space.
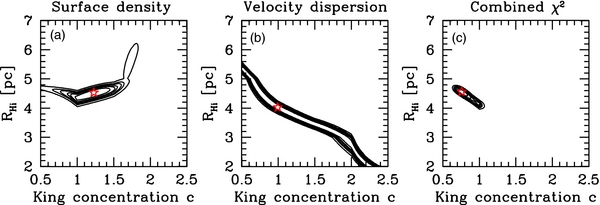
Figure 5. χ2 maps for (a) surface density, (b) velocity dispersion, and (c) the combined map for clusters without IMBHs. The asterisk marks the best-fitting model in each of the panels and the contour lines indicate lines of constant Δχ2 corresponding to 1σ to 5σ. The best-fitting model for the combined data set starts from an initial half-mass radius of RHi = 4.56 pc with an initial central concentration of c = 0.76.
Download figure:
Standard image High-resolution imageOur best-fitting model for the combined fit of velocity dispersion and surface density profile has an initial King concentration c = 0.76 and an initial half-mass radius of RHi = 4.56 pc with a χ2 value of 41.2. The reduced χ2 value of this model is 0.70, indicating a good fit to the surface density and velocity dispersion profile.
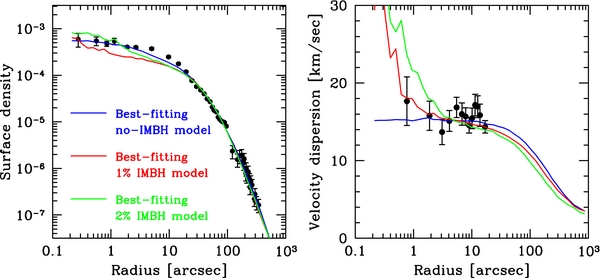
Figure 6 depicts the fit to the observed velocity and surface density profile of the best-fitting no-IMBH model. The surface density profile of NGC 6266 is well fitted by the no-IMBH model except for radii around 10'' where the model is slightly below the observations. The no-IMBH model also fits the outermost regions quite well despite being isolated, indicating that NGC 6266 is not strongly effected by the Galactic tidal field. Figure 6(b) shows that the observed velocity dispersion is essentially flat and that the cluster model without an IMBH provides a good fit to this profile. From our best-fitting model of NGC 6266 without an IMBH we derive a cluster mass of M = 8.22 ± 0.17 × 10⁵ M☉, leading to a mass-to-light ratio of M/LV = 2.05 ± 0.04. The derived cluster mass is about 25% higher than what a Jeans analysis of surface density and velocity dispersion profile would give (approximately 6.5 × 10⁵ M☉). This is due to mass segregation, which causes massive main-sequence stars to be centrally concentrated, giving them a smaller than average velocity dispersion. Comparison of our M/LV value with the theoretical values shown in Figure 7 of Mieske et al. (2008) shows that the M/LV value derived here is in good agreement with that expected for 10–12 Gyr old stellar populations following standard, Kroupa (2001) or Chabrier (2003) initial mass functions (IMFs). Our runs without an IMBH finally indicate that NGC 6266 is on its way to core collapse, but has not yet reached this state.
Figure 6. Fits of the best-fitting models without an IMBH and with IMBHs containing 1% and 2% of the cluster mass to the velocity dispersion and surface density profile of NGC 6266. The best-fitting model with IMBHs has density cusps in the center and fits the surface density data less well than the no-IMBH model. They also provide worse fits to the velocity dispersion profile due to their central rises in velocity dispersion as a result of the IMBH.
Download figure:
Standard image High-resolution image
lf we make a simultaneous search in a three-dimensional (3D) grid with King concentration c, half-mass radius RHi, and IMBH mass on the axes, we find that the best fit for a model with an IMBH is the same as for the no-IMBH case, i.e., the model starting with c = 0.76 and an initial half-mass radius of RHi = 4.56 pc and no IMBH fits better than any model with an IMBH. The reason for the worse fit of the IMBH models is shown in Figure 6. Models with IMBHs are significantly below the observed surface density profile at radii of a few arcsec. They also provide a less good fit to the velocity dispersion profile since the measured velocity dispersion profile is essentially flat in the center while the IMBH models predict a central rise. This is especially a problem for models with more massive IMBHs.
We note that the best-fitting IMBH models have weak cusps in the central surface density. The central slope measured by Noyola & Gebhardt (2006) for NGC 6266 is −0.11 ± 0.08. This value is near the lower limit of the slope that N-body simulations predict would be produced by the presence of an IMBH (Noyola & Baumgardt 2011; Vesperini & Trenti 2010). It is also close to the slope for ω Centauri where a similar search was only able to place a 1σ upper limit on a possible IMBH of 12,000 M☉ (van der Marel & Anderson 2010). Both of these results are consistent with the analysis of Noyola & Baumgardt (2011).
The data for NGC 6266, therefore, do not require an IMBH, although we cannot rule out the possibility that a small-mass IMBH might be present in the core of NGC 6266 either. The formal 1σ upper limit to this mass is about 400 M☉ if the Noyola & Gebhardt center is used. This corresponds to MIMBH/MC < 0.048%. To test the sensitivity of this result to the assumed cluster center, models were fitted to all of the profiles shown in Figure 4. The total cluster mass and, therefore, the M/L ratio were found to be essentially unchanged: the M/L value changed by only 0.03, an amount similar to the error found using the Noyola & Gebhardt based profile. The reason for this is that most of the information for the cluster mass comes from large radii where the profile does not change significantly if the center is shifted by a small amount. However, the profile computed using the center determined by Beccari et al. (2006) has an upturn in the central region. If this profile is used, the best-fitting model has an IMBH mass of 4000 M☉. This result highlights an important point. Limits on the IMBH mass are very sensitive to the shape of the dispersion profile near the cluster center and this shape can vary depending on the adopted location of the center. In our analysis we have adopted the cluster center determined by Noyola & Gebardt, but this position may not be correct. The presence of an IMBH with a few thousand solar masses in the center of NGC 6266 can therefore not be excluded with the current data.
7. SUMMARY
We have measured the internal proper motion profile of the core region of NGC 6266 and compared it to state-of-the-art N-body simulations of this cluster with and without a centrally located IMBH. From our best-fitting model of NGC 6266 without an IMBH we derive a cluster mass of MC = 8.22 ± 0.17 × 10⁵ M☉. The implied mass-to-light ratio of NGC 6266 is M/LV = 2.05 ± 0.04, which is compatible with predictions of stellar evolution models using standard (e.g., Kroupa 2001) mass functions. We find that it is not necessary to invoke the presence of an IMBH to explain the measured proper motion dispersion profile. When coupled with the cluster's surface brightness profiles measured by Noyola & Gebhardt (2006) and Trager et al. (1995), the 1σ limit on the IMBH mass is about 400 M☉. Most other density centers also have no-IMBH models as best-fitting models; however the velocity dispersion profile obtained when using the Beccari et al. (2006) density center leads to a best-fitting model with an IMBH mass of 4000 M☉. IMBHs of a few thousand solar masses are therefore compatible with the present data. The IMBH mass limit found in this study, MIMBH/MC <0.5%, is consistent with that estimated from studies of other globular clusters. For instance, at the 1σ level, van der Marel & Anderson (2010) and Miocchi (2010) found that the allowed mass of an IMBH in ω Centauri was MIMBH/MC = 0.48% and 0.58%, respectively. To better constrain the presence of an IMBH in NGC 6266 a more precise central position along with a proper motion dispersion profile that extends to within a fraction of an arcsecond of this location are needed. It is not clear that this latter goal will be possible within the foreseeable future since multiple epoch images with a resolution greater than that of WFPC2 will be required.
This work was supported by NASA grant HST-GO-11111.01. H.B. also acknowledges support from the Australian Research Council through Future Fellowship grant FT0991052.