


ABSTRACT
Experimental results from infrared spectroscopy and mass spectrometry provide compelling evidence that UV irradiation of the neutral polycyclic aromatic hydrocarbon (PAH) 9,10–dihydroanthracene (DHA), trapped in solid argon (12 K), results in efficient (i.e., 90% yield) conversion to anthracene and molecular hydrogen. A number of dissociation pathways involving single or double hydrogen loss are investigated computationally. Among these, two mechanisms are most credible for a one-photon dissociation process involving UV photons <5.5 eV. For the lowest-energy pathway (2.3 eV), a simultaneous lengthening of the C–H bonds of H9 and H10 gives rise to an anthracene–H2 complex. A higher-energy mechanism (3.4 eV) involves an initial lengthening of the H9 C–H bond, followed by this hydrogen "grabbing" H10, and forming H2. The high yield of this photolysis reaction suggests that similar reactions may take place for other neutral PAHs, with implications for the formation of molecular hydrogen in regions of low UV exposure, such as in dark clouds.
Export citation and abstract BibTeX RIS
1. INTRODUCTION
The hypothesis that polycyclic aromatic hydrocarbons (PAHs) exist in the interstellar medium (ISM) was originally formulated by Léger & Puget (1984) and Allamandola et al. (1985, 1989) to account for the presence of infrared emission bands at 3.3, 6.2, 7.8, 8.6, and 11.3 μm. These bands were detected from the brightest infrared objects by Gillett et al. (1973), Russell et al. (1977), and Willner et al. (1977). Later astronomical observations confirmed these bands from many other sources, including reflection and planetary nebulae, H ii regions, post-asymptotic giant branch objects, some regions of the Milky Way, and other galaxies (Verstraete et al. 1996, 2001; Moutou et al. 1999; Joblin et al. 2000; Genzel et al. 1998; Henning et al. 1998; Boulanger et al. 1998; Mattila et al. 1996, 1999; Peeters et al. 2002; Tielens 2005, 2008). Laboratory experiments lent credence to the proposition that PAHs in the ISM are present in a wide range of sizes, geometries, and states of hydrogenation and ionization, as reviewed recently by Tielens (2008) and Oomens (2011).
Due to the sensitivity of mass spectrometric techniques, a number of studies have aimed at elucidating the photofragmentation chemistry of PAH cations, as summarized in a recent review by Oomens (2011). Conversely, research related to the fragmentation of neutral PAHs has been much more limited (Salama et al. 1995; Bernstein et al. 1996; Kaiser et al. 2000; Kim & Saykally 2002; Malloci et al. 2004; Shen et al. 2004; Bernstein et al. 2005; Rauls & Hornekær 2008). In dark interstellar clouds, neutral PAHs (in the gas phase, on grains, or in their icy cold mantles at 10–50 K) could survive, in contrast to photodissociation regions and H ii regions where gas-phase large PAH cations are expected to be dominant. The interiors of dark clouds and nebulae with high particle densities (103–106 cm−3) are shielded from high-energy particles and energetic ultraviolet photons. The UV radiation flux drops from 108 photons cm−2 s−1 in diffuse, translucent clouds to 103 photons cm−2 s−1 in dense (dark) nebular clouds (Kaiser 2002). The very weak nebular photon flux originates not from stars, but rather from the emission of electronically excited molecular hydrogen produced in inelastic collisions with secondary electrons. By partially penetrating dense clouds, the energetic cosmic-ray particles generate those electrons via ionization (Gredel et al. 1987). In such low-flux UV radiation conditions in dark interstellar clouds, neutral PAHs are expected to outnumber cationic PAHs. Moreover, PAH cations are converted to neutrals in recombination reactions with slow electrons. The importance of neutral PAHs for overall interstellar chemistry in dark clouds was pointed out in work on the neutral hydrogenated PAHs (Rauls & Hornekær 2008).
The predominant view has long been that interstellar H2 is formed by H atom combination on small dust grains. Lately, however, several new proposals have been made in which PAHs are thought to act as catalytic centers for the formation of H2. In one model, proposed by Cassam-Chenai et al. (1994) and Pauzat and Ellinger (2001), and independently formulated by Bauschlicher (1998) and Hirama et al. (2004), a gas-phase hydrogen atom is first captured by a PAH cation forming an aliphatic group. This hydrogen is then abstracted by a second incoming H atom, forming H2. The first H addition reaction was computed to be exothermic and the second abstraction reaction to possess a zero or very small activation barrier, enabling the overall reaction to occur at low temperatures. In an alternate model, Le Page et al (2009) suggested that after trapping of an H atom on the periphery of a PAH, H2 can be released through dissociative recombination of the hydrogenated ion with an electron.
In this work, the formation of H2 is demonstrated for UV–visible photon irradiation of a neutral PAH, 9,10-dihydroanthracene (DHA). This reaction is observed while trapping DHA in solid argon at 9–12 K, similar to temperature conditions at the surface of interstellar dust grains or ices. The rates and mechanistic details of this process will be presented hereafter. Note that an analogous reaction pathway had recently been suggested for generation of molecular hydrogen from protonated DHA in the gas phase (Vala et al. 2011).
2. METHODS
2.1. Infrared Experiments
Traditional cryogenic matrix isolation techniques were applied for trapping of DHA gas-phase molecules into solid Ar at 9–12K, deposited on an infrared transparent CsI cryostat window (Szczepanski et al. 1993; Espinoza et al. 2010). DHA purity of 97%+, anthracene purity of 99.9%+, both from Sigma-Aldrich, were used as supplied and Ar gas purity was 99.999%. After deposition of the DHA/Ar mixture, the matrix was subjected to 4–35 hr of irradiation time, using UV–visible photons from a 100 W medium pressure Hg lamp with energies of E ⩽ 5.5 eV and estimated spectral irradiance of 4.4 × 10¹⁴ photons cm−2 nm−1 s−1 at 253.6 nm (at the matrix surface). Several long-wavelength pass filters (Veb Jena) were employed to establish the photon energy threshold for observing photofragment reactions in the DHA/Ar matrix. Infrared absorption spectra of the DHA/Ar matrix prior to and after photolysis were acquired using a Fourier transform infrared (FT-IR) absorption spectrometer (Magna 560 by NICOLET; and averaging of 1000 scans at 1 cm−1 resolution).
A residual gas analyzer (RGA, by Extorr, Inc.) was connected to the cryostat vacuum chamber pumped by a 1100 l s−1 (for N2) turbo molecular pump (by Osaka) to monitor the increase in partial pressure of H2 during matrix annealing (up to 35 K). In this experiment the photon-induced reaction product H2, which was stored in the photolyzed matrix during several hours of UV–visible irradiation, was extracted from the matrix upon annealing. While the background partial pressure of H2 was 4 × 10⁻¹⁰ Torr, the additional H2 partial pressure due to release from the matrix was found to be 2–5 × 10⁻¹⁰ Torr in the 16–34 K temperature range of the matrix.
2.2. Modeling of Dissociation Pathways
Molecular equilibrium geometries and their associated vibrational harmonic mode frequencies for DHA and its fragments were calculated using density functional theory with the Gaussian 09 program package (Frisch et al. 2009). Becke's three-parameter hybrid functional, the non-local correction functional of Lee, Yang, and Parr (B3LYP), with a 6–31 G basis set and d and p polarization functions on heavy and hydrogen atoms, respectively, were employed. The harmonic vibrational frequencies in the mid-IR range were scaled by a factor of 0.9614 and for CH stretching modes by 0.955 to correct for anharmonicity effects and functional/basis set deficiencies (Jolibois et al. 2005).
In the potential energy surface (PES) calculation for single hydrogen ejection, all degrees of freedom were optimized except for the R(CH) bond length, which was increased stepwise. Electronic energies were not zero-point energy (ZPE)-corrected in this case. For the H2 ejection reactions, transition states (TSs) connecting the stable minima on the PESs were sought by applying the QST3 optimization procedure in Gaussian 09 (Frisch et al. 2009) at the B3LYP/6–31G(d,p) functional/basis level. The harmonic vibrational frequencies were calculated for each structure involved in the PES calculation in order to verify whether a first-order TS was present. Electronic energies for each structure (including the TS) of lowest-energy fragmentation reaction pathway were recalculated at the G3//B3LYP level (Frisch et al. 2009; Baboul et al. 1999) in order to improve the accuracy of the calculation (Curtiss et al. 1998). The G3 energy calculation protocol was modified in such a way that the geometries and ZPEs were applied from B3LYP/6–31G(d,p), rather than the geometries from second-order perturbation theory MP2(FULL)/6–31G(d) and zero-point energies from Hartree–Fock theory of HF/6–31G(d) (Baboul et al. 1999). Note that ZPE corrections for G3//B3LYP/6–31G(d,p) were scaled (as required by the G3 protocol) by the 0.9614 scaling factor adopted from the work of Jolibois et al. (2005),while energies at the B3LYP/6–31G(d,p) level were ZPE-corrected without scaling.
3. RESULTS
3.1. Identification of Infrared DHA Photofragment Bands
The mid-IR range of the vibrational absorption spectra of neutral DHA, isolated in an Ar matrix at 12 K, are displayed in Figure 1. The green spectrum was recorded before photolysis, while the blue and red spectra were scanned after 4 and 21 hr of irradiation with a UV–visible lamp, respectively. Clearly, in the blue and red spectra several new bands are apparent. The top spectrum represents the infrared absorption spectrum for anthracene trapped in an argon matrix, which was recorded in a separate experiment. A comparison to the top spectrum gives compelling evidence that many of the photo-induced IR bands are due to anthracene. The bands at 878.3, 883.5 (shoulder), 1001.1, 1317.9, and 1450.4 cm−1, which are not overlapped with DHA bands, are marked by vertical dashed lines. The anthracene bands that overlap with existing DHA bands are indicated by open circles. The 725.8, 727.6, and 729.2 cm−1 bands partially overlap with a low-energy shoulder of the 731 cm−1 DHA band, but can be clearly distinguished (not shown for the sake of clarity). While the general agreement of the photofragment bands with the anthracene bands is credible in terms of position and intensity, there are a number of weaker photofragment bands that are left unassigned, such as 853.9 and 870.1 cm−1 (marked by dots). So far, no candidate structures have been found to rationalize these bands, including photofragments associated with DHA ring opening reactions. We note that for the latter bands, the rate of appearance is markedly different to that of anthracene. In contrast to the anthracene bands, they grew fast in the initial 4 hr of photolysis, but did not increase further during the next 17 hr of irradiation (see Figure 1). One possibility is that the unknown carrier of those two bands is a photoproduct from an impurity in the sample (∼3%, as disclosed by the supplier).
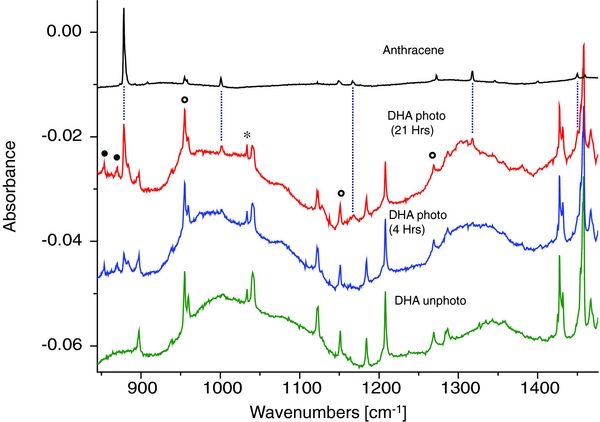
Figure 1. Experimental infrared absorption spectra of neutral DHA trapped in solid Ar at 12 K (green), after irradiation with UV–visible photons from a 100 W Hg lamp for 4 hr (blue) and 21 hr (red). The infrared absorption spectrum of anthracene isolated in solid Ar (recorded in a separate experiment) is shown in black. The dashed lines indicate spectral bands unambiguously assigned to anthracene, while the open circles denote anthracene bands that overlap with DHA bands. The methanol band is designated by a star. Unassigned bands are denoted by closed circles.
Download figure:
Standard image High-resolution imageControl photolysis experiments employing a long-wavelength pass filter showed that no photofragments were observed for photon energies of E ⩽ 4.13 eV. In comparison, the lowest-energy electronic transition for DHA is located at 4.61 eV or 37219 ± 1 cm−1, as reported from gas-phase jet experiments (Chakraborty & Chowdhury 1990). Time-dependent density functional theory calculations of vertical electronic transitions at the B3LYP/6–311++G(d,p) level suggest a dense manifold of such states, where the first state is predicted at E(S1) = 4.595 eV and the four excited states S1–S4 are distributed over merely 0.48 eV energy, and having oscillator strengths of 0.0027, 0.0235, 0.0200, and 0.0087, respectively. This suggests that in these DHA photolysis experiments, with photon energies of E ⩽ 5.5 eV, several electronic excited states of DHA are likely accessible. Since the fluorescence in DHA is very weak (Chakraborty & Chowdhury 1990) the excitation energy can be deactivated in part by internal conversion to highly excited vibrational states of the electronic ground state S0. Highly vibrationally excited molecules can fragment, provided that the dissociation rate is sufficiently high compared to the cooling rate in the matrix. Another possibility is that one (or more) electronic excited state(s) is a predissociation state leading to H2 abstraction. The PESs of ground-state fragmentation pathways will be discussed in detail below Section 3.4.
3.2. Estimation of Photofragment Column Density
The column density of anthracene photoproducts after 21 hr UV photolysis (Figure 1) can be estimated as follows. A matrix thickness of l = 80 μm after 1 hr deposition was estimated from an interference method (Szczepanski et al. 1993). The Ar column density in an l = 80 μm matrix was approximated at N(Ar) = 3.52 × 10⁻⁵ mol cm−2, based on a density of 1.77 g cm−3 for solid Ar at 5 K (Dobbs & Jones 1957). The column density of DHA molecules for the unphotolyzed DHA/Ar matrix (Figure 1, green trace) was estimated from the formula

where A is the calculated integral intensity IR band value, τ is the spectral absorbance of the experimental band, and ν is the frequency of the same band (Hudgins et al. 1994; Roser & Allamandola 2010). Using the well isolated 1208 cm−1 band in this DHA spectrum, for which the experimental integral absorbance is 2.38 × 10⁻² cm−1 and the calculated integral intensity is 15.9 km mol−1 (at B3LYP/6–311++G(d,p) level), the column density of DHA molecules in this matrix is approximated at N(DHA) = 1.46 × 10⁻⁸ mol cm−2. This equates to a ratio of N(Ar)/N(DHA) = 2.4 × 10³, insuring a reasonable isolation of DHA molecules in the Ar matrix.
Applying Equation (1) for the photoproduct anthracene doublet band at 878.3 and 883.5 cm−1 for the photolyzed matrix at 21 hr (Figure 1, red trace), the column density of the anthracene photoproduct is calculated as N(anthracene) = 5.2 × 10⁻⁹ mol cm−2. Note that this result is based on an experimental total integral intensity of 3.41 × 10⁻² cm−1 and a theoretical integral intensity of 66 km mol−1 (B3LYP/6–311++G(d,p)). In contrast, the depletion in column density of DHA during 21 hr of irradiation is estimated at 5.8 × 10⁻⁹ mol cm−2, based on ∼40% decrease. As the DHA depletion is larger by ∼10% than the column density of the anthracene photoproduct (i.e., 5.2 × 10⁻⁹ mol cm−2), this suggests that 90% of depleted DHA molecules are photo-converted into anthracene. This is also consistent with additional minor photofragments that cannot be elucidated at this time (see unassigned bands in Figure 1).
An extrapolation of these laboratory photolysis results to astrochemical conditions in dark clouds suggests that the corresponding timescale for 40% photodepletion of DHA would be ∼770 million years, based on an estimated photon flux of 103 photons cm−2 s−1 compared to the mercury lamp experiments (i.e., 21 hr at 4.4 × 10¹⁴ photons cm−2 s−1).
3.3. Tracking of Molecular Hydrogen Photofragments by Mass Spectrometry
The infrared absorption measurements above confirmed that the major photoproduct of DHA is anthracene, which suggests a concomitant loss of molecular hydrogen, H2. In order to confirm formation of molecular hydrogen in the photolysis experiment, a residual gas analyzer (RGA) was used to monitor the partial pressure of H2 (m/z 2) upon annealing the matrix. The basic premise of this experiment rests on the assumption that photo-generated H2 can be stored in the matrix for hours, prior to being released upon heating the matrix and being detected by the RGA.
Figure 2 shows the RGA H2 partial pressures as a function of matrix temperature for photolyzed DHA/Ar and a control experiment of photolyzed Ar matrix. Since molecular hydrogen was present in the vacuum chamber at a background partial pressure of 4 × 10⁻¹⁰ Torr, this was not a background-free experiment, requiring care in establishing the same conditions for both experiments. To eliminate the production of H2 molecules in pyrolysis of DHA on hot tungsten filaments, the vacuum gauges and RGA were off during DHA deposition into solid Ar (2 hr) and during photolysis (3 hr).
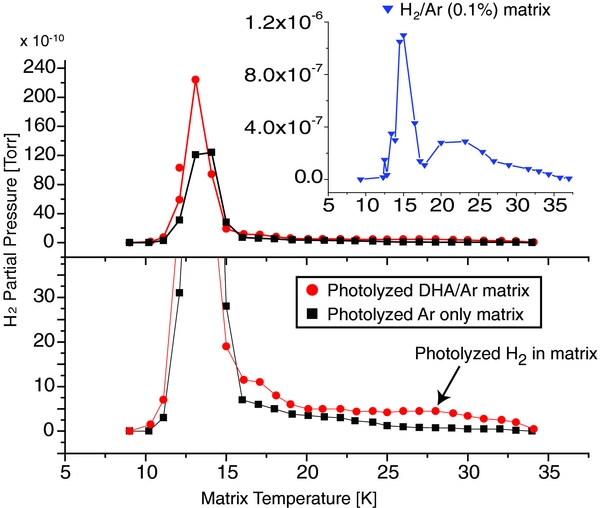
Figure 2. Molecular hydrogen partial pressure recorded by an RGA due to H2 released from solid Ar (black) and from a DHA/Ar matrix (red), both photolyzed for 3 hr with UV–visible photons (hν < 5.5 eV) from a medium pressure Hg lamp. The bottom plot shows a zoom-in of the experimental data shown in the top plot. The inset shows the corresponding molecular hydrogen partial pressure plot for a control experiment, where a mixture of H2/Ar (0.1%) was deposited in the absence of UV–visible irradiation. Note that the H2 constant background pressure of 4 × 10⁻¹⁰ Torr was subtracted in all plots, and that all other experimental conditions for both background and DHA/Ar experiments were kept identical.
Download figure:
Standard image High-resolution imageThe experimental results in Figure 2 show a large pressure increase in the range 9–16 K with a maximum centered at T = 13 K, and a second, much smaller peak in the 20–34 K range (bottom). The inset (blue plot) shows the corresponding data for another control experiment, where H2 was introduced into the vacuum chamber as an H2/Ar mixture (0.1%) to form a solid film of H2 and Ar. In this control experiment, the bimodal nature of H2 evaporation can be seen much more clearly. The onset temperatures for the two peaks correlate with the melting point of H2 at 14 K and its boiling point at ∼20 K. The lower temperature peak at 13 K could thus be interpreted as the process of releasing H2 to the vacuum chamber from the surface of the matrix and its cryostat window holder during melting of H2, whereas the second broader peak from 20 to 34 K is likely ascribed to the slower process of leaking H2 imbedded in the solid Ar matrix by diffusion (Szczepanski et al. 1992). Crucially, the second peak is only observed in the case of the DHA/Ar matrix (red), and not in the Ar-only control experiment (black). The increased H2 partial pressure for DHA/Ar is thus consistent with the formation of molecular hydrogen during photolysis, even if the background level of H2 complicates analysis.
3.4. PES Dissociation Pathways
Experimental X-ray crystallography found that the electronic ground state of DHA is non-planar with a folding angle of 145° along the C9–C10 axis (Ferrier & Iball 1954). The corresponding calculated equilibrium geometry at the B3LYP/6–31G(d,p) level indicates that DHA will adopt a C2v symmetry with a folding angle of 142.9°. On the other hand, use of a larger basis set of 6–311++G(d,p) predicted a folding angle of 141.9° for the same point symmetry group. All of the PESs presented here were calculated first using the B3LYP/6–31G(d,p) level.
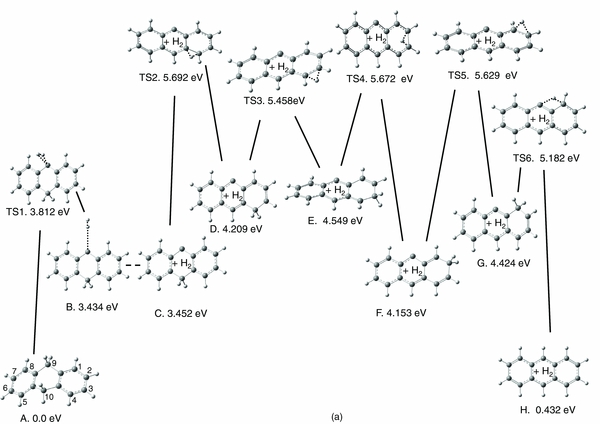
PES pathways for reactions of molecular hydrogen removal were explored for two significantly different cases. In the first case, both H's are supplied from the C9 (or equivalent C10) sp3 carbon (shown in Figure 3(a)), while in the second case, one H is supplied by C9 and another from the C10 carbon (displayed in Figure 3(b)). Figure 3(a) indicates that during scissoring vibrations at 1484 cm−1 (unscaled, B3LYP/6–311++G(d,p); see Figure 4 for this normal mode) with large motion amplitude, the two H atoms on C9 sp3 carbon would interact to form a stable complex between H2 and the anthracene-like structure B. To form this complex, DHA needs to overcome an energy barrier of 3.812 eV, as is indicated by the predicted transition state TS1, which connects precursor DHA (structure A) and the complex B. Structure B is a weakly bound complex, with a binding energy of merely 0.03 eV compared to the dissociated structure C. Due to the very flat nature of the PES for H2 removal, attempts to locate a TS between B and C were unsuccessful, and this fact is indicated by a dashed line in Figure 3(a).
Download figure:
Standard image High-resolution image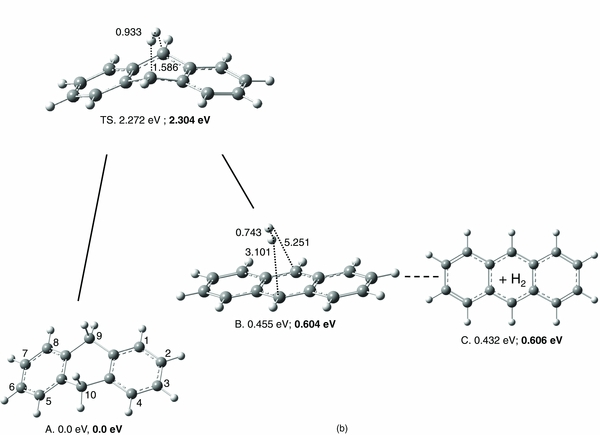
Figure 3. Singlet potential energy surfaces for H2 formation reactions (at B3LYP/6-31G(d,p)), involving (a) sp3 carbon H's H9 and H9', or (b) sp3 carbon H's H9 and H10. In plot (b), the electronic energies for the stable structures and transition state at the G3//B3LYP/6–31G(d,p) level are shown in bold.
Download figure:
Standard image High-resolution image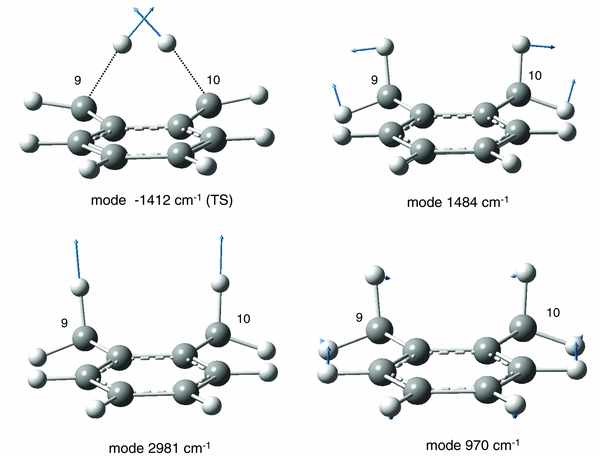
Figure 4. Side view of DHA molecule showing displacement vectors for vibrational modes. Note that the second aromatic ring is not visible due to the folding angle of DHA around its central axis. Imaginary frequency for the transition state (TS) in Figure 3(b) at −1412 cm−1. Normal mode frequency at 1484 cm−1 leading to approach of H9 and H9', in analogy to H2 ejection mechanism in Figure 3(a). Normal mode frequencies at 970 and 2981 cm−1 leading to approach of H9 and H10, in analogy to H2 ejection mechanism in Figure 3(b).
Download figure:
Standard image High-resolution imageStructure C exhibits a "naked" C9 carbon, which is a highly reactive moiety. Structure C was not confirmed in the infrared absorption experiment, and may thus interconvert to another structure. If structure C has enough excess excitation energy available, the migration of one H from a CH aliphatic group around one of two external rings is possible. The PES of hydrogen migration from a C10 hydrogen, ultimately resulting in anthracene (structure H) and dissociated H2 is shown in the remainder of Figure 3(a). For each step of the H "walk" around the ring, the energy barrier was calculated, as indicated by the TS2–TS6 transition states with relative energies versus the electronic energy of DHA. The highest barrier (TS2 = 5.692 eV) exceeds the photon energy of the mercury lamp. This suggests that the whole pathway would require absorption of multiple UV photons in a sequential way, thus representing an improbable route to generating abundant anthracene and H2.
As a side note, the C–G molecular systems in Figure 3(a) exhibit one "naked carbon", which is analogous to recently reported results for the singly dehydrogenated naphthalene cation (Galue & Oomens 2011). Their IR vibrational spectra pointed out the triplet state multiplicity for the electronic ground state of the cation. This is also the case for structures C–G and their connecting transition states of TS3 and TS4 in Figure 3(a), as summarized in Table 1. Note that this is not reflected in the PES in Figure 3(a), which shows the PES for the singlet state throughout.
Table 1. Comparison of Singlet and Triplet Lowest Electronic Energies (in hartrees) and Their Differences (in eV) Calculated at the B3LYP/6–31G(d,p) Level for the Stable and Transition State Structures of PES of H9 and H9' Loss having "Naked Carbon" as Displayed in Figure 3(a)
| Structure | E (Singlet)a | E (Triplet)a | ΔES–T |
|---|---|---|---|
| (eV)b | |||
| C | −539.241 017 | −539.245 165 | −0.113 |
| D | −539.213 194 | −539.233 388 | −0.549 |
| E | −539.200 712 | −539.224 397 | −0.644 |
| F | −539.215 248 | −539.227 461 | −0.332 |
| G | −539.205 313 | −539.232 277 | −0.734 |
| TS2 | −539.158 665 | −539.157 504 | 0.032 |
| TS3 | −539.167 299 | −539.168 288 | −0.027 |
| TS4 | −539.159 447 | −539.168 294 | −0.241 |
| TS5 | −539.173 261 | −539.168 933 | 0.118 |
| TS6 | −539.177 434 | −539.146 096 | 0.853 |
Notes. aEnergies are ZPE corrected. bNegative values indicate that the triplet electronic state is the lowest-energy state.
Download table as: ASCIITypeset image
Figure 3(b) shows the PES of ejecting H9 and H10 from DHA in the form of molecular hydrogen. In contrast to the extended pathway in Figure 3(a), a single transition state, TS, connects precursor A and the anthracene–H2 complex, structure B. Moreover, the low energetic barrier of this process of only 2.272 eV, or 2.304 eV when applying the G3//B3LYP/6–31G(d,p) level, makes this a highly credible mechanism for a one-photon photolysis reaction. The electronic energy of the dissociated products, structure C + H2, is barely higher (i.e., 0.002 eV at G3), suggesting facile separation of the fragments. In Figure 4, the displacement vectors for the imaginary frequency of −1412 cm−1 in the TS of Figure 3(b) are shown. It is interesting to note that a combination of two normal mode frequencies, 970 and 2981 cm−1, yields similar displacement vectors to the reactive coordinate of this dissociation pathway. Moreover, the displacement vectors of the scissoring mode at 1484 cm−1 rationalize an interaction of H9 and H9', in analogy with the H2 loss mechanism in Figure 3(a).
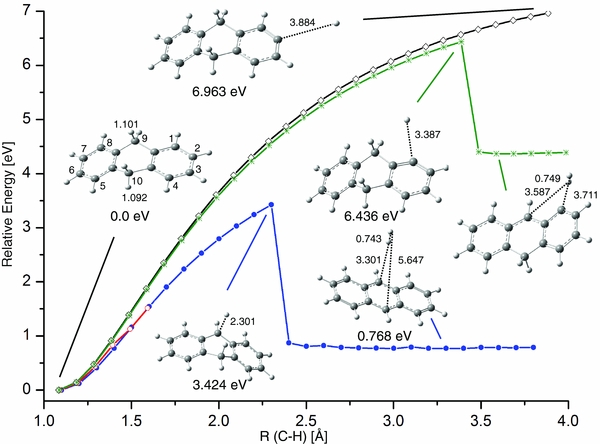
Due to the symmetry of DHA, the PES pathways for a single H removal for four chemically distinct sites of DHA are considered in Figure 5. In two cases, H9 and H9' (or equivalently C10 and C10'), H's are bonded to an sp3 carbon. In the third and fourth cases, H1 and H2 are bound to sp2 carbons. For each step of the PES, the respective C–H bond length was increased by 0.1 Å, optimizing all other degrees of freedom of the molecule. For H9 (blue) and H9' (red), their PESs converge after five steps. This happens because at step 5 the DHA skeleton flips along the C9–C10 axis during optimization, resulting in a ring inversion to convert H9' into H9. The relative energy keeps on increasing upon stretching the C–H bond further until ∼2.3 Å, when a dramatic drop in energy of 2.65 eV is observed. This correlates with H9 "grabbing" H10 to form a stable, but weakly bound complex between molecular H2 and anthracene. The energy barrier for H2 removal in this reaction is estimated at 3.424 eV, which is compatible with a one-photon absorption process.
Figure 5. Singlet potential energy surfaces (PESs) calculated for abstraction of one hydrogen for H9 (blue), H9' (red), H1 (green), and H2 (black). For each point of the PES the C–H bond was stretched by 0.1 Å and all remaining degrees of freedom of DHA were fully optimized at the B3LYP/6–31 G(d,p) level. Note that the H9' (red) and the H9 (blue) pathways converge at step 5, due to a flipping of the DHA skeleton along the C9–C10 axis, resulting in interconversion of H9' to H9. Note also that the blue/red and green reaction pathways all lead to H2 abstraction.
Download figure:
Standard image High-resolution image
In hydrogen removal reactions from sp2 carbons, the barriers are significantly higher (>6 eV), and thus beyond the energy available from a single photon in this experiment. For the removal of H1 (green), a similar drop in energy is predicted due to H1 "grabbing" the neighboring H9 to form H2. Conversely, the removal of H2 is predicted to proceed via a barrierless reaction, requiring more than 6.9 eV energy.
4. CONCLUSIONS
In summary, infrared absorption spectra confirm that UV-photon irradiation of the PAH DHA, trapped as a neutral molecule in solid argon (12 K), results in abundant conversion to anthracene. The concurrent formation of molecular hydrogen, H2, is independently indicated, based on an increase in the partial pressure of H2 as measured by a residual gas analyzer. This is corroborated by modeling of the PESs of double and single hydrogen loss. The lowest-energy reaction channel of ∼2.3 eV (at G3//B3LYP/6–31G(d,p)) involves a concerted loss of H2, supplying one H from the sp3 C9 carbon and another from the sp3 C10 carbon. The PES of single H9 hydrogen removal showed that at higher internal energies (3.4 eV, during C–H bond stretch), the H9 interacts strongly with the H10 carbon and starts to form H2. Both of these reactions are congruent with photon energies of <5.5 eV produced from the mercury lamp in this experiment. It is not clear which of these mechanisms is most favored for DHA. Nonetheless, it is likely that the lowest-energy pathway is more particular to DHA, whereas the H "grabbing" mechanism is more widely applicable in other PAHs with aliphatic CH2 groups.
It is generally accepted now that PAHs represent the single largest source of accessible carbon available in the early solar system with estimated ∼2%–5% and 10%–20% of all ISM carbon supplied by small and large PAHs, respectively. Therefore, by implication, they constitute a reservoir for cosmic hydrogen as well, and likely have important contributions to the high value of H2 column densities observed. The present results on neutral DHA support this assumption, in addition to previously reported reactions for H2 loss from protonated PAHs (Vala et al. 2009, 2011; Szczepanski et al. 2011; Dopfer 2011).
Photolysis reactions on neutral PAHs are likely most important in dark molecular clouds or interstellar ices, where exposure to weak UV radiation or interstellar rays is prevalent. The H2 products could be partially released into the gas phase from hotter parts of the ice surface in desorption processes similar to that proposed for other interstellar ice-trapped molecules (Schutte & Greenberg 1991; Shen et al. 2004).
The UF HPC Center is acknowledged for providing computational resources and support. N.P. thanks the University of Florida for generous start-up funds. We would like to acknowledge the American Chemical Society Petroleum Research Funds (ACS PRF #49572-DNI6) for financial support on this project.