


ABSTRACT
The formation and evolution of a circumstellar disk in magnetized cloud cores are investigated from a prestellar core stage until ∼104 yr after protostar formation. In the circumstellar disk, fragmentation first occurs due to gravitational instability in a magnetically inactive region, and substellar-mass objects appear. The substellar-mass objects lose their orbital angular momenta by gravitational interaction with the massive circumstellar disk and finally fall onto the protostar. After this fall, the circumstellar disk increases its mass by mass accretion and again induces fragmentation. The formation and falling of substellar-mass objects are repeated in the circumstellar disk until the end of the main accretion phase. In this process, the mass of the fragments remains small, because the circumstellar disk loses its mass by fragmentation and subsequent falling of fragments before it becomes very massive. In addition, when fragments orbit near the protostar, they disturb the inner disk region and promote mass accretion onto the protostar. The orbital motion of substellar-mass objects clearly synchronizes with the time variation of the accretion luminosity of the protostar. Moreover, as the objects fall, the protostar shows a strong brightening for a short duration. The intermittent protostellar outflows are also driven by the circumstellar disk whose magnetic field lines are highly tangled owing to the orbital motion of fragments. The time-variable protostellar luminosity and intermittent outflows may be a clue for detecting planetary-mass objects in the circumstellar disk.
Export citation and abstract BibTeX RIS
1. INTRODUCTION
The observation of many star-forming regions has shown that stars form in molecular cloud cores. A star is born after a long journey through the gravitational collapse of a cloud core. The gas begins to collapse in a dense part of the cloud (i.e., the cloud core) and increases its density and temperature as the cloud core collapses further. When the collapsing gas reaches a sufficiently high density (∼1021 cm−3), the collapse stops and a protostar having almost a Jovian mass is born (Larson 1969). Then, the protostar increases its mass through mass accretion and finally evolves into a main-sequence star (or into the main-sequence phase).
The star formation process can be divided into two phases: the early protostellar collapse phase and the later accretion phase of the star formation. The early phase, also called the gas collapsing phase, is defined as the period before protostar formation after gas collapse is initiated in the cloud core. Thus, during this phase, the gas continues to collapse. On the other hand, the later phase is defined as the period before the main-sequence phase after the gas collapse stops and a protostar appears in the collapsing cloud core. In particular, during the later phase, the period when the protostar significantly increases its mass by mass accretion is called "the main accretion phase." Since the star acquires almost all its mass in this main accretion phase, the final stellar mass is determined in this phase. Protostars during the main accretion phase are observed (or defined) as Class 0 or I objects by spectral energy distribution (SED). The observation of star-forming regions has also shown that almost all Class 0 or I objects drive a protostellar outflow. Because a certain fraction of mass and angular momentum are ejected by the protostellar outflows, they are closely related to the rate of mass accretion onto the protostar and final stellar mass. Moreover, the infalling gas with an angular momentum forms the circumstellar disk during the main accretion phase. The evolution of the circumstellar disk is related to the mass accretion and outflow rates. In addition, the circumstellar disk is the site of planet formation. Therefore, understanding the evolution of the circumstellar disk during the main accretion phase is essential to understanding both the star and planet formation processes.
Since the protostar and circumstellar disk during the main accretion phase are veiled by the infalling envelope, it is difficult to observe them. Recently, however, the Spitzer Space Telescope has been unveiling this phase. Enoch et al. (2009a) discovered a massive circumstellar disk of ∼1 M☉ comparable to a central protostar around a Class 0 object, indicating that (1) the disk already exists in the main accretion phase and (2) the disk mass is significantly larger than the theoretical prediction. Evans et al. (2009) observed several star-forming regions and identified several Class 0 objects using Spitzer. They showed that the bolometric luminosity of the objects is considerably dimmer than classical theoretical predictions, and has a dispersion over 2–3 orders of magnitude. They pointed out that recent observations aggravate the "luminosity problem" (the problem that the accretion luminosity of protostars is lower than theoretical predictions, see Kenyon et al. 1990), and concluded that non-steady accretion is inevitably required to explain the observational results. Non-steady accretion may be attainable when the circumstellar disk is sufficiently massive and causes gravitational instability (Durisen et al. 2007).
Another recent development in the observation of star and planet formation is the direct images of exoplanets (Kalas et al. 2008; Marois et al. 2008; Thalmann et al. 2009), in which planets are located at ≳10 AU from the central star. However, in the framework of the core accretion scenario (Hayashi et al. 1985), there is less likelihood of planets forming in a region that is so remote from the central star. Alternatively, the gravitational instability scenario (Cameron 1978) may explain the formation of such planets. In summary, recent observations seem to indicate that the protostars have a considerably massive disk unlike what was previously believed.
Although it seems that recent observational progress is unveiling problems during the early evolution stage of star formation, we cannot directly observe the circumstellar disk and protostar in the main accretion phase because they are embedded in the dense infalling envelope. Thus, theoretical study is necessary to understand the properties of the circumstellar disk and protostar. In particular, multi-dimensional simulations are necessary to investigate the evolution of the circumstellar disk, protostellar outflow, and so on.
The evolution of the collapsing gas cloud core from the protostellar core stage (i.e., the gas collapsing phase) until protostar formation has been well investigated using multi-dimensional simulations (e.g., Bate 1998; Tomisaka 2002; Whitehouse & Bate 2006; Stamatellos et al. 2007; Banerjee & Pudritz 2006; Machida et al. 2006, 2007, 2008a, 2008b, 2009b). On the other hand, only a few studies have focused on the main accretion phase immediately following the prestellar core stage, because it is difficult to calculate long-term evolution in the main accretion phase with sufficient spatial resolution. In unmagnetized cloud cores, the formation and evolution of the circumstellar disk in the main accretion phase through the gas collapsing phase were investigated by Walch et al. (2009a, 2010), Vorobyov & Basu (2010), and Machida et al. (2010a). They found that the circumstellar disk is considerably massive enough to induce either fragmentation or the gravitational instability that is related to a non-steady accretion flow onto the protostar.
In reality, however, since molecular clouds are strongly magnetized (Crutcher 1999), the magnetic field may play an important role in the evolution of the circumstellar disk during the main accretion phase. Vorobyov & Basu (2006, 2007) investigated the evolution in two dimensions of the circumstellar disk in a magnetized cloud core and showed the non-steady accretion onto the central protostar. In three dimensions, the formation and evolution of the circumstellar disk from the prestellar core stage were investigated only by Inutsuka et al. (2010), in which they showed fragmentation and possible planet formation in the magnetically inactive region of the circumstellar disk during the main accretion phase. They also indicated non-steady mass accretion onto the protostar owing to the gravitational instability of the circumstellar disk. However, this study only calculated the evolution of the circumstellar disk about ∼1000 yr after protostar formation.
In this study, in a setting similar to Inutsuka et al. (2010), we investigate the evolution of the circumstellar disk for ∼104 yr, which is ∼10 times longer than the previous study. In addition to the model adopted by Inutsuka et al. (2010), we calculate the evolution of the circumstellar disk formed in a relatively stable initial cloud core. In both models, we compare the mass accretion rate, properties of protostellar outflow, and the fragmentation condition. The structure of the paper is as follows. The framework of our models and the numerical method are given in Section 2. The numerical results are presented in Section 3. We discuss the fragmentation condition of the circumstellar disk and its implication for the planet formation in Section 4, and we summarize our results in Section 5.
2. MODEL AND NUMERICAL METHOD
2.1. Basic Equations
To study the formation and evolution of a circumstellar disk in a magnetized molecular cloud core, we solve the three-dimensional resistive MHD equations, including self-gravity:

where ρ,  , P,
, P,  , ηOD, and ϕ denote density, velocity, pressure, magnetic flux density, Ohmic resistivity, and gravitational potential, respectively. In addition, we adopted the hyperbolic divergence cleaning method of Dedner et al. (2002) to obtain a divergence-free magnetic field (
 ). With this method, no magnetic monopoles appear throughout the calculation (see also Machida et al. 2005b; Matsumoto 2007).
To mimic the temperature evolution calculated by Masunaga & Inutsuka (2000), we adopt the piecewise polytropic equation of state (see Vorobyov & Basu 2006; Machida et al. 2007) as
where cs,0 = 190 m s−1 and ρc = 3.84 × 10⁻¹⁴ g cm−3 (nc = 1010 cm−3). With Equation (5), the gas behaves isothermally for n ≲ 1010 cm−3 and adiabatically for n ≳ 1010 cm−3. For a realistic evolution of the magnetic field in the circumstellar disk, we adopt the resistivity (ηOD) as the fiducial value in Machida et al. (2007), in which the Ohmic dissipation becomes effective for 1011 cm−3 ≲ n ≲ 1015 cm−3 (for details, see Equations (9) and (10), and Figure 1 of Machida et al. 2007).
2.2. Initial Setting and Numerical Method
As the initial state, we take a spherical cloud core with a critical Bonnor–Ebert (BE) density profile, in which a uniform density (ρamb ≃ 0.07ρc) is adopted outside the sphere (r>Rc). For the BE density profile, we adopt the central density as nc = 106 cm−3 and isothermal temperature as T = 10 K. For these parameters, the critical BE radius is Rc = 4.7 × 10³ AU. The gravitational force is ignored outside the host cloud (r>Rc) to mimic a stationary interstellar medium. In addition, we prohibit the gas inflow at r = Rc from suppressing mass input from the interstellar medium into the gravitationally collapsing cloud core. Thus, only the gas inside r < Rc collapses to form the circumstellar disk and protostar. Note that although the protostellar outflow driven by the circumstellar disk propagates into the region of r>Rc and disturbs the interstellar medium over time, we can safely calculate the mass accretion process onto the circumstellar disk because the outflow propagating into the interstellar medium does not affect the inner cloud core region (r < Rc). In this study, we call this initial spherical cloud with BE density profile "the cloud core" that has a radius of Rc and mass of Mcl.
Since the critical BE sphere is in an equilibrium state, we increase the density by a factor of f to promote the contraction, where f is the density enhancement factor that represents the stability of the initial cloud core. An initial cloud core with larger f is more unstable against gravity. In general, the stability of the cloud core is represented by a parameter α0 (≡Eth/Egrav), which is the ratio of thermal (Eth) to gravitational (Egrav) energy. As shown in Matsumoto & Hanawa (2003), when the BE density profile is adopted, the density enhancement factor is related to the parameter α0 as
We constructed two models with different f (=1.68 and 2.8). In this paper, we call the model having f = 1.68 (α = 0.5) "model A05" and the model having f = 2.8 (α = 0.3) "model A03." At the initial state, model A03 is more unstable than model A05.
In both models, the initial cloud core rotates rigidly around the z-axis in the region of r < Rc, while the uniform magnetic field parallel to the z-axis (or rotation axis) is adopted in the whole computational domain. In addition, the angular velocity decreasing in proportion to exp(−r2) outside the host cloud (r>Rc) is also adopted. Both models have the same angular velocity with Ω0 = 1.1 × 10⁻¹³ s−1 and the same magnetic field, B0 = 37 μG. The mass inside r < Rc for each model is 0.8 M☉ (model A05) and 1.3 M☉ (model A03). Model names and initial values are summarized in Table 1. The initially magnetized, rotating cloud core is also specified by the non-dimensional parameters β0 and γ0, where β0 (≡Erot/|Egrav|) and γ0 (≡Emag/|Egrav|) is the ratio of the rotational and magnetic energy to the gravitational energy inside the initial cloud core. Model A03 has β0 = 2 × 10⁻³ and γ0 = 0.02, while model A05 has β0 = 3 × 10⁻³ and γ0 = 0.05. In addition, the mass-to-flux ratio M/Φ is also used to specify the initial cloud, where M and Φ are the mass and magnetic flux of the initial cloud core. There exists a critical value of M/Φ below which a cloud is supported against the gravity by the magnetic field. For a cloud with uniform density, Mouschovias & Spitzer (1976) derived a critical mass-to-flux ratio
where the constant ζ = 0.53. We define the mass-to-flux ratio normalized by the critical value as λ. In our setting, model A03 has λ = 8.9, while model A05 has λ = 5.5.
Table 1. Model Parameters and Calculation Results
| Model | α0 | f | Ω0 (s−1) | Bini (μG) | Mcl ( ) ) |
Rc (AU) | λ | Mps ( ) ) |
Mdisk ( ) ) |
Npl |
|---|---|---|---|---|---|---|---|---|---|---|
| A03 | 0.3 | 2.8 | 1.1 × 10⁻¹³ | 37 | 1.3 | 4700 | 8.9 | 0.59 | 0.15 | 16 |
| A05 | 0.5 | 1.7 | 1.1 × 10⁻¹³ | 37 | 0.8 | 4700 | 5.5 | 0.15 | 0.03 | 0 |
Download table as: ASCIITypeset image
We add a m = 2-mode non-axisymmetric density perturbation to the initial cloud core. Then, the density profile of the cloud core is described as
where ρBE(r) is the density distribution of the critical BE sphere, and δρ is the axisymmetric density perturbation. For the m = 2-mode, we chose

where Aϕ (= 0.01) represents the amplitude of the perturbation. The radial dependence is chosen so that the density perturbation remains regular at the origin (r = 0) at one timestep after the initial stage. This perturbation ensures that the center of gravity is always located at the origin.
In the collapsing cloud core, we assume the protostar formation to occur when the number density exceeds n>1013 cm−3 at the center. To model the protostar, we adopt a sink around the center of the computational domain. In the region r < rsink = 1 AU, gas having a number density of n>1013 cm−3 is removed from the computational domain and added to the protostar as gravity in each timestep (for details, see Machida et al. 2009a, 2010a). This treatment of the sink makes it possible to calculate the evolution of the collapsing cloud core and circumstellar disk for a longer duration. In addition, inside the sink, the magnetic flux is removed by Ohmic dissipation, because such a region has a magnetic Reynolds Re number exceeding unity Re>1 (for details, see Machida et al. 2007).
To calculate on a large spatial scale, the nested grid method is adopted (for details, see Machida et al. 2005a, 2005b). Each level of a rectangular grid has the same number of cells (128 × 128 × 32). The calculation is first performed with five grid levels (l = 1–5). The box size of the coarsest grid l = 1 is chosen to be 25Rc. Thus, the grid of l = 1 has a box size of ∼1.5 × 10⁵ AU. A new finer grid is generated before the Jeans condition is violated (Truelove et al. 1997). The maximum level of grids is lmax = 12 which has a box size of 74 AU and a cell width of 0.58 AU.
We adopted a fixed boundary condition on the outermost grid boundary. The uniform density (ρamb) and magnetic field (Bx = 0, By = 0, Bz = B0) and zero fluid velocity (vx = vy = vz = 0) are imposed on the l = 1 grid boundary at each timestep. Such a boundary condition hardly affects the evolution of the cloud core, because the gravitationally collapsing cloud core with a radius of 4.7 × 10³ AU (r = Rc) is embedded in a large simulation box with a size of ∼1.5 × 10⁵ AU, inside which the static interstellar medium is fulfilled in the region of r>Rc. In our setting, the Alfv n speed in the interstellar medium (r>rBE) for model A03 is vA = 0.15 km s−1. Thus, for the Alfv
 n wave to reach the computational boundary from the center of the cloud core, it will take 2.4 × 10⁶ yr. Since we stopped our calculation ∼104 yr after the calculation began, the Alfv
 n wave generated at the center of the cloud core (or the computational boundary) never reaches the computational boundary (or the center of the cloud core).
3. RESULTS
We calculated the formation and evolution of the circumstellar disk in magnetized collapsing cloud cores. First, we simply outline the formation and evolution of the circumstellar disk. Before protostar formation, the first (adiabatic) core forms in the collapsing cloud core with a scale of ∼10 AU (Larson 1969; Masunaga & Inutsuka 2000; Saigo & Tomisaka 2006). At its formation, the first core has a thick disk-like structure and is mainly supported by the thermal pressure gradient force. After protostar formation, the first core becomes thin because the centrifugal force dominates the thermal pressure gradient force (Walch et al. 2009a; Machida et al. 2010a). During the main accretion phase, the first core grows and extends to a large extent (∼100–1000 AU). Inutsuka et al. (2010) and Machida et al. (2010a) pointed out that the circumstellar disk originates from the first core and is formed before protostar formation (see also Bate 1998, 2010). Their calculations showed that the first core gradually grows to become the circumstellar disk in the main accretion phase. They also pointed out that, reflecting the thermal history of the collapsing cloud core, the circumstellar disk is inevitably more massive than the protostar in the early part of the main accretion phase. The formation of the first core (or the circumstellar disk) before protostar formation has been investigated in many past studies (see review by Bodenheimer et al. 2000; Goodwin et al. 2007). Thus, although we began the calculation from the prestellar core stage, we mainly focus on the evolution of the circumstellar disk in the main accretion phase in this paper.
3.1. Recurrent Fragmentation and Planet Formation
As described in Section 2, we constructed two models (models A03 and A05) with different initial stabilities (i.e., different α0). In the two models, the protostar forms t ≃ 2.50 × 10⁴ yr (model A03) and t ≃ 5.48 × 10⁴ yr (model A05) after the calculation begins. Thus, in the collapsing cloud core, the protostar for model A03 forms in a shorter duration than that for model A05. This is because the initial cloud core for model A03 is more unstable than that for model A05 and begins to collapse according to the self-similar solution (Larson 1969) in a shorter time after the calculation begins (Machida et al. 2008b). In both models, we calculated the evolution of the circumstellar disk for ∼104 yr after protostar formation.
First, we describe the evolution of the circumstellar disk for model A03 that shows the recurrent fragmentation and formation of substellar-mass object in the main accretion phase. Figure 1 shows the evolution of the circumstellar disk after protostar formation for model A03, in which the density distributions around the protostar on the equatorial plane are plotted. The box sizes in the upper panels are ∼80 AU, while those in the middle and lower panels are ∼320 AU. Figure 1(a) shows the structure of the circumstellar disk tc ≃ 450 yr after protostar formation, in which the red region (n ≳ 1010 − 1011 cm−3) corresponds to the circumstellar disk. Note that we describe the elapsed time after protostar formation with the notation "tc," which differs from the elapsed time "t" after the calculation begins (or the cloud begins to collapse). The size of the circumstellar disk increases with time and extends up to r∼ 200 AU by the end of the calculation. In the circumstellar disk, fragmentation occurs due to gravitational instability tc ≃ 795 yr after protostar formation (for details, see Inutsuka et al. 2010 and Machida et al. 2010a). Two ambiguous clumps appear in Figures 1(b) and (c), while two clear fragments are seen in Figure 1(d). Fragmentation occurs ∼6.8 AU away from the protostar. Then, the fragments orbit around the protostar with an orbital separation of ∼2–38 AU (Figures 1(c)–(e)) and finally fall onto the protostar at tc ≃ 3657 yr (Figures 1(e) and (f)). In this section, we call the fragment that appeared in the circumstellar disk the planet. Note that in reality, since some fragments that appeared in this calculation exceeded the deuterium-burning limit (about 13 Jupiter mass), they are not planets in the complete sense. Note also that we define, for convenience, the objects born in the circumstellar disk as planets to characterize them as a whole: we discuss their mass in Section 4.2.
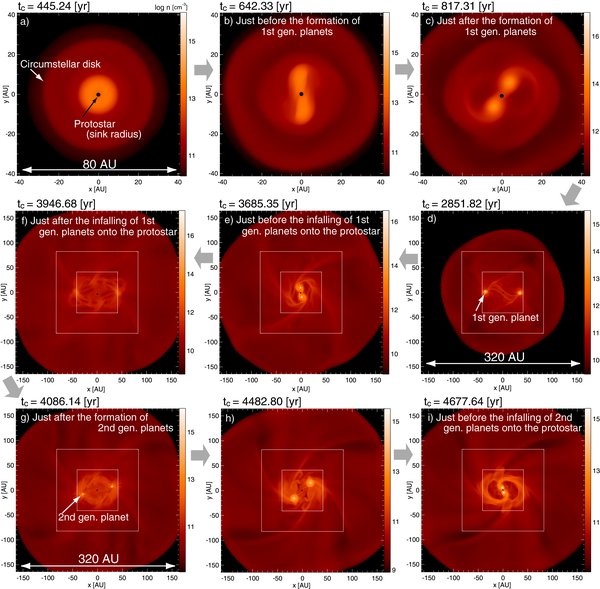
Figure 1. Time sequence images of the circumstellar disk after protostar formation for model A03. The density distribution on the equatorial plane around the protostar is plotted in each panel. The size of the black circle at the center of each panel corresponds to the sink radius. The box size of the upper three panels is ∼80 AU, while that of the middle and lower panels is ∼320 AU. The white squares in the middle and lower panels denote the outer boundary of the subgrid. The time elapsed after the protostar formation tc is plotted on the upper side of each panel.
Download figure:
Standard image High-resolution imageFigure 2 shows the structure of the circumstellar disk and protostellar outflow at almost the same epoch as Figure 1(c) in three dimensions. The outflow driven by the first core in the collapsing cloud core has been studied by many authors (e.g., Matsumoto & Tomisaka 2004; Machida et al. 2004, 2005b; Hennebelle & Fromang 2008). Even in the main accretion phase (i.e., even after protostar formation), the circumstellar disk that originates from the first core continues to drive the outflow (Tomisaka 2002; Banerjee & Pudritz 2006; Machida et al. 2007, 2009a). In this model, the outflow driven by the circumstellar disk extends up to ∼516 AU by the end of the calculation. As seen in Figure 2, the outflow is driven only by the outer disk region, while the outflow is not driven by the inner region of the circumstellar disk where fragmentation occurs and planets appear. This is because the inner disk region has a density of n ≳ 1011–1012 cm−3 and the magnetic field is dissipated by Ohmic dissipation. As shown in Nakano et al. (2002) and Machida et al. (2007), when the number density exceeds n ≳ 1011–1012 cm−3, Ohmic dissipation becomes effective owing to the extremely low ionization degree. Note that the ambipolar diffusion can be effective in the range of n < 1011–1012 cm−3 (see Section 4.3). Fragmentation is suppressed by the magnetic field because magnetic effects such as magnetic braking and outflows effectively transfer the angular momentum that promotes fragmentation (Machida et al. 2005a, 2008b; Hennebelle & Teyssier 2008). Thus, a weaker field promotes fragmentation in the circumstellar disk. As a result, the inner disk region has a considerable weak magnetic field and fragmentation occurs without outflow, while the outer disk region has a strong field and no fragmentation occurs with outflow.

Figure 2. Configuration of protostellar outflow at tc = 843 yr is shown by yellow volume, in which color indicates outflow speed. The density distributions (colors) are projected on each wall surface. The velocity vectors (arrows) on the equatorial plane are plotted on bottom surface. The magnetic field lines integrated from each planet are plotted by yellow lines. The box size is 100 AU.
Download figure:
Standard image High-resolution imageIn Figure 2, yellow lines are magnetic field lines. In the figure, only magnetic field lines that threaded the planets are plotted to stress the planet's spin or orbital motion. The magnetic field lines just above each planet are strongly twisted by the spin motion of the planet. In midair (or on a large scale), the magnetic field lines originating from each planet are twisted together, reflecting the orbital motion of the planets. Although we only plotted magnetic field lines near the planet to understand the planet's motion, the magnetic field (or Lorentz force) in this region (or inner disk region) is extremely weak (βp ≫ 10, where βp is the plasma beta and different from initial ratio of the rotational to the gravitational energy, β0) because Ohmic dissipation is effective. Thus, near the planets, the magnetic field lines are passively moved, and they hardly affect the dynamical evolution of both the planet and circumstellar disk. However, the planets perturb the outer disk region that is connected to the magnetic field lines driving the outflow (i.e., the magnetic field lines in the outer disk region where Ohmic dissipation is not effective). As a result, a highly time-variable outflow appears in this model. We will discuss an intermittent outflow in Section 3.7.
Figure 1(e) shows the structure of the circumstellar disk just before the planets fall onto the protostar, while Figure 1(f) shows the disk just after the fall. After the first-generation planets disappear, fragmentation occurs again in the circumstellar disk and the second-generation planets appear tc ≃ 3990 yr after protostar formation as shown in Figure 1(g). However, these planets also fall onto the protostar ∼680 yr after their formation. The formation and falling of the planets are repeated several times in the circumstellar disk. By the end of the calculation, 18 planets appeared and 16 planets fell onto the protostar. Figure 3 shows eighth- and ninth-generation planets. The eighth-generation planets fell onto the protostar, while the ninth-generation planets survived until the end of the calculation. The orbital radius ri, time ti at planet formation, the planet's falling epoch te, lifetime te − ti, and mass at its formation Mpl are summarized in Table 2.
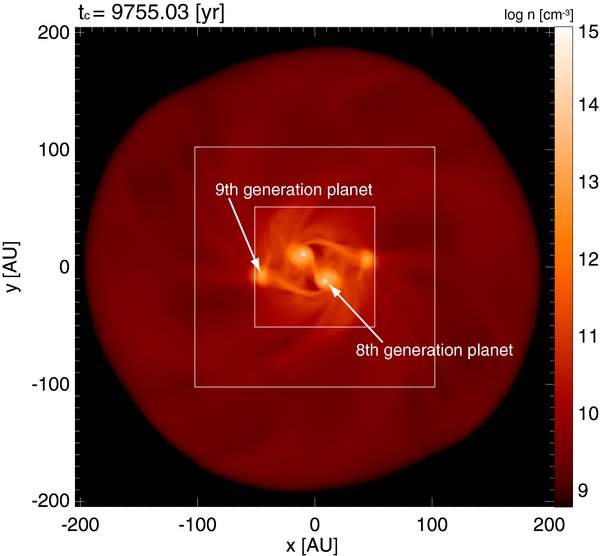
Figure 3. Density distribution of the circumstellar disk on the equatorial plane tc = 9755 yr after protostar formation. Eighth- and ninth-generation planets are shown.
Download figure:
Standard image High-resolution imageTable 2. Properties of Planets
| Generation | ri (AU) | ti (yr) | te (yr) | te − ti (yr) | Mpl (MJup) | |
|---|---|---|---|---|---|---|
| 1 | 6.8 | 795 | 3657 | 2862 | 23 | |
| 2 | 45.8 | 3990 | 4669 | 679 | 6 | |
| 3 | 22.5 | 5037 | 5693 | 656 | 26 | |
| 4 | 36.9 | 5984 | 6603 | 619 | 16 | |
| 5 | 36.5 | 6697 | 7503 | 806 | 15 | |
| 6 | 40.2 | 7504 | 8446 | 942 | 9 | |
| 7 | 23.3 | 8455 | 9240 | 785 | 27 | |
| 8 | 25.9 | 9327 | 9760 | 433 | 25 | |
| 9 | 22.1 | 9748 | ⋅⋅⋅ | ⋅⋅⋅ | 12 |
Download table as: ASCIITypeset image
3.2. Orbital Trajectories of Planets
Figure 4 shows the orbital evolution of planets against time after protostar formation tc. When multiple planets appear as seen in Figures 1 and 3, only the orbital radius of the most massive planet is plotted. The figure indicates that the first-generation planets form ∼6.8 AU from the protostar at tc ≃ 795 yr, and shrink their orbit and fall onto the protostar after ∼10 orbital rotations. The second-generation planets appear at ∼46 AU and fall onto the protostar after ∼2–3 orbital rotations. This formation and falling of planets is repeated until the ninth-generation planet is formed.

Figure 4. Orbital evolution of the most massive planet against time elapsed after protostar formation. Symbol "◯" indicates the epoch at which fragmentation occurs and a planet appears, while the symbol "×" is the epoch at which planet falls onto protostar. Numbers 1–9 correspond to the planet generation.
Download figure:
Standard image High-resolution imageFigure 5 shows the trajectory of the planets for each generation. The figure indicates that planets shrink their orbits with a certain amount of eccentricity. Figures 4 and 5 show that planets are born ∼6–50 AU from the protostar and orbit for ∼500–1000 yr (or 2–10 orbital rotations) around the protostar. In addition, these figures show that the first-generation planets are formed at a relatively small orbital radius (∼6.5 AU) and orbit for ∼10 times around the protostar, while other generations of planets are formed at a larger orbital radii (∼20–50 AU) and orbit only for 2–3 times. This is because the circumstellar disk increases its size and mass with time. As shown in Figure 1, the circumstellar disk has a size of ∼20–30 AU when the first-generation planet appears, while the disk size reaches 160 AU just before the second-generation planet appears. As a result, the magnetically inactive zone also expands as the disk mass and radius increase, and fragmentation and planet formation can occur in such an outer disk region. The mass evolution of the circumstellar disk is shown in Section 3.4, and the fragmentation condition is discussed in Section 3.6.

Figure 5. Trajectory for each planet just after planet formation (diamonds) until the planet falls onto the protostar (first- to eighth-generation planets) or the end of calculation (ninth-generation planet). Size of black circle at the center corresponds to the sink radius.
Download figure:
Standard image High-resolution image3.3. Non-fragmentation Model
Unlike model A03, model A05 shows no fragmentation in the circumstellar disk by the end of the calculation. Figure 6 shows the density distribution on the y = 0 (left) and z = 0 (right) planes tc = 3781 yr after protostar formation for model A05. As in model A03, model A05 also shows the outflow driven by the circumstellar disk. The outflow appears ∼700 yr before protostar formation and reaches ∼4400 AU at the end of the calculation. In the right panel, the ring-like density gap is seen in the range of 40 AU ≲ r ≲ 80 AU. In this range, the gas is largely blown away from the circumstellar disk by the outflow.

Figure 6. Density distribution (color) on the y = 0 plane (left panel) and z = 0 plane (right panel) for model A05 at tc = 3781 yr after protostar formation. Arrows indicate the velocity. The left panel has a box size of 640 AU, while the right panel has a box size of 320 AU.
Download figure:
Standard image High-resolution imageIn the right panel, a non-axisymmetric structure is seen in the proximity of the protostar (r ≲ 40 AU), while nearly axisymmetric structures are seen in the outer disk region (r ≳ 40 AU). The magnetic field is well coupled with neutrals in the outer disk region because the gas density is lower than n ≲ 1011 cm−3 where Ohmic dissipation is not effective. Thus, the angular momentum is effectively transferred by magnetic braking in the outer disk region, and the gas in such a region can fall into the inner disk region. On the other hand, the magnetic field is significantly dissipated by the Ohmic dissipation in the inner disk region (r ≲ 40 AU), because the density in such a region exceeds n ≳ 1011 cm−3. Thus, in the inner disk region, angular momentum transfer by the magnetic field is not effective, and the excess angular momentum and accumulated mass cause gravitational instability to induce the non-axisymmetric structure (Walch et al. 2009a; Machida et al. 2010a). However, since the increase rate of the disk mass for model A03 is considerably smaller than that for model A05 (see Section 3.4), the circumstellar disk for model A05 is not sufficiently massive to induce fragmentation (see Section 3.6). For model A05, fragmentation and formation of a substellar-mass object do not occur until the end of the calculation. As a result, since the circumstellar disk is not disturbed by the fragments, the protostellar and circumstellar-disk mass moderately increase, unlike in the case of model A03 (see Section 3.4).
3.4. Masses of Protostar and Circumstellar Disk
Figure 7 shows the evolution of protostellar mass against time after protostar formation. The protostellar mass Mps is derived as the mass falling into the sink. At its formation, the protostar has a mass of  , as expected in spherically symmetric calculations (Larson 1969; Masunaga & Inutsuka 2000). In the main accretion phase, protostars increase their mass by gas accretion and reach Mps = 0.59 M☉ (model A03) and 0.15 M☉ (model A05), respectively, at the end of the calculation. In Figure 7, the step-like increase of the protostellar mass for model A03 is caused by the falling of the planet. Since the planet and its envelope have a total mass of ∼6–27 MJup (see Table 2), the protostar drastically increases its mass at the moment of falling. In both models, the protostars have almost the same mass for tc ≲ 3000 yr, while the protostar for model A03 is more massive than that for model A05 for tc ≳ 3000 yr. The difference in protostellar masses is caused by the difference in the rate of mass accretion onto the protostar. The different mass accretion rates are due to different efficiencies of the angular momentum transfer in the circumstellar disk. The higher rate of mass accretion onto the protostar is realized in a more massive circumstellar disk, because a massive disk tends to show gravitational instability that effectively transfers the angular momentum outward, and increases the rate of mass accretion onto the protostar.
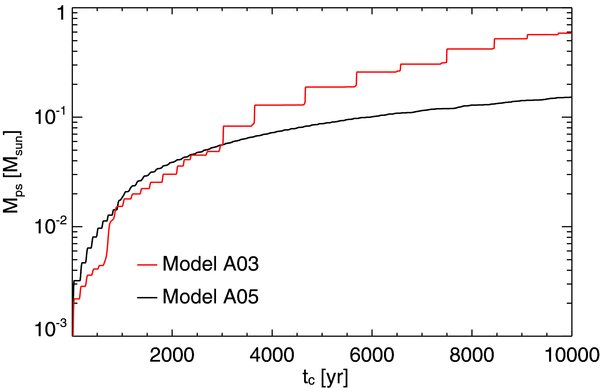
Figure 7. Protostellar mass for models A03 (red) and A05 (black) against time elapsed after protostar formation.
Download figure:
Standard image High-resolution imageFigure 8 shows the time evolution of the circumstellar-disk mass that is estimated in the same manner as in Machida et al. (2010a). The figure indicates that the disk mass for model A03 is significantly greater than that for model A05 at the epoch just after protostar formation. The circumstellar disk for model A05 gradually increases its mass until the end of the calculation and reaches Mdisk ∼ 0.042 M☉ for ∼104 yr. The average increase rate of disk mass for model A05 is  . On the other hand, the circumstellar disk mass for model A03 reaches Mdisk ∼ 0.15 M☉ for ∼104 yr with an average increase rate of
  . Thus, considering that the initial stability of the cloud core is closely related to the mass accretion rate (see Section 4.2), the increase rate of the disk mass for model A03 is about one order of magnitude higher than that for model A05. Note that it is difficult to accurately estimate the total mass of accreting gas onto the circumstellar disk because a fraction of the circumstellar-disk mass falls onto the protostar with time. For model A03, the disk mass shows a high time variability that is caused by the time variable mass accretion onto the protostar (see Section 3.5); the spike-like decrease of the disk mass for model A03 corresponds to the epoch at which the planet falls onto the protostar.
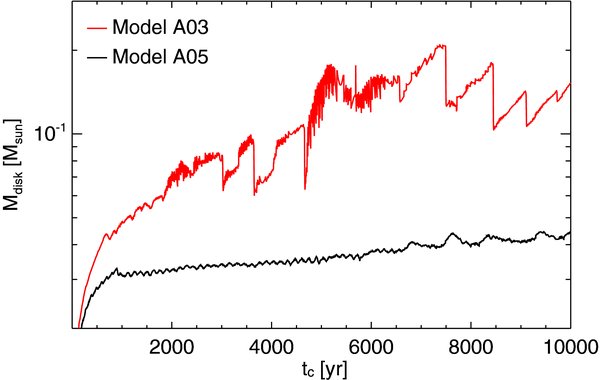
Figure 8. Mass of circumstellar disk for models A03 (red) and A05 (black) against elapsed time after protostar formation.
Download figure:
Standard image High-resolution image3.5. Rate of Mass Accretion onto the Protostar
Since the gas accretes onto the protostar mainly through the circumstellar disk in the main accretion phase, the mass accretion rate depends on disk properties such as disk mass, spiral structure, and existence of fragments. Figure 9 shows the mass accretion rates for ∼104 yr after protostar formation. We estimated the mass falling into the sink every year and defined it as the rate of mass accretion onto the protostar,  . Thus, the time resolution of the accretion rate in Figure 9 is one year, while the timestep of calculations is Δt ≃ 0.001–0.01 yr. Therefore, we integrated the falling mass every ∼100–1000 timesteps.

Figure 9. Mass accretion rate for models A05 (black) and A03 (red) against time elapsed after protostar formation.
Download figure:
Standard image High-resolution imageIn Figure 9, the mass accretion rate for model A05 gradually decreases, oscillating between  and
and  , while model A03 shows intermittent gas accretion with multiple peaks. For model A05, it is considered that the spiral structure in the inner disk region induces the non-steady accretion flow. The spiral structure can transfer the angular momentum outward and move the gas inward. The range of the accretion rate in this model almost corresponds to the theoretical prediction that is expressed as
where fm is a numerical factor (e.g., fm = 0.975 for Shu 1977, fm = 46.9 for Hunter 1977), and cs = 200 m s−1 is adopted. The gas falls onto the circumstellar disk first, and the rate of gas accretion onto the circumstellar disk is ∼4 × 10⁻⁶ M☉ yr−1 on average, as shown in Figure 8. In summary, the rate of mass accretion onto the protostar almost corresponds to the mass accretion onto the circumstellar disk for model A05.
On the other hand, model A03 shows intermittent mass accretion caused by the large-scale perturbation of the disk and the falling of planets. As shown in Figure 4, the first-generation planets form at r ∼ 6.8 AU and orbit in the range of 2–40 AU until they fall onto the planet. They disturb the circumstellar disk and transfer the angular momentum outward. Thus, the mass accretion rate is linked to the orbital motion of the planet especially for tc ≲ 3500 yr, i.e., before the first-generation planets fall onto the protostar. After the first-generation planets disappear, planets of subsequent generations (second to ninth) appear at r ≃ 20–50 AU from the protostar. They orbit in the range of 5–50 AU and approach the protostar within r < 5 AU only before falling onto the protostar. Thus, just before falling, these planets can disturb the inner disk region and promote mass accretion onto the protostar. The peak mass accretion rate for tc ≳ 3500 yr corresponds to the epoch in which a planet approaches and falls onto the protostar. In addition, since not only the gas in the circumstellar disk but also the planet itself falls onto the protostar, the mass accretion rate at its peak for a model with planets is much larger than the theoretical prediction. In Figure 9, there are eight peaks of the mass accretion rate for tc ≳ 3500 yr, corresponding to epochs of falling of planets. In such an epoch, the protostar has a very high mass accretion rate of  , because a planet with mass of
  falls onto the protostar in a short duration. Note that this high accretion rate may be smoothed over time if calculated with a higher spatial resolution, while it is considered that the total mass falling onto the protostar does not change.
3.6. Disk Properties for Models with and without Fragmentation
Figure 10 shows the radial distribution of the surface density σ (Figure 10(a)), Toomre Q-parameter (Figure 10(b); Toomre 1964), plasma βp (Figure 10(c)), and ratio of the azimuthal to Kepler velocity vϕ/vkep (Figure 10(c)). These quantities are azimuthally averaged. The azimuthal-averaged surface density σ [≡σ(r)] is derived as
where
and
where rc is the cylindrical radius and dr = ds(l) (the cell width of lth-level grid) is adopted. To determine zcri in Equation (12), we estimated the disk height by eye and zcri = 10 AU is adopted. We confirmed that the surface density σ hardly depends on zcri in the range of zcri>5 AU. In Figures 10(b) and (c), the Q parameter and plasma βp are integrated along the z-axis and azimuthally averaged. To estimate the Q parameter, first, we integrated the mass-weighted sound speed cs and epicyclic frequency κ along the z-axis as
and
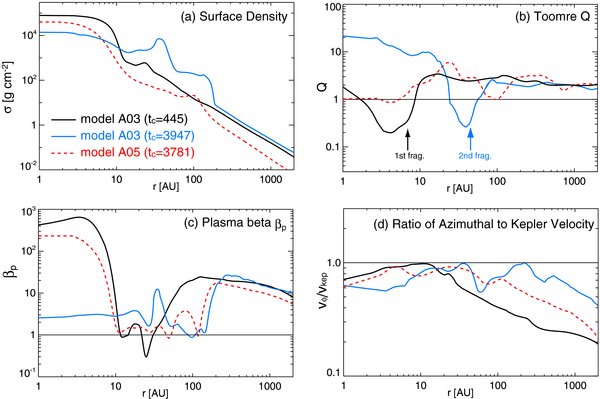
Figure 10. Radial distribution of the surface density (a), Toomre Q-parameter (b), plasma beta βp (c), and ratio of the azimuthal to the Kepler velocity (d) for models with A03 (tc = 445 and 3947 yr) and A05 (tc = 3781 yr).
Download figure:
Standard image High-resolution imageThen, using Equations (12), (14), and (15), we derived the azimuthal-averaged Q parameter as
where
The azimuthal-averaged plasma βp(≡8πc2sρ/B2) is also derived in a similar way to the Q parameter as
where
In addition, the ratio of the azimuthal-averaged vϕ to the Kepler velocity on the equatorial plane is plotted in Figure 10(d). The black lines in Figure 10 are the radial quantities at the epoch just before the first fragmentation (tc = 445 yr) for model A03, while the blue lines are those at the epoch just before the second fragmentation after the first fragments fall onto the protostar (tc = 3947 yr) for model A03. The red-dotted lines are quantities at almost the same epoch (tc = 3781 yr) as the blue lines but for model A05.
The black lines in Figures 10(a) and (b) show that, for r < 10 AU, the surface density has a maximum and the Q parameter becomes Q < 1. Just after this epoch, fragmentation occurs at r = 6.8 AU where Q < 1. The black lines in Figures 10(c) and (d) show that the plasma βp suddenly rises at r ∼ 10 AU, inside which the flow moves azimuthally with close to Keplerian velocity. Since the gas (surface) density is sufficiently high in the region of r < 10 AU, the Ohmic dissipation becomes effective and the magnetic field considerably dissipates. In general, fragmentation hardly occurs when the neutral gas is strongly coupled with the magnetic field (or ions), because the magnetic field suppresses fragmentation (Hennebelle & Teyssier 2008; Machida et al. 2008a). Instead, when Q < 1, fragmentation easily occurs in the magnetically inactive region where the Ohmic dissipation weakens the magnetic field. In summary, at this epoch, fragmentation can occur in the region of r < 10 AU, because Q < 1 is realized owing to the higher surface density and the very weak magnetic field (or higher βp) does not suppress fragmentation.
In the region of r < 10 AU, the surface density at tc = 3947 yr (blue line) is lower than that at tc = 445 yr (black line). This is because, in the inner disk region, the angular momentum is transferred by the orbital motion of the first-generation planets and the gas falls onto the protostar. In addition, planets contribute to the gap formation around the central protostar as seen in Vorobyov & Basu (2010). Thus, at tc = 3947 yr, the surface density near the protostar becomes lower and the Q parameter exceeds Q>1 for r ≲ 30 AU (blue line of Figure 10(b)). Since the lower (surface) density makes the Ohmic dissipation ineffective, a lower plasma βp (βp ∼ 2–4) is realized in this region (r ≲ 40 AU). Therefore, the inner disk region becomes magnetically active and the angular momentum is also transferred by magnetic braking. Figure 10(d) shows that the ratio of the azimuthal velocity to the Kepler velocity at tc = 3947 yr is lower than that at tc = 445 yr. The lower surface density and higher value of plasma βp are not adequate to induce fragmentation. On the other hand, the surface density and plasma βp at tc = 3947 yr have a local peak at r ∼ 30–40 AU (blue lines of Figures 10(a) and (c)). This is because, in this region, the radially inward motion of the flow is suppressed by the first-generation planet and the gas is accumulated. In such a high-density gas region, Ohmic dissipation becomes effective owing to the higher surface density. Thus magnetic braking becomes ineffective and azimuthal velocity approaches the Kepler speed (blue line of Figure 10(d)). Therefore, the centrifugal barrier further amplifies the surface density. Finally, the Q parameter becomes Q < 1 in the range of 20 AU ≲ r ≲ 60 AU (Figure 10(b)), and fragmentation occurs to form second-generation planets at r ≃ 46 AU as seen in Figure 1(g).
In Figures 10(a) and (b), model A05 (red dotted line) has a relatively lower surface density because this model has a lower mass accretion rate onto the circumstellar disk. Therefore, the Q parameter never reaches Q ≪ 1, and fragmentation does not occur until the end of the calculation for model A05. In addition, the lower surface density increases the magnetically active area (Figure 10(c)) and a stronger outflow appears as seen in Figure 6. Thus, the excess angular momentum is mainly transferred by the protostellar outflow and magnetic braking for model A05, while the excess angular momentum contributes to fragmentation for model A03.
In summary, the initial stability (or mass accretion rate) is related not only to the surface density (or mass of the circumstellar disk) but also to the magnetic activity in the circumstellar disk. The higher accretion rate has a higher surface density (i.e., lower Q) and has a large magnetically inactive area where the angular momentum is not transferred by the magnetic effects. Both effects promote fragmentation and planet formation in the circumstellar disk. Instead, since the lower accretion rate has a lower surface density and large magnetically active area, fragmentation and planet formation tend to be suppressed.
3.7. Protostellar Outflow Driven by the Circumstellar Disk
The condition of the circumstellar disk also affects protostellar outflow. Figure 11 shows the mass outflowing from the protostellar system (i.e., protostar + circumstellar disk system) for both models. To measure the outflowing mass, we integrated the gas having vr>cs,0 inside the initial radius of the cloud core (r < Rc), where vr is the radial velocity. The outflowing mass for model A05 gradually increases for tc ≲ 6000 yr and decreases for tc ≳ 6000 yr. Since the free-fall timescale of the initial cloud core is ∼1.8 × 10⁴ yr, it is expected that the outflow weakens after passing the peak and disappears on a free-fall timescale. In addition, the outflow extends far beyond the initial radius of the cloud core for tc ≳ 5000 yr. Thus, we underestimated the outflowing mass for tc ≳ 5000 yr because we integrated the outflowing mass only inside r < Rc. To estimate conclusively the outflowing mass and total ejected mass from the initial cloud core, more long-term calculations are necessary. However, since such calculations are beyond the scope of this study, we no longer comment on them. At its peak, the outflowing mass is about 0.05 M☉ which is comparable to the protostellar mass Mps ≃ 0.1 M☉ (see Figure 7) at the same epoch. Thus, a large fraction of the infalling gas is blown away from the circumstellar disk by the protostellar outflow for model A05.
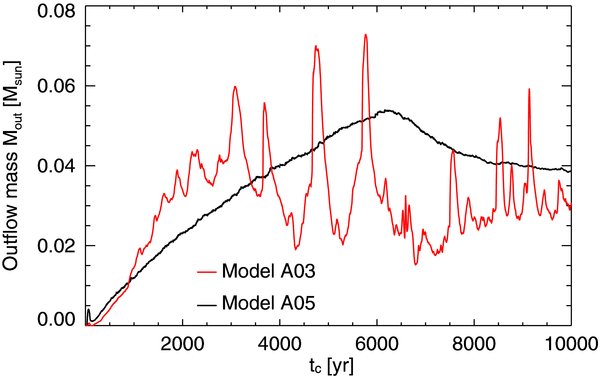
Figure 11. Outflowing mass for models A05 (black) and A03 (red) against time elapsed after protostar formation. Outflow is defined as gas with radial velocity exceeding sound speed vr>cs,0 inside r < Rc.
Download figure:
Standard image High-resolution imageUnlike model A05, in Figure 11, the outflow mass for A03 shows high time variability, indicating that outflow is unsteadily driven by the circumstellar disk. In summary, Figure 11 indicates that steady outflow is driven by the less massive circumstellar disk without fragments (model A05), whereas intermittent outflow is driven by the more massive circumstellar disk with fragments (model A03). Note that Figure 11 shows only the outflowing mass having the high-velocity component of v>cs,0, and ignores the low-velocity component of the outflow.
Figure 12 shows the ratio of the outflowing to infalling mass. To investigate the outflow efficiency, we calculated the outflowing/infalling mass rate on an l = 9 grid surface, which covers the whole circumstellar disk with a grid size of ∼600 AU. According to Tomisaka (2002), we estimated the outflow  and inflow
  masses as
and
where  is the unit vector outwardly normal to the surface of the l = 9 grid. In Figure 12, model A05 keeps an almost constant ratio,
  , until the end of the calculation. Thus, about 30% of the infalling mass is ejected by the outflow. In this model, the outflow is driven by the outer disk region where the axisymmetric structure is kept, while no outflow appears in the inner disk region where a considerably weak magnetic field is realized by Ohmic dissipation and a non-axisymmetric structure appears, as seen in Figure 6. In the outer disk region, the disk mass is blown away by the outflow, and effective magnetic braking moves the gas inward. Therefore, such a region does not maintain sufficient mass to induce gravitational instability. As a result, the steady disk region drives the steady flow for model A05.
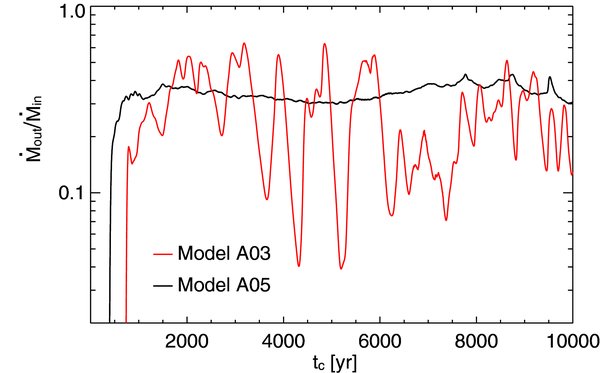
Figure 12. Ratio of outflowing to inflowing mass for models A05 (black) and A03 (red) against time elapsed after protostar formation. The outflowing mass is estimated as the mass ejected from the l = 9 grid, and the inflowing mass is estimated as mass entering the l = 9 grid.
Download figure:
Standard image High-resolution imageOn the other hand, the outer disk region for model A03 does not remain stable, because the increase rate of the disk mass (or the mass accretion rate onto the disk) for model A03 is much larger than that for model A05. Although magnetic braking and mass ejection by the outflow are effective in the outer disk region for model A03 also, they cannot transfer sufficient mass to suppress gravitational instability and subsequent fragmentation owing to the high mass accretion onto the disk. Thus, multiple planets appear in the disk. Oscillation of the infall–outflow mass ratio for model A03 is shown in Figure 12. Comparison of Figure 4 with Figure 12 indicates that this oscillation is related to the orbital motion of the planet. It is considered that the magnetic field lines and surface density of the circumstellar disk are disturbed by the planet's orbital motion, which causes a highly time-variable outflow, as shown in Figure 12. The time-variable protostellar outflow may be a clue for detecting a planet in a very early phase of star formation.
4. DISCUSSION
4.1. Can We Detect Planets or Substellar-mass Objects in the Main Accretion Phase?
So far, it is considered that planets form in relatively quiet circumstellar disks after the gas accretion onto the circumstellar disk has almost ended. In this study, however, we showed the possibility of the formation of planets or substellar-mass objects by gravitational instability in a vigorous circumstellar disk during the main accretion phase, in which the circumstellar disk continues to increase its mass by gas accretion from the infalling envelope. When planets or substellar-mass objects appear in the circumstellar disk, they can affect the rate of accretion onto the protostar. As described in Section 3.5, we may verify their existence by observing the time variability of the rate of accretion onto the central protostar. As seen in Figure 9, the protostar shows a relatively low time variability of the accretion rate when neither planets nor substellar-mass objects exist in the circumstellar disk, while it shows a high time variability of the accretion rate when fragmentation occurs and planets or substellar-mass objects appear. Figure 13 shows the time variation of the accretion luminosity of the protostar, which is defined as
where we adopted the protostellar mass Mps and mass accretion rate  from values derived from the calculations at each time and used a constant protostellar radius rps = 2 R☉ for simplicity. The figure indicates that the protostar for model A05 has an accretion luminosity in the range of
  for ∼104 yr after protostar formation. The accretion luminosity for this model gradually increases for a longer timescale of ∼104 yr, while it oscillates with a period of ∼100 yr, which corresponds to the Kepler timescale in the region of a developing spiral structure. The Kepler timescale τk can be expressed as
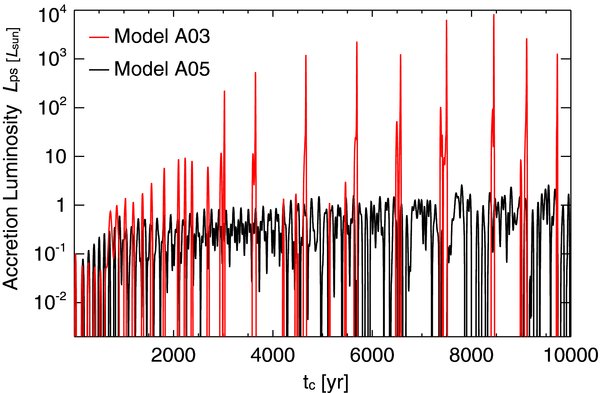
Figure 13. Accretion luminosity of the protostar for models A05 (black) and A03 (red) against time elapsed after protostar formation.
Download figure:
Standard image High-resolution imageAs shown in Figure 6, the non-axisymmetric structure appears at r ≲ 10–40 AU, which corresponds to the magnetic inactive zone (Machida et al. 2007). Thus, it is natural that the protostar shows a time-variable accretion luminosity with a period of ∼100 yr, because the angular momentum transfer that is closely related to the rate of mass accretion onto the protostar is caused by the spiral structure in the circumstellar disk. The variation in the amplitude of the accretion luminosity for a short duration (∼100 yr) is about one order of magnitude.
On the other hand, the accretion luminosity for model A03 is qualitatively and quantitatively different from that for model A05. The protostar for model A03 repeatedly shows a strong brightening. In this model, the accretion luminosity suddenly increases to reach  when planets or substellar-mass objects approach the protostar or fall onto the protostar, while the luminosity is lower, ≲0.1–0.01 L☉, when planets or substellar-mass objects orbit far from the protostar. Thus, the strong brightness may be a clue for detecting planets or sub-stellar-mass objects.
In addition, when the planets or substellar-mass objects orbit in the inner disk region of ≲10–20 AU, their orbital motion is linked to the accretion rate (or accretion luminosity). The accretion rate and orbital radius for tc = 1000–2800 yr for model A03 are plotted in Figure 14. In this time period, the first-generation planet orbits around the protostar for ∼10 times. The figure indicates that the orbital motion of planets or substellar-mass objects clearly synchronizes with the mass accretion rate. The orbiting objects disturb the circumstellar disk and promote mass accretion onto the protostar. Since the circumstellar disk has a higher density and shorter timescale in the proximity of the protostar, a high mass accretion rate is realized when the planets or substellar-mass objects approach the protostar. As a result, the mass accretion rate is closely related to the orbital motion of planets and substellar-mass objects. We may estimate and verify the orbital motion of planets in the circumstellar disk by observing the time-variable mass accretion. Note that we ignored the effect of the infalling envelope when the accretion luminosity is estimated in Figure 13. Note also that, to estimate quantitatively the accretion luminosity, we have to consider the infalling envelope that weakens the luminosity from the protostar.
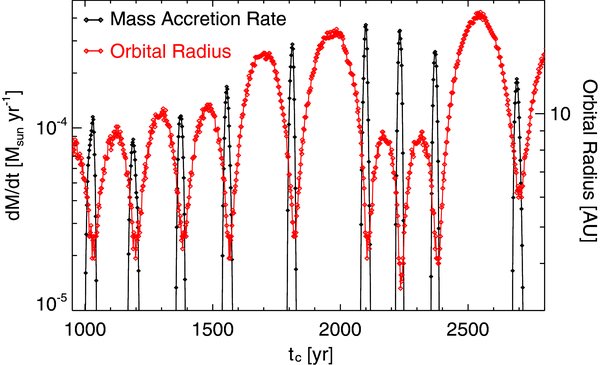
Figure 14. Mass accretion rate (left axis; black line and dots) and orbital radius of the most massive fragment (right axis; red line and dots) for model A03 during tc = 1000–2800 yr after protostar formation. The perihelion of the planet corresponds to the peak of the mass accretion rate.
Download figure:
Standard image High-resolution image4.2. Mass Accretion Rate onto the Disk and Masses of the Fragments
In this study, we showed that fragmentation and subsequent formation of planet and sub-stellar mass object can occur in a massive circumstellar disk, while no fragmentation occurs in a relatively less massive disk. The mass of the circumstellar disk or the mass increase rate of the circumstellar disk is related to the initial stability of cloud core. We parameterized the ratio of thermal energy to gravitational energy, α0, which is related to the mass accretion rate. In general, the mass accretion rate is described as
where MJ is the Jeans mass and tff is the free-fall timescale. In this study, we made an equilibrium sphere (i.e., critical BE sphere) and increased the density (or mass) by a factor of f (=0.84/α0, see Equation (6)) to induce the collapse of the cloud core. Thus, the mass accretion rate in our setting can be described as
where the initial mass of the cloud core Mcl is proportional to the density enhancement factor f and Jeans mass MJ as Mcl ∝ f MJ ∝ α−1 MJ,and the free-fall timescale of the cloud core tff,cl is proportional to tff,cl ∝ f−1/2 tff,0 ∝ α1/2 tff,0,where tff,0 is the free-fall timescale of a critical BE sphere. Thus, a more unstable cloud core that has a smaller α0 has a larger mass accretion rate and tends to show fragmentation due to gravitational instability. In reality, the mass increase rate for the model A03 is about three times higher than that for the model A05. Thus, the fragmentation and subsequent planets or substellar-mass objects may appear in relatively unstable cloud cores.
In general, however, the initial clouds are characterized by three parameters, α0, β0, and γ0, as described in Section 2.2. Although we fixed the angular velocity (β0) and magnetic field strength (γ0) of the initial cloud core in this study, fragmentation may occur in more stable cloud cores (i.e., cloud cores with large α0) with different β0 and γ0. As shown in Hennebelle & Teyssier (2008), in the collapsing cloud core, the magnetic field suppresses fragmentation while the rotation promotes it. Thus, fragmentation tends to occur in the cloud core with larger β0 and smaller γ0 (Machida et al. 2008b). Moreover, even in a cloud core with a very weak magnetic field, fragmentation in the circumstellar disk may be suppressed by the global spiral structure that effectively transports the angular momentum and lowers the surface density (i.e., increases the Toomre Q-parameter). On the other hand, when the circumstellar disk is strongly magnetized, the angular momentum is transferred by magnetic effects and the spiral structure hardly develops. Then, the mass accumulates in the inner disk region where Ohmic dissipation significantly weakens the magnetic field, and fragmentation can occur because no global spiral structure develops. Thus, magnetic field and rotation contribute to both promotion and suppression of fragmentation through a complicated process. In this study, we showed the possibility of fragmentation in the main accretion phase. However, to quantitatively determine fragmentation and the subsequent formation of planets and substellar-mass objects in the circumstellar disk, we should investigate the evolution of the circumstellar disk from the molecular cloud core in a large parameter space.
In the circumstellar disk, fragmentation occurs and planets or substellar-mass objects appear. In this study, we resolved the fragmentation process with sufficient spatial resolution (Truelove et al. 1997). However, higher spatial resolution and further developed numerical techniques may be necessary to determine the final mass of fragments. At its formation, a fragment's mass almost corresponds to the Jeans mass. In this study, we assumed the barotropic equation of state, in which the minimum Jeans mass is limited to ∼5 MJup. Thus, fragmentation does not occur with a fragment mass of M ≲ 5 MJup. If the circumstellar disk cools and reaches lower temperatures, more less-massive fragments may appear. The barotropic approximation makes it possible to calculate the very long-term evolution of the circumstellar disk and to investigate the evolution of the circumstellar disk by the end of the main accretion phase from the prestellar core stage, while radiation hydrodynamic calculations are necessary to qualitatively estimate the fragment mass.
In addition, after fragmentation occurs in the circumstellar disk, we need a higher spatial resolution to investigate the acquisition process of the fragments' mass. Recent works about a gas-giant planet formation showed that the Hill radius of the protoplanet should be resolved with sufficient spatial resolution for an accurate estimate of the rate of mass accretion onto the protoplanet (Kley et al. 2001; D'Angelo et al. 2003; Bate et al. 2003; Machida et al. 2010b). Note that in these calculations, the protoplanet mass was fixed, and the evolution of the circumstellar disk was calculated with a high spatial resolution for a shorter duration after a gas giant is formed. The Hill radius is expressed as
where rp is the orbital radius of the planet. When the protoplanet orbiting the solar-mass protostar has a mass of Mp = 10−3Mps (10−2Mps) and is located at r = 1 AU (10 AU), the Hill radius is rH ≃ 0.07 AU (1.5 AU). When the Hill radius is resolved with ≳10 cells, we need a minimum spatial resolution (i.e., the size of each cell) of ∼0.007 AU (∼0.15 AU). However, calculation with such a high resolution needs a lot of computing power, and thus we only calculated the evolution of the circumstellar disk for a very short duration. In reality, the evolution of the circumstellar disk was calculated for only ∼1000 yr at best in previous studies, while we calculated the evolution of the circumstellar disk from the prestellar core stage until ∼104 yr after protostar formation.
The final mass of the fragments is important to determine whether they are planets or binary companions. To understand both formation and evolution of (gas-giant) planets, we need to calculate the evolution of the circumstellar disk for a longer duration with a higher spatial resolution. However, such calculations are impossible even using present supercomputers because a longer temporal calculation conflicts with higher spatial resolution. Thus, in this study, we covered the whole prestellar cloud core and investigated the evolution of the circumstellar disk with moderately coarser spatial resolution Δ ≃ 0.6 AU, and showed that fragmentation occurs in the circumstellar disk and a planet or substellar-mass object forms. However, since we need a higher spatial resolution to determine the final mass of the fragment, we did not investigate this point in greater depth. In this study, we showed the possibility of the formation of planets or substellar-mass objects in a magnetized disk for the main accretion phase, and the precise mass of such objects should be investigated in future studies.
4.3. Ohmic Dissipation and Ambipolar Diffusion
As described in Sections 3.6 and 3.7, the recurrent planet formation and intermittent outflow shown in this paper are closely related to the effect of the magnetic field and its dissipation in the circumstellar disk. Figure 10 shows that the magnetic field is well coupled with the neutral gas in the outer disk region (rc>10–100 AU) where a relatively high ionization rate is realized owing to a relatively low gas density. Thus, the angular momentum in such region is effectively transferred by the magnetic braking and protostellar outflow, and the gas can flow into the inner disk region. On the other hand, the magnetic field is not well-coupled with the neutral gas in the inner disk region (rc < 10–100 AU) where the gas density is high and a considerably low ionization rate is realized. Thus, the angular momentum transfer due to the magnetic effects is not so effective, and the gas flowing from the outer disk region accumulates in the inner disk region around the boundary between the magnetically active and inactive region at rc ∼ 5–50 AU (see Figure 10). In that region, the surface density continues to increase and fragmentation tends to occur. In summary, magnetic dissipation is essential in inducing recurrent fragmentation (or planet formation) in the circumstellar disk.
In this study, we have considered only Ohmic dissipation as the dissipation mechanism of the magnetic field. This is because Ohmic dissipation is expected to be the most effective mechanism for magnetic field dissipation in a high density region where most of the magnetic flux leakage occurs. However, ambipolar diffusion may also contribute to the magnetic flux leakage in some intermediate density region. Recent studies have shown that Ohmic dissipation is more effective than ambipolar diffusion in the range of n ≳ 1012 cm−3, while ambipolar diffusion dominates in the range of 1011 cm−3 ≲ n ≲ 1012 cm−3 (Tassis & Mouschovias 2007a, 2007b, 2007c; Kunz & Mouschovias 2010). In the range of n ≲ 1011 cm−3 the magnetic field is well-coupled with the neutral gas in a magnetically super critical cloud (Nakano et al. 2002; Kunz & Mouschovias 2010). Thus, it might be important to study how the inclusion of ambipolar diffusion would change the formation and evolution of the circumstellar disk, through the possible contribution in the limited range of density.
With strong coupling approximation, the induction equation including the ambipolar diffusion can be written as
where ρn, ρi, and γ are the densities of neutral gas and charged particles, and a drag coefficient between charged particles and neutrals, respectively (for details, see, e.g., Shu 1992). The third term of the right-hand side of Equation (27) can be regarded as a nonlinear diffusion term by the ambipolar diffusion. When we adopt an approximate relation between the neutral and charged particle densities, ρi = Cρ1/2n, where C is a constant, the effective diffusion coefficient of the ambipolar diffusion (ηad) can be roughly estimated as
In a realistic setting, Kunz & Mouschovias (2010) showed that the diffusion coefficient of the ambipolar diffusion (ηad) is 10–100 times larger than that of the Ohmic dissipation (ηOD) in the range of 1011 cm−3 ≲ n ≲ 1012 cm−3. Strictly speaking, to include the effect of ambipolar diffusion, we should solve Equation (27) together with the equations determining charged particle density. Note that the realistic evolution of charged particle density sensitively depends on the total surface area of dust grains, since the recombination of charged particles on the grain surface is very efficient. However, there is considerable uncertainty in the evolution of dust grain properties, such as the size distribution, in the protostellar collapse process. Thus, our limited knowledge of grain properties make our accurate treatment of magnetic field dissipation impractical. This is also the reason why we adopted a parametric description of the Ohmic diffusion coefficient in our study of magnetic field dissipation (Machida et al. 2007). In this paper, we take the same approach for the effect of ambipolar diffusion. To roughly estimate the effect of ambipolar diffusion, we calculate the evolution of the circumstellar disk with an artificially larger resistivity. In Equation (3), we replace ηOD by cη ηOD as follows:
We adopt cη = 0 (ideal MHD model), 1 (fiducial model), 10, 100.
As a first test, we constructed a non-rotating BE sphere with a central density of n ≃ 103 cm−3 immersed in the uniform magnetic field of Bz,0 = 5 × 10⁻⁵ G. Then, we calculated the collapse of this cloud with different cη. Figure 15 shows the evolution of the magnetic field as a function of the central number density. The magnetic field in each model tracks the same path in the range of n ≲ 109 cm−3, while the magnetic field for the model with cη = 100 begins to depart from that for the ideal MHD model (cη = 0) at n ≃ 109 cm−3. The figure indicates that the non-ideal MHD effect becomes important at the lower density with the larger cη. When the central number density reaches n = 1014 cm−3, the magnetic field strengths for the model with cη = 0 and 100 are Bz = 7 G and 0.03 G, respectively. Thus, the ideal MHD model has about a 100 times stronger magnetic field than the model with cη = 100 at this epoch. At the same epoch, models with cη = 1 and 10 have Bz = 0.01 G and 0.06 G of magnetic field, respectively. Thus, the difference between the magnetic field strength between cη = 1 and 100 (10) is only a factor of three (2).
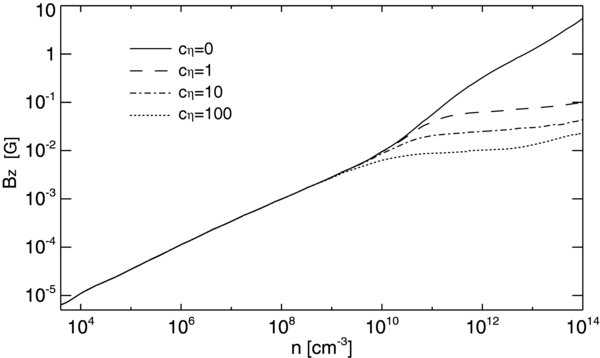
Figure 15. Magnetic flux density against central number density for models with cη = 0 (ideal MHD model), 1, 10, and 100.
Download figure:
Standard image High-resolution imageNext, we calculated the evolution of the circumstellar disk with the initial condition the same as model A03 but with different resistivities cη = 0, 10, and 100. The density distribution on the equatorial plane after the circumstellar disk formation for models with cη = 0 and cη = 100 are plotted in Figure 16. As seen in this figure, fragmentation does not occur in the ideal MHD model (cη = 0) until the end of the calculation, while, for the model with cη = 100, fragmentation occurs at tc ≃ 2550 yr after the protostar formation and two clumps appear in the circumstellar disk. For the model with cη = 10, the circumstellar disk also shows fragmentation and subsequent planet formation. Note that we have terminated the calculation with larger resistivity earlier, since it takes formidable time to follow the evolution with larger resistivity with our time-explicit integration scheme for diffusion term (Machida et al. 2007). Thus, we cannot directly compare the results among models with different resistivities. However, Figure 16 indicates that fragmentation occurs even when the magnetic field dissipates in a relatively low-density region. Therefore, we expect that recurrent planet formation and intermittent outflow can occur even with a more realistic treatment of the ambipolar diffusion.

Figure 16. Density distribution and velocity vectors (arrows) on the equatorial plane for models cη = 0 (ideal MHD; left panel) and 100 (right panel). The elapsed time after the protostar formation tc is described in the upper part of each panel.
Download figure:
Standard image High-resolution image4.4. Comparison with Previous Studies
Only a few studies focused on the formation and evolution of the circumstellar disk from the prestellar core stage. Walch et al. (2009a) and Vorobyov & Basu (2010) investigated the circumstellar disk in unmagnetized clouds, and found that massive circumstellar disks formed at the early main accretion phase tend to show fragmentation. Machida et al. (2010a) and Bate (2010) pointed out that the disk forms before the protostar formation, and the circumstellar disk is inevitably more massive than the protostar in the early accretion phase. This is because the circumstellar disk originated from the first adiabatic core formed in the gas-collapsing phase before the protostar formation (Bate 1998; Machida et al. 2010a). Such a massive circumstellar disk is prone to show fragmentation. These studies indicate the possibility of the formation of a substellar- or planet-mass object in the unmagnetized circumstellar disk by gravitational instability.
In the magnetized cloud core, only Vorobyov & Basu (2005, 2006) investigated the formation and evolution of the circumstellar disk using two-dimensional simulations. Although they adopted the magnetic evolution in an approximate way instead of solving the induction equation, they presented several interesting results. They pointed out that fragmentation and planet formation is possible even in the magnetized circumstellar disk. They also showed that gravitational instability or fragments temporarily amplify the mass accretion rate onto the protostar that may account for the FU Orionis outbursts. There are slight quantitative differences between Vorobyov & Basu (2005, 2006) and our results, because we calculated the circumstellar disk with a realistic process of the magnetic dissipation in three dimensions. However, our results are qualitatively the same as their results. This is because the circumstellar disk always experiences a gravitationally unstable phase after protostar formation. Inutsuka et al. (2010) showed that, even in the magnetized cloud core, the circumstellar disk is more massive than the protostar and becomes gravitationally unstable. Such a disk tends to show fragmentation in the early accretion phase. Even when fragmentation does not occur in the early accretion phase, such a massive disk is expected to show fragmentation in the later accretion or subsequent phase. Thus, we expect that the planet formation due to the gravitational instability is common in the star formation process.
5. SUMMARY
To investigate the properties of the circumstellar disk during the main accretion phase, we calculated the formation and evolution of the circumstellar disk and protostellar outflow in a magnetized collapsing cloud core from the prestellar core stage using a three-dimensional nested-grid simulation that covers both the whole region of a nascent molecular cloud core and sub-AU structure. We constructed two models with a parameter for the initial stability of the cloud core (the ratio of thermal energy to gravitational energy) or total mass of the cloud core, in which the rotation rate and magnetic field strength were fixed, and calculated the evolution of the circumstellar disk about ∼104 yr after protostar formation. The different initial stabilities affect the rate of mass accretion onto the circumstellar disk; that is, a relatively massive disk appears with a high mass accretion rate in a relatively thermally unstable cloud core. We obtained the following results from these calculations.
- 1.Recurrent Planet Formation in the Circumstellar Disk. The circumstellar disk formed in a relatively unstable cloud core is considerably massive because of the high rate of mass accretion onto the disk and it is in a highly gravitationally unstable state. Thus, fragmentation occurs and substellar-mass objects appear in the circumstellar disk. The substellar-mass objects lose their orbital angular momenta by gravitational interaction with the massive circumstellar disk and finally fall onto the protostar ∼1000 yr after their formation. After those objects fall, the circumstellar disk increases its mass by mass accretion from the nascent cloud core and again shows fragmentation and subsequent falling of fragments onto the protostar.Fragmentation and falling are repeated in the main accretion phase. The mass of fragments never reaches the hydrogen-burning limit of ∼0.08 M☉ because the circumstellar disk self-regulates its mass during this recurrent planet formation process, that is, the circumstellar disk induces fragmentation and loses its mass when fragments fall onto the protostar before it becomes very massive. Thus, fragments formed in the main accretion phase hardly exceed the planet or brown dwarf mass. It is expected that this recurrent planet formation process continues as long as the disk accretes mass at the high rate. However, mass accretion onto the disk decreases with time. Thus, the final generation of fragments formed in the outer disk region just before the mass accretion stops (or significantly decreases) may survive to become long-lived planets or brown dwarfs with long orbital periods, as recently observed (Kalas et al. 2008; Marois et al. 2008; Thalmann et al. 2009).
- 2.Highly Time-Variable Mass Accretion. In the main accretion phase, both models (relatively stable and unstable models) show non-steady mass accretion onto the central protostar. In a relatively stable cloud core that shows no fragmentation, the rate of mass accretion onto the protostar fluctuates in the range of ∼10−6 to ∼10−4 M☉ yr−1 with a period of ∼100 yr. Thus, highly time-variable mass accretion is seen in this model. The magnitude of the mass accretion rate almost corresponds to the theoretical prediction. The cycle of variation of the mass accretion rate (or the accretion luminosity) corresponds to the orbital period of the location of clear spiral arms that effectively transfer the angular momentum outward and promote protostellar mass accretion. The spiral arms only appear in the inner disk region where a considerably weak field is realized owing to the effective Ohmic dissipation, and the angular momentum is not effectively transferred by the magnetic effect. As a result, the excess angular momentum causes the mass to accumulate in the inner disk region and increases the non-axisymmetric perturbation that promotes the mass accretion onto the protostar.Instead, in the outer disk region where the magnetic field is well-coupled with neutrals, the non-asymmetric perturbation hardly grows because the angular momentum is effectively transferred by the magnetic effect. In summary, because the spiral structure induces the time-variable protostellar accretion, the typical period of the variation of the accretion luminosity corresponds to the orbital extent of the magnetically inactive zone where the spiral patterns appear. Thus, the time variation or the cycle of the accretion luminosity is related to the magnetic dissipation process that is connected to the magnetic flux problem. Although we adopted a very realistic value of the magnetic resistivity and ionization degree, we may also deduce them by observations of the luminosity variation of Class 0 and I objects. In addition, the time variation of the accretion luminosity caused by spiral patterns may explain the luminosity dispersion of Class 0 and I objects over 2–3 orders of magnitude (Evans et al. 2009).
- 3.Episodic Mass Accretion. Episodic mass accretion is seen in a relatively unstable cloud core. Fragmentation occurs and substellar-mass objects repeatedly appear in the circumstellar disk formed in an unstable cloud core. The substellar-mass objects disturb the circumstellar disk and induce a strong episodic brightening of the protostar. The mass accretion rate is considerably low, ≲10−6 M☉ yr−1, when the substellar-mass objects orbit in a region sufficiently far (≫5 AU) from the protostar, while the rate increases to ≳10−5 M☉ as the substellar-mass objects approach (≲5 AU) the protostar. Thus, during the main accretion phase, the protostar shows two distinct phases of mass accretion: quiescent and active mass accretion phases, as seen in Vorobyov & Basu (2006). The protostar increases its luminosity (≳1 L☉) by significant mass accretion in the active phase that lasts only for ∼100 yr, while it dims (
 ) in the quiescent phase that lasts for ≳1000 yr. Recent observations support episodic mass accretion to solve the luminosity problem (Enoch et al. 2009b; Dunham et al. 2010). In addition, FU-Ori-type outbursts may also be related to the episodic accretion caused by orbital motion and falling of the substellar-mass objects. However, we need a higher spatial resolution to associate them with actual observations.
 - 4.Intermittent Protostellar Outflows. Both models show the outflow driven by the circumstellar disk. The steady outflow that lasts for >104 yr appears in a relatively stable cloud core, while the non-steady outflow appears in a relatively unstable cloud core. In a relatively stable cloud core, spiral arms that promote mass accretion onto the protostar appear in the inner disk region where magnetic dissipation is effective and no outflow appears, while the outflow is driven by the outer disk region where an almost axisymmetric structure remains. As a result, time-variable mass accretion is caused by the inner disk region, while outflow is steadily driven by the stable outer disk region.On the other hand, in a relatively unstable cloud core, the outflow driven by the circumstellar disk shows a strong time variability because substellar-mass objects disturb magnetic field lines in the whole circumstellar disk. As a result, the episodic (or intermittent) outflow appears with episodic mass accretion. Thus, intermittent outflow may be proof of the existence of planets or substellar-mass objects in the circumstellar disk. In addition, variable periods of the outflow synchronize well with the orbital period of substellar-mass objects. Thus, we may be able to predict the existence of a planet and its orbital period with a detailed observation of the trail of the protostellar outflow. However, further long-term calculations are necessary to investigate outflow propagation in the interstellar medium.

Numerical computations were carried out on NEC SX-9 at Center for Computational Astrophysics, CfCA, of National Astronomical Observatory of Japan, and NEC SX-8 at the Yukawa Institute Computer Facility. This work was supported by Grants-in-Aid from MEXT (20540238, 21740136).