


ABSTRACT
We use a stochastic approach in order to investigate the production and evolution of aerosols in Titan's atmosphere. The simulation initiates from the benzene molecules observed in the thermosphere and follows their evolution to larger aromatic structures through reaction with gas-phase radical species. Aromatics are allowed to collide and provide the first primary particles, which further grow to aggregates through coagulation. We also consider for the first time the contribution of heterogenous processes at the surface of the particles, which are described by the deposition of the formed aromatic structures on the surface of the particles, and also through the chemical reaction with radical species. Our results demonstrate that the evolution of aerosols in terms of size, shape, and density is a result of competing processes between surface growth, coagulation, and sedimentation. Furthermore, our simulations clearly demonstrate the presence of a spherical growth region in the upper atmosphere followed by a transition to an aggregate growth region below. The transition altitude ranges between 500 and 600 km based on the parameters of the simulation.
Export citation and abstract BibTeX RIS
1. INTRODUCTION
The prominent aerosol layers on Titan result from the complex photochemistry in the satellite's atmosphere. Dissociation of the main atmospheric gas composition, dominantly by energetic photons and photoelectrons, initiates the growth of organic molecules, the increasing complexity of which eventually yields the observed aerosols. These particles interact strongly with the solar radiation field, as demonstrated by the wavelength variation of Titan's geometric albedo and by the observed stratospheric temperature increase concurrent with the main aerosol layer. But the most prominent aerosol signature is the almost featureless appearance of Titan's disk in visible wavelengths, due to the screening of the satellite's surface by the aerosols.
The size and shape of the aerosols initially perplexed researchers; Voyager and Pioneer measurements of polarized scattered light from altitudes probing the main haze layer (below 300 km) suggested that the particles have an average size of 0.15 μm (Tomasko & Smith 1982; West et al. 1983). On the other hand, the observed high-phase angle scattering of the main haze layer required particles of larger size, close to 0.5 μm (Rages et al. 1983). In order to reconcile the two different sizes, West & Smith (1991) suggested that the aerosols in the main haze layer are aggregates composed of small spherical particles (the primary particles), with the latter responsible for the observed high degree of polarization and the former providing the scattering at visible wavelengths. Theoretical calculations for the optical properties of aggregate particles are consistent with the observed geometric albedo of Titan's disk, providing further support to this scenario (Rannou et al. 1995). The aggregates in these calculations have fractal properties characterized by a fractal dimension of two (see Rannou et al. 2003 and references therein). The formation of aggregate particles is considered to take place outside the aerosol production region. Since the main aerosol layer is in the stratosphere most of the previous aerosol models assume a production region at a higher altitude, usually at 400 km (right above the detached haze layer observed at 350 km in Voyager images).
The DISR instrument of the Cassini/Huygens mission provided the first insitu observations of Titan's aerosols. The retrieved particle phase functions verified their strong forward scattering, which indisputably prove their aggregate structure (Tomasko et al. 2008). In addition, observations by the Cassini UVIS and ISS instruments reveal the presence of a detached haze layer at ∼520 km, while aerosols were detected all the way to the thermosphere (Liang et al. 2007). The optical properties of the aerosols below the detached layer corresponded to aggregate particles, as observed by DISR in the stratosphere, but above this altitude region the aerosol optical properties were characteristic of spherical particles. This led Lavvas et al. (2009) to suggest that the detached haze layer observed by the Cassini instruments corresponds to a transition region where the particle growth changes from spherical- to aggregate-type.
The presence of aerosols above 500 km suggests that the production must be at a higher altitude. Based on energy deposition considerations, the production of aerosols must initiate in the thermosphere since in this region photons able to dissociate N2 and CH4 deposit their energy, while lower energy photons penetrate deeper in the atmosphere below the detached haze layer (Lavvas et al. 2009, 2010). The thermospheric production argument is further supported by the CAPS/ELS detection of large negative ions close to 1000 km with masses between 1000 and 10,000 amu, which are representative of aerosols (Coates et al. 2007), but also by the surprisingly rich inventory of hydrocarbon and nitrogen-containing species detected by the Ion and Neutral Mass Spectrometer (INMS) in the thermosphere as cations (Vuitton et al. 2007). The INMS detection was limited up to masses of 100 amu, but the lower mass resolution observations of CAPS/IBS detected positive ions up to about 300 amu (Waite et al. 2007; Crary et al. 2010). These observations reveal a continuous growth of the chemical species towards larger masses, which eventually blend with the aerosols detected in the negative mode. This is a clear indication both for the photochemical production of Titan's aerosols and for their thermospheric origin.
Our understanding for the pathways leading to the observed aerosols is still at a preliminary stage. With the multitude of species observed in the thermosphere by INMS and the almost continuous distribution of masses in CAPS/IBS spectra it is reasonable to expect that aerosols are not a result of a single chemical process, but a result of multiple processes acting simultaneously and covering the total "phase space" of possible chemical products, based on the abundance of the gaseous species and their reactivity. Nevertheless, specific families of possible pathways can be identified based on the structure and composition of the reactant species. On these premises, Lebonnois et al. (2002), Wilson & Atreya (2003), and Lavvas et al. (2008a, 2008b) suggested specific aerosol production pathways from the gas-phase background corresponding to pure hydrocarbon products, pure nitrile products, products of aromatic structure, and products that result from hydrocarbon and nitrile species reactions. The latest calculations show that some of these pathways have an important contribution in the aerosol production of the upper atmosphere. Since we do not yet know precisely all the mechanisms that lead from the gas-phase chemistry to the aerosols, we need to make some assumptions in our calculations. Here we consider the pathways related to the growth of polycyclic aromatic compounds (PACs). This is supported by the large abundance of benzene, the simplest aromatic hydrocarbon, observed in Titan's thermosphere (Waite et al. 2007; Vuitton et al. 2008).
Apart from the production region, our understanding for the particle shape evolution is also preliminary. There is a common assumption among microphysical models that once the particles are formed from the background photochemistry, they cease to interact with the gas-phase molecules. Yet, recent investigations related to soot formation in flames has shown that under specific conditions the chemistry at the surface of the soot particles can significantly affect their size and structure (Mitchell & Frenklach 2003; Morgan et al. 2007). Although these experiments correspond to conditions very far from those present in Titan's atmosphere, we investigate here the possible role of surface chemistry in Titan's aerosols. The neutral chemistry in Titan's atmosphere is mainly driven by radical addition to closed cell molecules. Radicals, formed by the photolysis of closed cell molecules, are very reactive since they have energies larger than most of the potential barriers present in the reaction of two close cell molecules. Furthermore, radicals originating from highly unsaturated molecules (e.g., alkynes such as acetylene) are more reactive than radicals of saturated molecules (e.g., alkanes such as ethane). Based on photochemical models (e.g., Lavvas et al. 2008b), a large number of radicals are available in Titan's atmosphere. Here, we investigate the interaction of some of these radicals with the aerosol surface.
In our investigation we use a stochastic approach to follow the evolution of particles through coagulation and surface chemistry, by simulating all growth stages from benzene molecules to PACs, to primary particles, and eventually aggregates. The stochastic particle model is able to simulate a multivariate particle population (Balthasar & Kraft 2003). A high dimensional state space can be used to describe the particles and consequently a detailed chemical and structural information of each particle can be stored (Celnik et al. 2009; Totton et al. 2010). Consequently, the rounding of the particles can be simulated on a very detailed level (Sander et al. 2011). The simulation speed is increased by taking advantage of the majorant rate approach (Eibeck & Wagner 2000; Goodson & Kraft 2002) and the linear process deferment algorithm developed by Patterson et al. (2006). A similar model has already been successfully applied to model the sintering of silica nanoparticles (Sander et al. 2009b) and the formation of soot in flames (Sander et al. 2011). The model is described in detail in the following section. Our results for Titan's aerosols suggest that the surface chemistry is an important parameter in the growth of the particles and affects their size, shape, and density.
2. MODEL DESCRIPTION
In order to simulate the coagulation of the particles in tandem with the impact of surface chemistry we use a stochastic approach that allows tracking the evolution of a particle assemble, from the initial chemical species to the final aggregate structures (Sander et al. 2009a, 2009b, 2010). The starting point of the simulation is the benzene molecules, which are detected at high abundance in Titan's thermosphere (Vuitton et al. 2008). These are allowed to grow to PACs through chemical reaction with radicals. There are two types of particles considered in the calculations: primary particles that are spherical and aggregates of primary particles. Coagulation among primary particles provides aggregates, while surface chemistry can transform an aggregate to a larger primary particle. Different aspects of the calculations are discussed in detail below.
2.1. Stages of Particle Growth
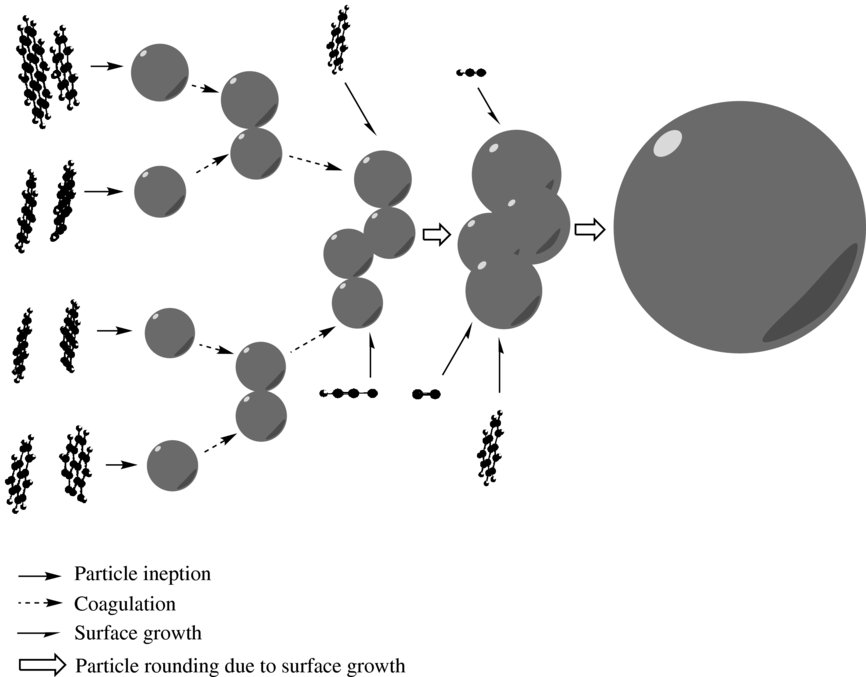
The different processes included in the model are summarized in Figure 1. We consider the collision of two PACs, leading to an adduct, to create a spherical primary particle with the mass of the two colliding PACs. The collision of two PACs is not always successful and we use an empirical formula that depends on the mass of the colliding PACs to describe the sticking efficiency (Appel et al. 2000; Raj et al. 2009). We assume a typical mass density of 1 g cm−3 for the primary particles. The coagulation of two primary particles provides an aggregate. The two colliding primary particles are in point contact directly after the coagulation event, but the neck at the touching point disappears and the aggregate gets rounder due to surface growth from the interaction with gas-phase molecules and PAC deposition. The aggregates can further grow by coagulation with other primary particles or aggregates, and by surface growth.

Figure 1. Processes included in the model. In this example, the PACs provide primary particles which then coagulate to form an aggregate. Eventually the surface chemistry acting on the aggregate provides a new, larger primary particle.
Download figure:
Standard image High-resolution imageAn aggregate, P = P(p1, p2, ..., pn, S), composed of n primary particles is represented by a matrix S and primary particles pi, which in turn are characterized by a volume vi,

The quadratic and symmetric matrix S stores the common surface of each pair of two neighboring primary particles

The dimension of S is the number of primary particles n present in the particle. The matrix element Sa,b is the common surface of primary particles pa and pb if they are neighboring and is zero if the primaries are not neighbors. We use S to calculate the coalescence level C(a, b) between each pair of neighboring primary particles, described below.
2.2. Particle Rounding
Two primary particles, pa and pb, are in point contact directly after a collision. The initial common surface Sa,b and volume Va,b of these two connected primary particles is the sum of the individual surfaces and volumes. The particles get more spherical due to surface growth and can coalesce to one single primary particle. We calculate the coalescence level, C(a, b), between two touching primaries pa and pb from (Sander et al. 2011)

where  is the spherical surface (the surface of a sphere with the same volume as the two primary particles) and the matrix element Sa,b is the common surface of the two neighboring primary particles pa and pb. C(a, b) is zero directly after a coagulation event for two same volume particles, and is greater than zero if pa and pb have a different volume (Figure 2). The mass deposited at the common surface of the two primary particles in contact controls their volume change, ΔVa,b, assuming a mass density of 1 g cm−3. The corresponding increase in surface area, ΔSa,b, is calculated from (Patterson & Kraft 2007)

where the radius of curvature, Rc, is the radius of a sphere with the volume of the two connected primary particles. A smoothing factor of s = 2 implies that the common surface Sa,b increases as if the two primary particles would be spherical (Patterson & Kraft 2007). Smaller values of s lead to faster rounding of the particles. The coalescence level C(a, b) increases due to surface growth and two individual primary particles are replaced by one primary particle if C(a, b) is larger than 0.99. We assume that the rounding of the primary particles is independent from each other, which means that a coalescence event between primary particles pa and pb does not affect the coalescence level between primary particles pa and pc. In order to ensure this independence, the common surface Sa,b of pa and pc is modified in such a way that their coalescence level does not change due to the coalescence of primary particles pa and pb (Sander et al. 2011).

Figure 2. Coalescence level C(1, 2) of two neighboring primary particles p1 and p2 as a function of the volume added relative to the sum of initial volume of the two primaries. Three different initial volume relations are compared.
Download figure:
Standard image High-resolution image2.3. Fractal Dimension
The particle shape is an important property for their physical properties (settling velocity, optical properties) and can be described by a fractal dimension, Df, that correlates the number of primary particles, n, with their distribution around the center of mass of the aerosol:

where Rg is the radius of gyration of the aerosol, rp is the average radius of the primary particles, and kf is a proportionality constant of unit order (here we assume kf = 1). The radius of gyration is defined as

where mT is the total mass of the aggregate and mi is the mass of primary particle i whose center is at a distance ri from the center of mass.
2.4. Growth Rates
We use the Brownian kernel for the calculation of the coagulation rates. Depending on the pressure conditions, the kernel approaches the slip-flow (high pressure), Ksf, and free molecular (low pressure), Kfm, limits. For intermediate pressures the kernel in the transition regime, Ktr, is calculated as the harmonic mean of the two limiting cases (Pratsinis 1988):

with A and B the two colliding members that can be particles: aerosols and PACs. For collision between PACs the sticking efficiency is calculated based on the mass and diameter of the smaller PAC (Raj et al. 2009), while for collisions among particles we take into account the possible charge at the particles for the sticking efficiency (Lavvas et al. 2010).
For primary particle inception by two PACs and for addition of PACs on particles (PAC deposition), we calculate the collision diameter of the PACs from

where  for a single aromatic ring and nc is the number of carbon atoms in the PAC (Frenklach & Wang 1994).
For coagulation between aggregates, or primary particles and aggregates, the collision diameter of the aggregate, dpartc, is calculated from

where V is the aggregate volume and Apart is its surface. The aggregate volume is calculated as the sum of the individual primary particles volume. The surface area of the aggregate incorporates the average coalescence level of the individual primary particles and is approximated by

where Asph is the spherical surface and Cavg is the average coalescence level of the aggregate. This formula interpolates the surface between a coalescence level of zero, where the surface area is the sum of the individual primary particles, and a coalescence level of one, where the particle is spherical and consequently the surface area is equal to that of a sphere. Two colliding aggregates Pi and Pj do not change shape, but stick together creating a bigger particle, Pk, containing the primary particles of the two colliding particles:

A primary particle pa from particle Pi and a particle pb from particle Pj are assumed to be the touching point of the two colliding particles. The matrix S of the resulting larger aerosol incorporates the two primaries pa and pb in contact:

For the interaction of gas-phase species with the surface of particles, we calculate the growth rate from

where Vgth and Ng are the thermal velocity and the number density of the gas species, respectively, as is its sticking efficiency, and Sp is the surface area of the particle. For the growth of individual PACs, we follow the total number of C atoms added assuming the same reaction rate as for addition of the chemical species on a benzene molecule:

The chemical reaction rate used for the last reaction depends on the gas species used in the calculations. These are discussed below in the application of the model to Titan's conditions.
2.5. Particle Sedimentation
The stochastic approach tracks the time evolution of an initial sampling volume. This volume corresponds to both PACs (including the initial benzene molecules) and primary particles/aerosols formed as time evolves. As the simulation evolves, the volume sediments with a characteristic velocity that depends on the size and structure of the volume components. For spherical and aggregate particles, we calculate the sedimentation velocity with the method described in Lavvas et al. (2010). For a PAC, we calculate the settling velocity assuming the same mass spherical particle. The volume moves with the mass-weighted sedimentation velocity of its components and at each altitude the atmospheric conditions reflect those of Titan's atmosphere at the same altitude.
3. APPLICATION TO TITAN
At the low-temperature conditions of Titan's atmosphere, reactions among closed cell molecules are inhibited by high energy barriers, and chemical growth proceeds through reactions with radical species. In our calculations, we consider the C2H, CN, and HCCN radical species. Although these are just a few of the anticipated radicals in Titan's atmosphere (Figure 3), we start our calculations with these three for two main reasons: based on theoretical calculations the first two are expected to have a major role in the growth of PACs, while laboratory experiments suggest that the last one has a dominant role in the aerosol production and evolution.

Figure 3. Radical abundances in Titan's atmosphere from the Lavvas et al. (2008b) photochemical model.
Download figure:
Standard image High-resolution image3.1. Gas Species
The growth of benzene to larger aromatic structures is known to proceed in combustion chemistry and in the interstellar medium (ISM) were both polycyclic aromatic hydrocarbons and nitrogen-containing polyaromatics are observed (Allamandola et al. 1989; Hudgins et al. 2005). The mechanisms involved at these two extreme conditions are different. At high temperatures PACs form through the acetylene addition mechanisms, while at the low-temperature conditions of the ISM aromatic structures grow through ion–molecule reactions (see Bauschlicher & Ricca 2000 and references therein). Although the low-temperature conditions in Titan's atmosphere do not favor the acetylene addition mechanism, the role of ion–molecule reactions could be important as demonstrated for the formation of benzene in Titan's thermosphere (Vuitton et al. 2008). On the other hand though, the contribution of ions will be constrained over a narrow altitude region.
Recent laboratory measurements show that the addition of C2H radicals on benzene is barrierless and proceeds readily at the low-temperature conditions of Titan's atmosphere (Goulay & Leone 2006). Furthermore, theoretical calculations suggest that multiple ethynyl additions to a benzene ring lead to the formation of larger aromatic structures (Mebel et al. 2008). The same is expected for CN addition leading to heterogeneous aromatic structures (Landera & Mebel 2010). Ion chemistry might contribute to the production of aromatic structures from benzene, but the large abundance of the C2H and CN radicals in Titan's upper atmosphere, combined with their high reaction rate with benzene molecules, suggests that any further growth will be dominated by neutral reactions. Nevertheless, the contribution of ion chemistry in the overall aerosol growth should be investigated in the future.
The choice of HCCN is based on laboratory experiments. Recently, Imanaka & Smith (2010) performed laboratory experiments for the photolytic production of Titan aerosol analogs (tholins). In their apparatus, they irradiated an N2/CH4 gas mixture using tunable vacuum ultraviolet radiation at 60 and 82.5 nm, and analyzed both the composition of the resulting gas mixture and the composition of the solid residue produced. The mass spectra of the solid products clearly show the incorporation of nitrogen in the tholins, while the corresponding gas-phase spectra demonstrate a lack of nitrogen-containing species. This leads Imanaka & Smith (2010) to suggest that there is a rapid scavenging of nitrogen by the solid phase. Further analysis of the measured tholin spectra at the two wavelengths of the measurements strongly suggests that the incorporation of nitrogen to the solid phase takes place through mass units corresponding to the HCCN structure. The reaction of HCCN with benzene is not measured yet, but given the high reactivity of this diradical it should also proceed readily.
3.2. Results
The atmospheric gas composition assumed in the calculations is taken from the photochemical model of Lavvas et al. (2008b), while for benzene we assume a Gaussian production profile located at 1000 km with a width of 12 km and a column production rate of 1.3 × 107 cm−2 s−1 referred to the surface (Vuitton et al. 2008). The simulation provides a benzene density of 2.5 × 106 cm−3 at the top of our simulated atmosphere, consistent with the INMS observations (Waite et al. 2007; Vuitton et al. 2008). The benzene molecules grow to larger PACs through reaction with C2H, CN, and HCCN (Figure 3). We do not keep track of the structure of the formed PACs, we only count the number of C and N atoms in each structure assuming that C and N are equivalent (12 amu). In order to further simplify the calculations, we do not keep track of the H atoms either, since they will have a minor contribution in the overall mass of the particles. Thus, our calculated structures provide a lower limit on the resulting aerosol mass flux.
The main parameters for the calculations are summarized in Table 1. The chemical reaction rate of radicals with PACs is taken the same as the rate of C2H addition of benzene molecules (this is a lower limit since the reaction of C2H with larger aromatic structures should proceed with a faster rate), while the sticking efficiency of radicals at the surface of primary particles and aerosols is one (this is different from the sticking efficiency between PACs). The surface smoothing factor, s, on the other hand is not well constrained. For a spherical particle, an isotropic mass addition results to a surface geometry factor of two. For aggregates, the anisotropy of the system forces the geometry factor to a smaller value due to the presence of the contact points. We first discuss the overall picture of the model results for the case of s = 0.75 and afterward we present a sensitivity analysis on this parameter.
Table 1. Model Parameters
| Parameter | Value | |
|---|---|---|
| Smoothing parameter | s | 0.5–1.5 |
| Surface reaction rate | ks | 3.0 × 10⁻¹⁰ cm3 s−1 |
| Charge | q | 15 e/μm |
| Radical sticking efficiency | as | 1 |
Download table as: ASCIITypeset image
3.2.1. Nominal Case
Depending on the dominant processes for the production and growth of the average particle mass and shape, we can separate the results into three main altitude regions.
Region I (1000–650 km): PAC growth and deposition. The benzene molecules produced close to 1000 km react with the radicals providing the first PACs. The average number of carbon atoms in the PACs is six, close to the production region (corresponding to benzene molecules), while it increases as the sampling volume moves to lower altitudes, reaching values of ∼40 atoms at 520 km (Figure 4). The density of PACs remains high in the upper atmosphere and only a small fraction of them provides primary particles (Figure 4). This is due to the small size of the aromatics that results in not only a low collision cross section but also a low sticking efficiency (Raj et al. 2009).

Figure 4. Overview of main model results for the particle density, size, and shape. Left panel: long-dashed and dotted lines present the average collisional and equivalent sphere diameters. The short-dashed and solid lines are the PAC and particle densities (either primary particles or aerosols), respectively, and the dash-triple-dotted and dash-dotted lines are the average number of C atoms in the PACs and in the particles, respectively. Right panel: the average fractal dimension of the particles (solid line) and the mass flux (dashed line).
Download figure:
Standard image High-resolution imageAssuming that only coagulation affects the shape and size of the produced particles, we should anticipate the formation of aggregates as the generated primary particles fall out of the production region and coagulate with each other. This is reproduced by the model results, as demonstrated by the decrease of the particle fractal dimension, Df, near 900 km (Figure 4). On the other hand, Df increases again shortly below 900 km and remains close to 3 for altitudes down to ∼650 km. This is a result of the particle surface growth. As shown in Figure 5, the rates for particle coagulation and PAC deposition are similar in this altitude region, thus, the aggregation of the primary particles is accompanied by the deposition of extra mass on the aerosol surface that keeps the resulting new particles spherical. The surface growth by direct reaction of the particle's surface with the gas-phase radicals also takes place but has a minor contribution (Figure 5). Hence, the PACs formed in the atmosphere have a dominant role in preserving the spherical shape of the aerosols in the region between the benzene production altitude and ∼650 km. The low atmospheric density in this region allows particles to have a high sedimentation velocity and results in a slow increase of the particle radius in region I. The average collision diameter of the particles ranges from ∼1 nm at 850 km to about 1.7 nm at 650 km.

Figure 5. Comparison of different rates affecting the growth and shape of particles: benzene production (dash-dotted line), particle coagulation (solid line), PAC deposition (dashed line), and chemical reaction of radicals on the particle surface (dash-triple-dotted line).
Download figure:
Standard image High-resolution imageThus, the dominant process in region I is the growth of benzene molecules to larger PACs through radical reactions. Simultaneously, the deposition of the aromatic structures on the limited number of aerosols formed keeps the shape of the particles quasi-spherical.
Region II (650–500 km): Particle aggregation. As the average surface of the produced aerosols increases, the loss of PACs due to their deposition on the aerosol surface reduces the abundance of aromatics. This reduction becomes prominent below 650 km, with the number density of aromatics decreasing from ∼105 cm−3 at this altitude to 1 cm−3 close to 500 km. As a result, the aggregation starts to dominate over the surface smoothing and the particle fractal dimension diverges once again from the spherical limit reaching values close to 2 at 500 km (Figure 4). The non-spherical shape of the aerosols increases their surface area and collision cross section, therefore, enhances the loss of PACs on their surface and also their coagulation rate. This leads to a rapid growth of the average particle size along with a decrease of the aerosol density. The average collision diameter of the particles increases to 160 nm at 500 km, while the corresponding aerosol density decreases from ∼2 × 105 cm−3 to ∼8 × 103 cm−3 between 650 and 500 km.
Another important process affecting the results in this altitude region is the decrease of the average particle settling velocity. Due to the increase of the atmospheric density, the particles fall slower relative to the sedimentation velocity at higher altitudes. Furthermore, due to their aggregate structure, aerosols at these pressure conditions are falling with a sedimentation velocity close to the sedimentation velocity of the primary particles composing them, which is smaller than the corresponding velocity of the same mass spherical particle. Therefore, aerosols spend more time in this region, which also contributes to their rapid growth in such a narrow altitude range.
Hence, the reduced surface growth in region II allows for a transition in the aerosols growth mode from spherical to aggregates with a fractal dimension close to two, while the reduced sedimentation velocity of the aggregates forces the transition to occur over this narrow region.
Region III (below 500 km): Surface chemistry. At even lower altitudes, the model shows an increase of the particle fractal dimension. This results from the surface growth of the aerosols from direct reaction with gas-phase radicals. As demonstrated in Figure 5, the reaction rate of radicals at the surface of aerosols becomes increasingly more important below 600 km and eventually dominates over the coagulation rate. The main radical providing this increase is HCCN that has a high abundance based on the Lavvas et al. (2008b) photochemical model. In this altitude region, the high atmospheric density and pressure decreases even further the particle settling velocity. Thus, the sampling volume spends a long time in this altitude region and is furthermore enriched by particles falling from higher altitude. This leads to a pile-up of the particles, demonstrated by the local increase of the particle density right below 500 km. The particle density decreases again at lower altitudes because of the enhanced coagulation rate, which enhances the particle growth (Figure 4). We should note though that because of the small sedimentation velocity of the particles, the effects of atmospheric mixing and advection are expected to have a larger impact in the aerosol evolution for this region and this is not included in our model.
The above picture of particle evolution demonstrates that not only the particle shape can change depending on the background conditions, but also that the mass flux of particles is changing with altitude. The mass flux at 950 km dominated by the benzene molecules is 2 × 10⁻¹⁷ g cm−2 s−1 and gradually increase with decreasing altitude, due to the deposition of PACs and radical addition on the surface of aerosols, reaching to ∼3 × 10⁻¹⁴ g cm−2 s−1 at the lower boundary of the simulation (Figure 4).
3.2.2. Sensitivity Analysis
The least constrained parameter in the calculations is the smoothing factor, s, that controls the rounding of the particles due to surface growth. Using different values of s ranging between 0.5 and 1.5, we get a qualitatively similar picture for the aerosol evolution with the nominal case, but with different results for the final aerosol properties.
For small s values particles attain a spherical shape faster for large s values, for which the aggregate structure of aerosols is better preserved. This is demonstrated by the model results for the average fractal dimension in region I (Figure 6). The divergence of Df from the spherical limit becomes increasingly more pronounced as the smoothing factor rises. Nevertheless, for all cases the fractal dimension returns close to the spherical limit (Df = 3), although, at a different altitude that ranges between ∼850 km for s = 0.5 and ∼700 km for s = 1.5. The departure of particle shape from the spherical limit further affects the size and density of particles. Aggregates have a larger surface area than spherical particles. This translates to a more efficient deposition of PACs and also to an increased coagulation rate due to the increased collision diameter. Therefore, the densities of aromatics and aerosols decrease with increasing values of s, as reproduced by the results. The increase of surface area with increasing s values also enhances the surface growth by radical reaction but with a secondary role in this altitude region relative to the other two processes (coagulation and PAC deposition). Finally, the mass flux of aerosols increases with increasing values of s due to the increased surface growth from the deposition of PACs.

Figure 6. Sensitivity of model results on smoothing factor. The particle density includes the cumulative contribution of aerosols and PACs.
Download figure:
Standard image High-resolution imageIn region II, the previous monotonic variation of properties with s becomes more complicated. The aggregation of aerosols depends on the abundance of aromatics, thus, as the PAC density decreases faster with higher s values, the average fractal dimension starts to decrease from three at increasingly higher altitudes. This transition altitude is also affected by the sedimentation velocity of the particles. For small s values, particles remain spherical for a longer period, which means that they have a larger sedimentation velocity than the same mass aggregate particles, and are able to penetrate deeper in the atmosphere. This is demonstrated by the variation of sedimentation velocity and altitude with time for the different cases considered (Figure 6). For s = 0.5 the minimum in the fractal dimension is reached at ∼450 km, while as the s value increases the altitude of minimum Df shifts to higher altitudes and eventually converges close to 550 km. Hence, the location of the transition altitude for the fractal dimension is defined by the balance between the surface deposition of PACs and the sedimentation velocity of the particles.
At lower altitudes (region III), the aerosol properties are strongly affected by the surface chemistry with the gas-phase radicals. For larger s values, the surface area of the particles increases, therefore there is a larger mass addition by the surface chemistry that generates a larger mass flux of aerosols. This effect is apparent in all the mass flux profiles by the sharp increase in the mass flux in the transition altitude corresponding to region III for each s case. For the largest values of s used in the sensitivity analysis, the resulting mass flux approaches values that are significantly larger than the estimates (∼3 × 10⁻¹⁴ g cm−2 s−1) based on Voyager and Cassini observations of Titan's atmosphere (McKay et al. 2001; Lavvas et al. 2009). This overestimation of the particle mass flux in this region has to do with the lack of feedback to the gas-phase chemistry, i.e., we do not consider the decrease in the gaseous abundances of the radicals as these are lost to the aerosols (this is further discussed below). Moreover, we assume that the surface chemistry proceeds with a unit efficiency, i.e., any radical hitting the surface of the particles sticks on it. This is an upper limit to the efficiency of surface chemistry and more laboratory measurements are required to set constraints on this parameter for each radical used. On the other hand, for all s values but to a different degree, the added mass contributes in smoothing again the surface of the particles and increasing the average fractal dimension. This becomes increasingly more efficient as s decreases. What we can clearly see is that irrespective of the s value, the fractal dimension transition takes place in a narrow altitude region between 450 and 600 km. This is consistent with the fractal dimension transition suggested to take place at the detached haze layer, based on Cassini observations (Lavvas et al. 2009).
It is also interesting to note the different time evolution of the aerosols. We run the simulations for a specific time period (108 s). Once aggregates form, particles sediment with the average velocity of the primary particles composing them. Therefore, for all cases considered, the system spends most of its time in the transition region (region II). On the other hand, the different sedimentation velocities of the aerosols (at all altitudes) for different s values translate to a different maximum penetration altitude for the given simulation time (Figure 6). This result will be affected by the atmospheric mixing, which is not considered in the current calculations, but it clearly demonstrates how the different processes affecting the shape and size of particles modify the time particles spend at different altitude regions.
4. DISCUSSION AND CONCLUSIONS
In the calculations, we move the sampling volume of the system according to the sedimentation velocity of its components and we do not include the contribution of atmospheric mixing or diffusion in the resulting particle properties. The impact of this simplification can be investigated by calculating the relative importance of the two processes. The characteristic time for a particle of a given size to sediment the length of a scale height, H, can be estimated as τs = H/vs, with vs the velocity of the particle. For the same length, the time required to mix the atmosphere is τm = H2/K, with K the eddy mixing coefficient. Using different values for the particle radius and the eddy mixing profile retrieved by photochemical models, we see that sedimentation has a comparable role with atmospheric mixing in the upper atmosphere for the particle sizes retrieved by our calculations, while at lower altitudes the atmospheric mixing dominates (Figure 7). Thus, the lack of atmospheric mixing should mainly affect the region below 500 km (region III).

Figure 7. Characteristic times for atmospheric mixing and sedimentation. The solid line presents the characteristic time to mix the atmosphere over a scale height. The structure is due to the use of the observed temperature profile by HASI for the calculation of the scale height. The eddy mixing profile used is taken from the Lavvas et al. (2008b) photochemical model. The dashed lines present the characteristic time to settle a scale height for a spherical particle. The different curves correspond to different radius particles with values of 1, 3, 5, 10, 20, 50, 100, and 200 nm from top to bottom.
Download figure:
Standard image High-resolution imageApart from this one-dimensional description, atmospheric advection can also affect the resulting particle properties (Rannou et al. 2004). Advection should be more important at high-latitude regions where the closing parts of the Hadley circulation cell components enrich the lower atmosphere with particles from the upper atmosphere (and vice versa for the opposite pole). Furthermore, the impact of horizontal motion will be stronger in the region of the stratospheric jet (close to 300 km), thus, will be mostly affecting region III of our simulation. Therefore, our results are representative of conditions at low and mid-latitudes, and altitudes above the stratosphere.
We use only a small group of radicals available in Titan's atmosphere for our calculations. Although C2H, CN, and HCCN are among the radicals with the highest abundance, the contribution of other radicals in the growth of PACs and the surface interaction with aerosols can be significant. Among the possible contributors, we can point out H2CN that is a major precursor of HCN on reaction with atomic hydrogen. The abundance of H2CN is high in the lower atmosphere, thus, if its interaction with the surface of aerosols is efficient, this heterogenous process could affect the vertical mixing ratio of HCN, as suggested in the past in order to explain the divergence of the observed HCN profile from photochemical calculations (Lara et al. 1999).
We have not coupled the aerosols evolution with the gas-phase radical species used in the calculations. This means that we consider the vertical profiles of the radicals unaffected by the aerosol growth. The validity of this assumption depends on the photochemical processes defining the net gas-phase production of each species. For example, C2H and CN are very reactive with other unsaturated hydrocarbons and nitrile species. Therefore, their loss is controlled by photochemistry and heterogeneous processes have a minor contribution to their abundance. The photochemical loss processes identified for HCCN are not many. Its main loss mechanisms identified in photochemical models (Yung et al. 1984; Lavvas et al. 2008a) are self-reaction and reaction with atomic nitrogen to provide C4N2 and C2N2, respectively. Based on theoretical calculations, Osamura & Petrie (2004) also suggested that reaction with H and CH3 should be important loss mechanisms for HCCN. Inclusion of these reactions to the photochemical model of Lavvas et al. (2008b) provides a lower abundance for HCCN's vertical profile, while considering also a heterogeneous loss on the aerosol surface further decreases its abundance (not shown here). Thus, for our current results the impact of the HCCN in the growth of aerosols is an upper limit.
Based on the uncertainties on the abundance of HCCN, as well as other radicals not included in the calculations, we consider the gas-phase species we include as proxies for the possible contribution of hydrocarbon and nitrogen-containing radicals. Our main focus with this investigation is to identify the main processes and mechanisms that can affect the aerosol evolution. Our results demonstrate that the evolution of aerosols in terms of size, shape, and density is a result of competing processes between surface growth, coagulation, and sedimentation. The particle evolution can be separated into three stages (Figure 8).
- 1.The benzene molecules produced in the thermosphere react with radical species and grow to bigger aromatic structures. The PACs coagulate and generate the first primary particles, while deposition of the former on the surface of the latter preserves the spherical shape of the particles.
- 2.Once the abundance of PACs is consumed, the produced particles aggregate and the average fractal dimension of the system reduces to values close to 2. At the pressure conditions of their formation region, aggregates sediment with a velocity close to the sedimentation velocity of their primary particles. This velocity is significantly smaller than the sedimentation velocity of the same mass spherical particle, thus, aggregates fall slowly. Consequently, aggregates grow rapidly over a narrow altitude region.
- 3.As the produced aggregates slowly sediment to lower altitudes, gas-phase radicals are interacting with their surface. Depending on the abundance and sticking efficiency of the radicals, the surface of the aggregates is once again smoothed toward a more spherical shape.

Figure 8. Shape of the particles at different altitudes.
Download figure:
Standard image High-resolution image
The increase of the fractal dimension toward the lower altitudes of our simulation is not consistent with Titan's stratospheric aerosol observations, which clearly show the presence of aggregates with a characteristic fractals dimension of Df = 2 (Tomasko et al. 2008; Lavvas et al. 2010). This is probably a result of the uncertainties in the abundance of HCCN, and also due to the lack of feedback in the gas-phase density of radicals used for the surface growth. In addition, the interaction of atomic hydrogen with the aerosol surface will also affect the results in this region. Laboratory experiments find that hydrogenation of the aerosols by incorporation of atomic hydrogen to the aerosol surface is an important process (Sekine et al. 2008a), while inclusion of the measured heterogeneous reaction rates to photochemical models (Lavvas et al. 2008b; Sekine et al. 2008b) shows that this process has the largest impact close to 400 km in Titan's atmosphere. Hydrogenation of the aerosols will result to a decrease of the unsaturated bonds in the particle surface, which can affect the sticking efficiency of other radicals and explain why the aerosols in Titan's main aerosol layer in the stratosphere are characteristic of Df = 2. A self-consistent investigation that will couple between the aerosol production and the gas-phase abundances along with the effects of atmospheric mixing and hydrogen heterogenous chemistry will be addressed in the future.
Another clarification we should make is related with the gas to particle transformation pathways. In our calculations, we only consider a pathway based on the growth of aromatic structures (homogeneous and heterogeneous polycyclic hydrocarbons), which is based on theoretical calculations for the growth of these structures on reaction with C2H and CN (Mebel et al. 2008; Landera & Mebel 2010). Other pathways including both aromatic and aliphatic precursors are suggested in previous investigations based on photochemical considerations (Lebonnois et al. 2002; Wilson & Atreya 2003; Lavvas et al. 2008b; Delitsky & McKay 2010), but the detailed information for the intermediate steps that will allow the description of these processes in our models is lacking. What we need is a better description of the interaction of large molecules with themselves and also with radicals, in order to identify the possible mechanisms that would provide a stable growth pathway. We hope our current investigation will motivate further theoretical and laboratory investigations that could aid to this goal.
This work has been supported through NASA grants NNX09AP14G and NNX09AB58G and NASA's Astrobiology Initiative through JPL subcontract 1372177 to the University of Arizona. M.S. and M.K. acknowledge the support from Churchill College and from the EP-SRC (under grant numbers EP/E01772X/1 and EP/G028672/1). P.L. thanks R. V. Yelle for his support to the project and his fruitful comments on the manuscript.