


ABSTRACT
We present the results of our systematic infrared 2.5–5 μm spectroscopy of 60 luminous infrared galaxies (LIRGs) with infrared luminosities LIR = 1011–1012 L☉ and 54 ultraluminous infrared galaxies (ULIRGs) with LIR ⩾ 1012 L☉, using the AKARI Infrared Camera (IRC). AKARI IRC slit-less spectroscopy allows us to probe the full range of emission from these galaxies, including spatially extended components. The 3.3 μm polycyclic aromatic hydrocarbon (PAH) emission features, hydrogen recombination emission lines, and various absorption features are detected and used to investigate the properties of these galaxies. Because of the relatively small effect of dust extinction in the infrared range, quantitative discussion of these dusty galaxy populations is possible. For sources with clearly detectable Brβ (2.63 μm) and Brα (4.05 μm) emission lines, the flux ratios are found to be similar to those predicted by case B theory. Starburst luminosities are estimated from both 3.3 μm PAH and Brα emission, which roughly agree with each other. In addition to the detected starburst activity, a significant fraction of the observed sources display signatures of obscured active galactic nuclei (AGNs), such as low PAH equivalent widths, large optical depths of dust absorption features, and red continuum emission. The energetic importance of optically elusive buried AGNs in optically non-Seyfert galaxies tends to increase with increasing galaxy infrared luminosity, from LIRGs to ULIRGs.
Export citation and abstract BibTeX RIS
1. INTRODUCTION
In luminous infrared galaxies (LIRGs) with infrared luminosities of LIR = 1011–1012 L☉ (Sanders & Mirabel 1996) and ultraluminous infrared galaxies (ULIRGs) with LIR ⩾ 1012 L☉ (Sanders et al. 1988a),6 infrared emission is the dominant component of bolometric luminosities. This means that (1) (U)LIRGs possess very luminous energy sources with L > 1011 L☉, (2) the energy sources are hidden by dust, which absorbs most of the primary energetic radiation, and (3) the heated dust radiates this energy as infrared dust thermal emission. The energy sources can be starburst activity (energy generation by the nuclear fusion reactions occurring inside rapidly formed stars) and/or active galactic nucleus (AGN) activity (in which the release of gravitational energy by a spatially compact, mass-accreting, super-massive black hole (SMBH) produces strong radiative energy). Because (U)LIRGs become an important population with increasing redshift, in terms of cosmic infrared radiation density (Le Floc'h et al. 2005; Caputi et al. 2007; Magnelli et al. 2009), understanding the physical nature of (U)LIRGs is important in clarifying the AGN–starburst connections in the dust-obscured galaxy population of the early universe.
Given that the bulk of the primary radiation from the energy sources is absorbed by dust, and so is not directly visible in (U)LIRGs, investigating their energy sources is difficult, particularly when spatially compact AGNs are surrounded by large amounts of dust along virtually every line of sight and become buried. In an AGN surrounded by a toroidal (torus-shaped) dusty medium, the so-called "narrow-line regions" (NLRs), which are photoionized by the ionizing radiation of the AGN, should be well developed along the axis of the torus above the torus scale height. Because the optical emission line flux ratios of NLRs in AGNs are different from those of clouds photoionized by stars in starbursts, this type of AGN is optically classified as Seyfert and is thus distinguishable from a normal starburst galaxy by optical spectroscopy (Veilleux & Osterbrock 1987; Kauffmann et al. 2003; Kewley et al. 2006). However, a buried AGN is not readily detectable by optical spectroscopy, because well-developed NLRs are lacking.
Infrared 2.5–5 μm (rest-frame) spectroscopy is a powerful tool for detecting these optically elusive (Maiolino et al. 2003) buried AGNs, because the effect of dust extinction is relatively small (Nishiyama et al. 2009). More importantly, starburst and AGN activity can be distinguished, based on the infrared spectral shapes of galaxies. First, strong, large-equivalent-width emission of polycyclic aromatic hydrocarbons (PAHs) is usually seen at rest-frame 3.3 μm in a normal starburst galaxy, whereas a pure AGN exhibits a PAH-free continuum, originating in AGN-heated, larger-sized hot dust (Moorwood 1986; Imanishi & Dudley 2000). Second, in a normal starburst, the stellar energy sources and dust are spatially well mixed (Puxley 1991; McLeod et al. 1993; Forster Schreiber et al. 2001), while in a buried AGN, the energy source (i.e., a compact mass-accreting SMBH) is more centrally concentrated than the surrounding dust (Soifer et al. 2000; Siebenmorgen et al. 2004; Imanishi et al. 2007a, 2008). Thus, the optical depths of dust absorption features found at 2.5–5 μm cannot exceed certain thresholds in a normal starburst with mixed dust/source geometry, but they can be arbitrarily large in a buried AGN with centrally concentrated energy source geometry (Imanishi & Maloney 2003; Imanishi et al. 2006a).
Using these properties, infrared 2.8–4.2 μm (L-band) and 4.5–5.0 μm (M-band) spectroscopy has previously been applied to many galaxies, using infrared spectrographs attached to large ground-based telescopes, to examine the nature of dust-obscured energy sources (Imanishi et al. 2006a; Risaliti et al. 2006; Imanishi 2006; Sani et al. 2008; Risaliti et al. 2010). However, the sample has been limited, primarily to ULIRGs with LIR ⩾ 1012 L☉. Infrared dust emission from nearby ULIRGs is usually dominated by a spatially compact component (Soifer et al. 2000), so that ground-based slit spectroscopy with a width of less than few arcseconds can probe most of the emission. On the other hand, in nearby LIRGs with LIR = 1011–1012 L☉, spatially extended infrared dust emission of up to several arcseconds becomes important (Soifer et al. 2001), and thus ground-based slit spectroscopy could miss a significant fraction of the infrared radiation. Slit-less spectroscopy using the Infrared Camera (IRC) infrared spectrograph on board AKARI (Onaka et al. 2007; Murakami et al. 2007) is best suited for studying the origins of infrared emission from such spatially extended LIRGs. By covering both LIRGs and ULIRGs, we can better investigate AGN–starburst connections as a function of galaxy infrared luminosity. In addition to its slit-less spectroscopic capability, AKARI IRC has a wide continuous wavelength coverage of 2.5–5 μm, unhindered by Earth's atmosphere, thus enabling us to investigate the 2.63 μm Brβ emission lines and the 4.26 μm CO2 absorption features of nearby sources, which are totally inaccessible from the ground. Furthermore, the strengths of the very broad 3.1 μm H2O ice absorption (Gibb et al. 2004) and 4.67 μm CO absorption features, as well as continuum slopes, are better estimated using AKARI IRC spectra with wider wavelength coverage, rather than ground-based spectra with limited wavelength coverage.
In this paper, we present the results of systematic AKARI IRC 2.5–5 μm slit-less spectroscopy of LIRGs. Many ULIRGs have also been observed, to augment the ULIRG sample previously studied with AKARI IRC (Imanishi et al. 2008). Throughout this paper, H0 = 75 km s−1 Mpc−1, ΩM = 0.3, and ΩΛ = 0.7 are adopted to be consistent with our previous publications.
2. TARGETS
LIRGs with LIR = 1011.1–1012 L☉ are selected from the Bright Galaxy Sample (BGS; Soifer et al. 1987; Sanders et al. 1995) and the revised BGS (Sanders et al. 2003). ULIRGs with LIR ⩾ 1012 L☉ are selected from the IRAS 1 Jy sample, compiled by Kim & Sanders (1998). These LIRG and ULIRG samples have IRAS 60 μm fluxes ⩾5.24 Jy and ⩾1 Jy, respectively. Because of AKARI's sun-synchronous polar orbit, which follows the boundary between night and day (Murakami et al. 2007), objects with high (low) ecliptic latitudes have high (low) visibilities. It is difficult to observe a statistically complete sample with AKARI, because the probability of observing objects with low ecliptic latitudes is small. Moreover, due to the orbit, any particular object is observable only twice a year, and the position angle of the AKARI IRC is fixed to within <1° and is not arbitrarily adjustable (excluding sources at the north and south ecliptic poles). For sources with multiple nuclei that happen to be aligned in the direction of spectral dispersion, the spectra of these nuclei overlap and reliable extraction of individual nuclear spectra is not possible. For these reasons, our sample consists of a statistically significant number of LIRGs and ULIRGs but is not a complete sample. However, the observed sources are limited only by their sky positions and the elongation of multiple nuclei, and hence there should be no selection bias regarding the physical nature of the objects. These LIRGs and ULIRGs are used primarily for statistical discussion. Tables 1 and 2 summarize the pertinent information for the observed LIRGs and ULIRGs, respectively.
Table 1. LIRGs Observed with AKARI IRC, and their IRAS-based Infrared Emission Properties and Optical Spectral Classifications
| Object | z | f12 | f25 | f60 | f100 | log LIR | f25/f60 | Optical |
|---|---|---|---|---|---|---|---|---|
| (Jy) | (Jy) | (Jy) | (Jy) | (L☉) | Class | |||
| (1) | (2) | (3) | (4) | (5) | (6) | (7) | (8) | (9) |
| IRAS 00085−1223 (NGC 34) | 0.020 | 0.35 | 2.39 | 17.05 | 16.86 | 11.5 | 0.14 (C) | Sy2a |
| IRAS 00163−1039 (MCG−02-01-051) | 0.027 | 0.28 | 1.20 | 7.48 | 9.66 | 11.4 | 0.16 (C) | H iia |
| IRAS 00402−2349 (NGC 232) | 0.022 | 0.36 | 1.28 | 10.05 | 17.14 | 11.3 | 0.13 (C) | H iia |
| IRAS 01053−1746 (IC 1623A/B, VV 114E/W) | 0.020 | 1.03 | 3.65 | 22.93 | 31.55 | 11.7 | 0.16 (C) | H ii + H iia |
| IRAS 01076−1707 (MCG−03-04-014) | 0.035 | 0.34 | 0.90 | 7.25 | 10.33 | 11.7 | 0.12 (C) | H iia |
| IRAS 01159−4443 (ESO 244-G012) | 0.023 | 0.39 | 1.95 | 9.27 | 11.76 | 11.4 | 0.21 (W) | H iib |
| IRAS 01173+1405 (CGCG 436-030, MCG+02-04-025) | 0.031 | 0.21 | 1.54 | 10.71 | 9.67 | 11.6 | 0.14 (C) | H iia |
| IRAS 01484+2220 (NGC 695) | 0.033 | 0.50 | 0.83 | 7.59 | 13.56 | 11.7 | 0.11 (C) | H iia |
| IRAS 02435+1253 (UGC 2238) | 0.021 | 0.36 | 0.65 | 8.17 | 15.67 | 11.3 | 0.08 (C) | LIa |
| IRAS 03359+1523 | 0.035 | <0.07 | 0.65 | 5.97 | 7.27 | 11.5 | 0.11 (C) | H iia |
| IRAS 04097+0525 (UGC 2982) | 0.017 | 0.57 | 0.83 | 8.39 | 16.82 | 11.1 | 0.10 (C) | H iia |
| IRAS 04315−0840 (NGC 1614) | 0.016 | 1.38 | 7.50 | 32.12 | 34.32 | 11.6 | 0.23 (W) | H iia |
| IRAS 07256+3355 (NGC 2388) | 0.014 | 0.69 | 1.98 | 16.74 | 24.58 | 11.2 | 0.12 (C) | H iia |
| IRAS 08354+2555 (NGC 2623) | 0.018 | 0.21 | 1.81 | 23.74 | 25.88 | 11.5 | 0.08 (C) | Unca |
| IRAS 09333+4841 (MCG+08-18-013) | 0.026 | 0.10 | 0.75 | 5.68 | 8.42 | 11.3 | 0.13 (C) | H iia |
| IRAS 10015−0614 (NGC 3110) | 0.017 | 0.59 | 1.13 | 11.28 | 22.27 | 11.2 | 0.10 (C) | H iia |
| IRAS 10173+0828 | 0.049 | 0.19 | 0.55 | 5.61 | 5.86 | 11.8 | 0.10 (C) | Uncc |
| IRAS 10409−4556 (ESO 264-G036) | 0.023 | 0.36 | 0.67 | 6.07 | 13.37 | 11.3 | 0.11 (C) | ? |
| IRAS 11011+4107 (MCG+07-23-019, A1101+41) | 0.035 | 0.20 | 0.71 | 6.38 | 10.30 | 11.6 | 0.11 (C) | ? |
| IRAS 11186−0242 (CGCG 011-076, MCG+00-29-023) | 0.025 | 0.48 | 0.76 | 5.85 | 9.18 | 11.3 | 0.13 (C) | H iia |
| IRAS 11231+1456 (IC 2810, UGC 6436) | 0.034 | 0.14 | 0.62 | 6.20 | 10.39 | 11.5 | 0.10 (C) | H ii (NW) + Unc (SE)a |
| IRAS 11257+5850 (Arp 299, NGC 3690/IC 694) | 0.011 | 3.97 | 24.51 | 113.05 | 111.42 | 11.8d | 0.22 (W) | H iic (LI + Sy2/H ii)e |
| IRAS 12224−0624 | 0.026 | <0.11 | 0.20 | 5.99 | 8.13 | 11.2 | 0.03 (C) | LIa (Sy2f) |
| IRAS 13001−2339 (ESO 507-G070) | 0.021 | 0.25 | 0.80 | 13.04 | 15.71 | 11.4 | 0.06 (C) | ? |
| IRAS 13097−1531 (NGC 5010) | 0.010g | 0.37 | 1.44 | 10.29 | 21.69 | 11.4 | 0.14 (C) | ? |
| IRAS 13126+2453 (IC 860) | 0.013 | <0.14 | 1.34 | 18.61 | 18.66 | 11.1 | 0.07 (C) | Unca |
| IRAS 13136+6223 (VV 250, UGC 8335) | 0.031 | 0.35 | 1.95 | 11.39 | 12.41 | 11.7 | 0.17 (C) | H ii (NW) + H ii (SE)a |
| IRAS 13182+3424 (UGC 8387, Arp 193, IC 883) | 0.023 | 0.25 | 1.42 | 17.04 | 24.38 | 11.6 | 0.08 (C) | LIa |
| IRAS 13188+0036 (NGC 5104) | 0.019 | 0.39 | 0.74 | 6.78 | 13.37 | 11.1 | 0.11 (C) | LIa |
| IRAS 13197−1627 (MCG−03-34-064) | 0.017 | 0.94 | 2.97 | 6.20 | 6.20 | 11.1 | 0.48 (W) | Sy2h,i |
| IRAS 13229−2934 (NGC 5135) | 0.014 | 0.63 | 2.38 | 16.86 | 30.97 | 11.2 | 0.14 (C) | Sy2b |
| IRAS 13362+4831 (NGC 5256, Mrk 266) | 0.028 | 0.32 | 1.07 | 7.25 | 10.11 | 11.5 | 0.15 (C) | LI (SW) + Sy2 (NE)a |
| IRAS 13478−4848 (ESO 221-IG010) | 0.010j | 0.74 | 1.82 | 12.92 | 22.00 | 11.2 | 0.14 (C) | ? |
| IRAS 14179+4927 (CGCG 247-020, Zw 247.020) | 0.026 | 0.15 | 0.84 | 6.01 | 8.47 | 11.3 | 0.14 (C) | H iia |
| IRAS 14547+2449 (VV 340, UGC 9618) | 0.033 | 0.36 | 0.41 | 6.95 | 15.16 | 11.6 | 0.06 (C) | LIa |
| IRAS 15107+0724 (CGCG 049-057, Zw 049.057) | 0.013 | <0.05 | 0.95 | 21.89 | 31.53 | 11.2 | 0.04 (C) | H iia |
| IRAS 15163+4255 (VV 705, I Zw 107) | 0.040 | 0.29 | 1.42 | 9.02 | 10.00 | 11.9 | 0.16 (C) | LI (S) + H ii (N)a |
| IRAS 15250+3609 | 0.055 | 0.16 | 1.31 | 7.10 | 5.93 | 12.0 | 0.18 (C) | LIa |
| IRAS 15335−0513 | 0.026 | 0.14 | 0.50 | 5.25 | 8.96 | 11.2 | 0.10 (C) | LIa (Sy2f) |
| IRAS 16104+5235 (NGC 6090) | 0.030 | 0.26 | 1.24 | 6.48 | 9.41 | 11.5 | 0.19 (C) | H iia |
| IRAS 16284+0411 (CGCG 052-037, MCG+01-42-008) | 0.024 | 0.25 | 0.81 | 7.00 | 11.23 | 11.3 | 0.12 (C) | H iia |
| IRAS 16577+5900 (NGC 6285/6) | 0.019 | 0.47 | 0.62 | 9.24 | 23.11 | 11.3 | 0.07 (C) | H ii (NW) +LI (SE)a |
| IRAS 17132+5313 | 0.051 | 0.24 | 0.65 | 6.07 | 7.90 | 11.9 | 0.11 (C) | Unc (W) + H ii (E)a |
| IRAS 18131+6820 (NGC 6621) | 0.021 | 0.31 | 0.97 | 6.78 | 12.01 | 11.2 | 0.14 (C) | H iia |
| IRAS 19542−3804 (ESO 339-G011) | 0.019 | 0.36 | 1.20 | 5.96 | 9.27 | 11.1 | 0.201 (W) | Sy2f |
| IRAS 21453−3511 (NGC 7130, IC 5135) | 0.016 | 0.58 | 2.16 | 16.71 | 25.89 | 11.3 | 0.13 (C) | LIa |
| IRAS 22132−3705 (IC 5179) | 0.011 | 1.18 | 2.40 | 19.39 | 37.29 | 11.1 | 0.12 (C) | H iia |
| IRAS 22287−1917 (ESO 602-G025, MCG−03-57-017) | 0.025 | 0.27 | 0.91 | 5.42 | 9.64 | 11.3 | 0.17 (C) | LIa |
| IRAS 22389+3359 (UGC 12150) | 0.021 | 0.37 | 0.82 | 8.00 | 15.58 | 11.3 | 0.10 (C) | H iia |
| IRAS 23007+0836 (NGC 7469) | 0.016 | 1.59 | 5.96 | 27.33 | 35.16 | 11.6 | 0.22 (W) | Sy1a |
| IRAS 23024+1916 (CGCG 453-062, Zw 453.062) | 0.025 | 0.19 | 0.54 | 7.19 | 11.73 | 11.3 | 0.08 (C) | LIa (Sy2f) |
| IRAS 23135+2517 (IC 5298, Zw 475.056) | 0.027 | 0.34 | 1.95 | 9.06 | 11.99 | 11.5 | 0.22 (W) | Sy2a |
| IRAS 23157−0441 (NGC 7592) | 0.024 | 0.26 | 0.97 | 8.05 | 10.58 | 11.3 | 0.12 (C) | Sy2 (W) + H ii (E)a |
| IRAS 23254+0830 (NGC 7674) | 0.029 | 0.68 | 1.92 | 5.36 | 8.33 | 11.5 | 0.36 (W) | Sy2a |
| IRAS 23394−0353 (MCG−01-60-022) | 0.023 | 0.41 | 1.06 | 5.39 | 8.26 | 11.2 | 0.197 (C) | ? |
| IRAS 23436+5257 | 0.034 | 0.17 | 0.74 | 5.66 | 9.01 | 11.5 | 0.13 (C) | ? |
| IRAS 23488+1949 (NGC 7771) | 0.014 | 0.99 | 2.17 | 19.67 | 40.12 | 11.3 | 0.11 (C) | H iia |
| IRAS 23488+2018 (Mrk 331, MCG+03-60-36) | 0.018 | 0.52 | 2.54 | 18.00 | 22.70 | 11.4 | 0.14 (C) | H iia |
| IRAS 12243−0036 (NGC 4418) | 0.007 | 0.99 | 9.67 | 43.89 | 31.94 | 11.0 | 0.22 (W) | LIc |
| IRAS 03344−2103 (NGC 1377) | 0.006 | 0.56 | 1.93 | 7.43 | 5.95 | 10.1k | 0.26 (W) | Unca |
Notes. Column 1: object name. Column 2: redshift. Columns 3–6: f12, f25, f60, and f100 are IRAS fluxes at 12 μm, 25 μm, 60 μm, and 100 μm, respectively, taken from Sanders et al. (2003), except for IRAS 15335−0513, the IRAS fluxes of which are from Soifer et al. (1989). Column 7: decimal logarithm of infrared (8–1000 μm) luminosity in units of solar luminosity (L☉), calculated from LIR = 2.1 × 1039× D(Mpc)2 × (13.48 ×f12 + 5.16 × f25 + 2.58 × f60 + f100) ergs s−1 (Sanders & Mirabel 1996). Because the calculation is based on our adopted cosmology, the infrared luminosities sometimes differ slightly (<10%) from the values shown in Sanders et al. (2003). For sources that have upper limits in some IRAS bands, we can derive upper and lower limits on the infrared luminosity by assuming that the actual flux is equal to the IRAS upper limit and the zero value, respectively. The difference between the upper and lower values is usually very small, less than 0.1 dex. We assume that the infrared luminosity is the average of these values. Column 8: IRAS 25 μm to 60 μm flux ratio. LIRGs with f25/f60 < 0.2 and >0.2 are classified as cool and warm sources (denoted as "C" and "W"), respectively (Sanders et al. 1988b). Column 9: optical spectral classification. aVeilleux et al. (1995). bKewley et al. (2001). cArmus et al. (1989). dWe assume that 40% of the infrared luminosity originates from NGC 3690 and 60% from IC 694 (Joy et al. 1989; Charmandaris et al. 2002). eGarcia-Marin et al. (2006). fYuan et al. (2010). gAdopted from Wegner et al. (2003). hde Grijp et al. (1987). iRush et al. (1993). jAffected by the Great Attractor. A luminosity distance = 58.2 (Mpc) is assumed (Sanders et al. 2003). kThe infrared luminosity of NGC 1377 is less than 1011 L☉, the lower threshold for LIRGs in our definition. Nevertheless, this source is included in the present table for LIRGs.
Table 2. ULIRGs Observed with AKARI IRC, and their IRAS-based Infrared Emission Properties and Optical Spectral Classifications
| Object | z | f12 | f25 | f60 | f100 | log LIR | f25/f60 | Optical |
|---|---|---|---|---|---|---|---|---|
| (Jy) | (Jy) | (Jy) | (Jy) | (L☉) | Class | |||
| (1) | (2) | (3) | (4) | (5) | (6) | (7) | (8) | (9) |
| IRAS 00188−0856 | 0.128 | <0.12 | 0.37 | 2.59 | 3.40 | 12.3 | 0.14 (C) | LIa (Sy2b) |
| IRAS 04103−2838 | 0.118 | 0.08 | 0.54 | 1.82 | 1.71 | 12.2 | 0.30 (W) | LIa (Sy2b) |
| IRAS 10378+1108 | 0.136 | <0.11 | 0.24 | 2.28 | 1.82 | 12.3 | 0.11 (C) | LIa (Sy2b) |
| IRAS 10485−1447 | 0.133 | <0.11 | 0.25 | 1.73 | 1.66 | 12.2 | 0.14 (C) | LIa (Sy2b) |
| IRAS 11095−0238 | 0.106 | 0.06 | 0.42 | 3.25 | 2.53 | 12.2 | 0.13 (C) | LIa |
| IRAS 11582+3020 | 0.223 | <0.10 | <0.15 | 1.13 | 1.49 | 12.5 | <0.14 (C) | LIa |
| IRAS 12032+1707 | 0.217 | <0.14 | 0.25 | 1.36 | 1.54 | 12.6 | 0.18 (C) | LIa (Sy2b) |
| IRAS 12112+0305 | 0.073 | 0.12 | 0.51 | 8.50 | 9.98 | 12.3 | 0.06 (C) | LIa (Sy2b) |
| IRAS 12127−1412 | 0.133 | <0.13 | 0.24 | 1.54 | 1.13 | 12.1 | 0.16 (C) | LIa |
| IRAS 12359−0725 | 0.138 | 0.09 | 0.15 | 1.33 | 1.12 | 12.1 | 0.11 (C) | LIa |
| IRAS 13106−0922 | 0.174 | <0.12 | <0.06 | 1.24 | 1.89 | 12.3 | <0.05 (C) | LIa |
| IRAS 13335−2612 | 0.125 | <0.13 | <0.14 | 1.40 | 2.10 | 12.1 | <0.10 (C) | LIa |
| IRAS 14348−1447 | 0.083 | 0.07 | 0.49 | 6.87 | 7.07 | 12.3 | 0.07 (C) | LIa |
| IRAS 15327+2340 (Arp 220) | 0.018 | 0.48 | 7.92 | 103.33 | 112.40 | 12.1 | 0.08 (C) | LIa |
| IRAS 16090−0139 | 0.134 | 0.09 | 0.26 | 3.61 | 4.87 | 12.5 | 0.07 (C) | LIa |
| IRAS 16300+1558 | 0.242 | <0.07 | 0.07 | 1.48 | 1.99 | 12.7 | 0.05 (C) | LIa |
| IRAS 21329−2346 | 0.125 | 0.05 | 0.12 | 1.65 | 2.22 | 12.1 | 0.07 (C) | LIa |
| IRAS 00091−0738 | 0.118 | <0.07 | 0.22 | 2.63 | 2.52 | 12.2 | 0.08 (C) | H iia |
| IRAS 00397−1312 | 0.261 | 0.14 | 0.33 | 1.83 | 1.90 | 12.9 | 0.18 (C) | H iia |
| IRAS 01004−2237 | 0.118 | 0.11 | 0.66 | 2.29 | 1.79 | 12.3 | 0.29 (W) | H iia (Sy2b) |
| IRAS 01166−0844 | 0.118 | 0.07 | 0.17 | 1.74 | 1.42 | 12.1 | 0.10 (C) | H iia |
| IRAS 08201+2801 | 0.168 | <0.09 | 0.15 | 1.17 | 1.43 | 12.3 | 0.13 (C) | H iia |
| IRAS 13509+0442 | 0.136 | 0.10 | <0.23 | 1.56 | 2.53 | 12.2 | <0.15 (C) | H iia |
| IRAS 14060+2919 | 0.117 | <0.10 | 0.14 | 1.61 | 2.42 | 12.1 | 0.09 (C) | H iia |
| IRAS 15206+3342 | 0.125 | 0.08 | 0.35 | 1.77 | 1.89 | 12.2 | 0.198 (C) | H iia |
| IRAS 15225+2350 | 0.139 | <0.07 | 0.18 | 1.30 | 1.48 | 12.1 | 0.14 (C) | H iia |
| IRAS 16474+3430 | 0.111 | <0.13 | 0.20 | 2.27 | 2.88 | 12.1 | 0.09 (C) | H iia |
| IRAS 20414−1651 | 0.086 | <0.65 | 0.35 | 4.36 | 5.25 | 12.2 | 0.08 (C) | H iia |
| IRAS 22206−2715 | 0.132 | <0.10 | <0.16 | 1.75 | 2.33 | 12.2 | <0.10 (C) | H iia |
| IRAS 22491−1808 | 0.076 | 0.05 | 0.55 | 5.44 | 4.45 | 12.1 | 0.10 (C) | H iia |
| IRAS 02021−2103 | 0.116 | <0.07 | 0.30 | 1.45 | 1.72 | 12.0 | 0.21 (W) | Unca |
| IRAS 12018+1941 | 0.168 | <0.11 | 0.37 | 1.76 | 1.78 | 12.5 | 0.21 (W) | Unca |
| IRAS 14197+0813 | 0.131 | <0.17 | <0.19 | 1.10 | 1.66 | 12.0 | <0.18 (C) | Unca |
| IRAS 14485−2434 | 0.148 | <0.11 | <0.15 | 1.02 | 1.05 | 12.1 | <0.15 (C) | Unca |
| IRAS 08559+1053 | 0.148 | <0.10 | 0.19 | 1.12 | 1.95 | 12.2 | 0.17 (C) | Sy2a |
| IRAS 11223−1244 | 0.199 | <0.07 | <0.16 | 1.52 | 2.26 | 12.5 | <0.11 (C) | Sy2a |
| IRAS 12072−0444 | 0.129 | <0.12 | 0.54 | 2.46 | 2.47 | 12.4 | 0.22 (W) | Sy2a |
| IRAS 13305−1739 | 0.148 | <0.09 | 0.39 | 1.16 | 1.04 | 12.2 | 0.34 (W) | Sy2a |
| IRAS 13428+5608 (Mrk 273) | 0.037 | 0.24 | 2.28 | 21.74 | 21.38 | 12.1 | 0.10 (C) | Sy2a |
| IRAS 13443+0802 | 0.135 | <0.12 | <0.11 | 1.50 | 1.99 | 12.1 | <0.08 (C) | Sy2a |
| IRAS 13451+1232 (PKS 1345+12) | 0.122 | 0.14 | 0.67 | 1.92 | 2.06 | 12.3 | 0.35 (W) | Sy2a |
| IRAS 15001+1433 | 0.162 | <0.12 | 0.21 | 1.87 | 2.04 | 12.4 | 0.11 (C) | Sy2a |
| IRAS 15130−1958 | 0.109 | <0.14 | 0.39 | 1.92 | 2.30 | 12.1 | 0.203 (W) | Sy2a |
| IRAS 16156+0146 | 0.132 | <0.10 | 0.28 | 1.13 | 1.00 | 12.1 | 0.25 (W) | Sy2a |
| IRAS 22541+0833 | 0.166 | <0.09 | <0.18 | 1.20 | 1.48 | 12.2 | <0.15 (C) | Sy2a |
| IRAS 23060+0505 | 0.173 | 0.20 | 0.43 | 1.15 | 0.83 | 12.5 | 0.37 (W) | Sy2a |
| IRAS 23233+2817 | 0.114 | <0.13 | 0.28 | 1.26 | 2.11 | 12.0 | 0.22 (W) | Sy2a |
| IRAS 23389+0300 | 0.145 | <0.09 | <0.35 | 1.23 | 1.17 | 12.1 | <0.29 (?) | Sy2a |
| IRAS 00183−7111 (00182−7112) | 0.327 | <0.07 | 0.13 | 1.20 | 1.19 | 12.9 | 0.11 (C) | LIc |
| IRAS 06035−7102 | 0.079 | 0.12 | 0.57 | 5.13 | 5.65 | 12.2 | 0.11 (C) | LId |
| IRAS 20100−4156 | 0.130 | <0.14 | 0.34 | 5.23 | 5.17 | 12.6 | 0.07 (C) | H iid |
| IRAS 20551−4250 | 0.043 | 0.28 | 1.91 | 12.78 | 9.95 | 12.0 | 0.15 (C) | LI/H iid |
| IRAS 23128−5919 | 0.045 | 0.25 | 1.59 | 10.80 | 10.99 | 12.0 | 0.15 (C) | H iid |
| IRAS 12540+5708 (Mrk 231) | 0.042 | 1.87 | 8.66 | 31.99 | 30.29 | 12.5 | 0.27 (W) | Sy1a |
Notes. Column 1: object name. Column 2: redshift. Columns 3–6: f12, f25, f60, and f100 are IRAS fluxes at 12 μm, 25 μm, 60 μm, and 100 μm, respectively, taken from Kim & Sanders (1998) or the IRAS Faint Source Catalog. Column 7: decimal logarithm of infrared (8–1000 μm) luminosity in units of solar luminosity (L☉), calculated from LIR = 2.1 × 1039× D(Mpc)2 × (13.48 ×f12 + 5.16 × f25 + 2.58 × f60 + f100) ergs s−1 (Sanders & Mirabel 1996). For sources that have upper limits in some IRAS bands, we can derive upper and lower limits on the infrared luminosity by assuming that the actual flux is equal to the IRAS upper limit and the zero value, respectively. The difference between the upper and lower values is usually very small, less than 0.2 dex. We assume that the infrared luminosity is the average of these values. Column 8: IRAS 25 μm to 60 μm flux ratio. ULIRGs with f25/f60 < 0.2 and > 0.2 are classified as cool and warm sources (denoted as "C" and "W"), respectively (Sanders et al. 1988b). Column 9: optical spectral classification. aVeilleux et al. (1999). bYuan et al. (2010). cArmus et al. (1989). dDuc et al. (1997).
Download table as: ASCIITypeset image
In addition to these unbiased samples, several additional interesting LIRGs and ULIRGs are also observed. These sources display strong absorption features at 5–20 μm and/or luminous buried AGN signatures from previous observations at other wavelengths. The observed sources are NGC 4418 (Roche et al. 1991; Dudley & Wynn-Williams 1997; Spoon et al. 2001; Imanishi et al. 2004; Lahuis et al. 2007; Imanishi et al. 2010b), NGC 1377 (Roussel et al. 2006; Imanishi 2006), IRAS 00183−7111 (Spoon et al. 2004), IRAS 06035−7102 (Spoon et al. 2002; Dartois & Munoz-Caro 2007; Farrah et al. 2009), IRAS 20100−4156 (Franceschini et al. 2003; Lahuis et al. 2007), IRAS 20551−4250 (Franceschini et al. 2003; Risaliti et al. 2006; Nardini et al. 2009), and IRAS 23128−5919 (Spoon et al. 2002; Franceschini et al. 2003; Farrah et al. 2009). It is of particular interest to confirm whether the AKARI IRC infrared spectral shapes of these galaxies are also indicative of luminous buried AGNs and/or to carry out a detailed investigation of the absorption features found in the 2.5–5 μm wavelength range of AKARI IRC. Finally, Mrk 231 is a galaxy optically classified as Seyfert 1 and is listed in the IRAS 1 Jy ULIRG sample (Kim & Sanders 1998; Veilleux et al. 1999). Our basic sample selection of ULIRGs excludes optically Seyfert 1 galaxies, because our primary scientific aim is to study obscured AGNs, and the presence of unobscured AGNs is obvious in optical Seyfert 1 galaxies. However, despite its optical Seyfert 1 classification, the infrared spectrum of Mrk 231 shows absorption features (Lahuis et al. 2007; Dartois & Munoz-Caro 2007; Brauher et al. 2008), making it an enigmatic object. Obtaining a high-quality AKARI IRC 2.5–5 μm spectrum should help to determine the true nature of Mrk 231. Thus, Mrk 231 is placed in the category of "additional interesting sources" and is included in our observations. The observed properties of these sources are summarized in Tables 1 and 2, according to their infrared luminosities.
3. OBSERVATIONS AND DATA ANALYSIS
Infrared 2.5–5 μm spectroscopy of the LIRGs and ULIRGs was performed with the IRC infrared spectrograph (Onaka et al. 2007) on board the AKARI infrared satellite (Murakami et al. 2007). All data were collected as part of the mission program called "AGNUL." Tables 3 and 4 summarize the observation logs for the LIRGs and ULIRGs, respectively. The NG grism mode was used for our observations. In this mode, the entire 2.5–5.0 μm wavelength range is simultaneously covered at an effective spectral resolution of R ∼ 120 at 3.6 μm for point sources (Onaka et al. 2007). Objects were located inside a 1 × 1 arcmin2 window to avoid spectral overlap from nearby sources (Onaka et al. 2007; Ohyama et al. 2007). The pixel scale of AKARI IRC is 1 46 × 146. One to five pointings were assigned to each source, depending on its brightness and visibility. The total net on-source exposure time for one pointing was ∼6 minutes. Because we used the IRC04 (phases 1 and 2; liquid-He cool holding period, before 2007 August) and IRCZ4 (phase 3; post liquid-He warm mission cooled by the onboard cryocooler, after 2008 June) observing modes, one pointing consisted of eight or nine independent frames (Onaka et al. 2007). Hence, the effects of cosmic ray hits were essentially removable, even for sources with only one pointing. For sources with more than one pointing, if independent data sets were of similar quality, all of them were added together to obtain the final spectra. However, if some of the data sets were substantially inferior to others, only the better data sets were used to obtain the final spectra, because the addition of poorer-quality data often degraded the quality of the final spectra. This was especially true when data for a particular object were collected during widely separated and dissimilar periods, specifically during early and late phase 3 of AKARI, because the background noise gradually increased as phase 3 proceeded and was substantially higher during late phase 3 (because of the temperature increase of the IRC).
Table 3. AKARI IRC Observation log for LIRGs
| Object | Observation ID | Observation Date |
|---|---|---|
| (1) | (2) | (3) |
| NGC 34 | 1120100-001, 002 | 2008 Jun 17, 18 |
| MCG−02-01-051 | 1120101-001, 002 | 2008 Jun 20, 2009 Jun 21 |
| NGC 232 | 1120102-002 | 2008 Dec 20 |
| IC 1623A/B (VV 114) | 1120103-002 | 2008 Jun 29 |
| MCG−03-04-014 | 1120104-001, 002 | 2008 Jun 29 |
| ESO 244-G012 | 1122223-001, 002, 003, 004 | 2009 Dec 16 |
| CGCG 436-030 | 1120105-002 | 2008 Jul 15 |
| NGC 695 | 1120108-001 | 2009 Jul 25 |
| UGC 2238 | 1120110-001 | 2008 Aug 5 |
| IRAS 03359+1523 | 1120112-001 | 2008 Aug 17 |
| UGC 2982 | 1120113-001 | 2009 Feb 21 |
| NGC 1614 | 1120115-001 | 2008 Aug 27 |
| NGC 2388 | 1120231-001, 002, 003 | 2008 Oct 11, 12 |
| NGC 2623 | 1120116-001, 002 | 2009 Apr 24, 25 |
| MCG+08-18-013 | 1120118-002 | 2009 Apr 28 |
| NGC 3110 | 1120120-002 | 2009 May 26 |
| IRAS 10173+0828 | 1120121-001 | 2009 May 24 |
| ESO 264-G036 | 1122231-001, 003, 004 | 2009 Dec 27, 28 |
| MCG+07-23-019 | 1120122-001, 002 | 2008 Nov 21, 2009 May 19 |
| CGCG 011-076 | 1120123-002 | 2009 Jun 12 |
| IC 2810 | 1120124-001 | 2008 Jun 6 |
| VV188 (Arp 299, NGC 3690/IC 694) | 1120125-001 | 2008 Nov 13 |
| IRAS 12224−0624 | 1120126-001, 002 | 2008 Jun 29 |
| ESO 507-G070 | 1120128-001, 002 | 2008 Jul 15 |
| NGC 5010 | 1122217-001, 002, 003, 004 | 2010 Jan 12, 13 |
| IC 860 | 1120040-001, 002, 003 | 2008 Jun 28 |
| VV 250 (UGC 8335) | 1120129-001, 002 | 2009 May 23 |
| Arp 193 | 1120151-002 | 2008 Jun 24 |
| NGC 5104 | 1120131-001 | 2009 Jan 8 |
| MCG−03-34-064 | 1120084-001, 002, 003, 004, 005 | 2008 Jul 17 |
| NGC 5135 | 1120132-001, 002 | 2008 Jul 23 |
| NGC 5256 (Mrk 266) | 1120133-001, 002 | 2008 Jun 17 |
| ESO 221-IG010 | 1122258-001, 002 | 2010 Feb 3 |
| CGCG 247-020 | 1120135-001 | 2008 Jun 24 |
| VV 340 | 1120136-001 | 2008 Jul 24 |
| CGCG 049-057 | 1120137-001, 002 | 2008 Aug 5 |
| VV 705 | 1120138-001, 002 | 2008 Jul 18 |
| IRAS 15250+3609 | 1122003-001, 002, 003, 004 | 2010 Jan 23 |
| IRAS 15335−0513 | 1120139-002 | 2008 Aug 15 |
| NGC 6090 | 1120140-001, 002 | 2008 Jul 23 |
| CGCG 052-037 | 1120141-001, 002 | 2008 Aug 27 |
| NGC 6285 | 1122138-001, 002, 003, 004 | 2010 Jan 28, 29 |
| NGC 6286 | 1122068-001, 002, 003, 004 | 2010 Jan 26, 27 |
| IRAS 17132+5313 | 1120143-001, 002 | 2008 Aug 20, 22 |
| NGC 6621 | 1122248-001, 002, 003, 004 | 2010 Jan 24, 25 |
| ESO 339-G011 | 1122264-002 | 2009 Oct 16 |
| NGC 7130 | 1122232-001, 002, 003 | 2009 Nov 10 |
| IC 5179 | 1122259-001 | 2009 Nov 15 |
| ESO 602-G025 | 1120144-001 | 2009 May 22 |
| UGC 12150 | 1122239-001, 002, 003, 004 | 2009 Dec 18, 19 |
| NGC 7469 | 1120055-001 | 2008 Jun 10 |
| CGCG 453-062 | 1120145-002 | 2008 Jun 16 |
| IC 5298 | 1120146-002 | 2008 Jun 22 |
| NGC 7592 | 1120147-002 | 2008 Dec 10 |
| NGC 7674 | 1120148-001 | 2008 Jun 17 |
| MCG−01-60-022 | 1122252-001, 002 | 2009 Dec 15, 16 |
| IRAS 23436+5527 | 1122216-001, 002, 003, 004 | 2010 Jan 14, 15, 16 |
| NGC 7771 | 1120149-002 | 2008 Dec 28 |
| Mrk 331 | 1120150-002 | 2008 Dec 28 |
| NGC 4418 | 1120010-002 | 2008 Jun 27 |
| NGC 1377 | 1120026-001, 002, 003 | 2009 Aug 10 |
Note. Column 1: object name. Column 2: observation ID. Column 3: observation date in UT.
Download table as: ASCIITypeset image
Table 4. AKARI IRC Observation log for ULIRGs
| Object | Observation ID | Observation Date |
|---|---|---|
| (1) | (2) | (3) |
| IRAS 00188−0856 | 1120008-001, 002, 003 | 2008 Jun 22 |
| IRAS 04103−2838 | 1120092-001, 002, 003 | 2008 Aug 14 |
| IRAS 10378+1108 | 1120155-001, 002 | 2009 May 28 |
| IRAS 10485−1447 | 1120156-001, 002, 003 | 2009 Jun 10, 11 |
| IRAS 11095−0238 | 1122075-001, 002 | 2009 Dec 12 |
| IRAS 11582+3020 | 1120088-001, 002, 003 | 2008 Jun 8 |
| IRAS 12032+1707 | 1120089-001, 002 | 2009 Jun 14 |
| IRAS 12112+0305 | 1120031-001, 002, 003 | 2009 Jun 22, 23 |
| IRAS 12127−1412 | 1120011-001, 002, 003 | 2008 Jun 30 |
| IRAS 12359−0725 | 1120159-001, 002 | 2008 Jul 3 |
| IRAS 13106−0922 | 1120090-001, 002 | 2008 Jul 13, 2009 Jan 9 |
| IRAS 13335−2612 | 1122077-001, 002, 003, 004 | 2010 Jan 22, 23 |
| IRAS 14348−1447 | 1120032-001, 002, 003 | 2008 Aug 2, 3 |
| IRAS 15327+2340 (Arp 220) | 1120017-001, 002, 003 | 2008 Aug 5, 6 |
| IRAS 16090−0139 | 1120162-001 | 2009 Feb 19 |
| IRAS 16300+1558 | 1120091-001, 002, 003 | 2008 Aug 25, 26 |
| IRAS 21329−2346 | 1120163-001, 002, 003 | 2008 Nov 10, 2009 May 8 |
| IRAS 00091−0738 | 1120036-001, 002, 003 | 2008 Jun 20, 2009 Jun 21 |
| IRAS 00397−1312 | 1120009-001, 002, 003 | 2009 Jun 25 |
| IRAS 01004−2237 | 1120094-002 | 2008 Dec 27 |
| IRAS 01166−0844 | 1120037-001, 002, 003 | 2008 Jul 5, 6 |
| IRAS 08201+2801 | 1120093-001, 002, 003 | 2008 Oct 25, 2009 Apr 21 |
| IRAS 13509+0442 | 1120168-001 | 2009 Jan 15 |
| IRAS 14060+2919 | 1120169-001, 002, 003 | 2008 Jul 9 |
| IRAS 15206+3342 | 1122082-001, 002, 003 | 2010 Jan 24, 25 |
| IRAS 15225+2350 | 1122017-001, 002, 003, 004 | 2010 Jan 30, 31 |
| IRAS 16474+3430 | 1120171-001 | 2009 Feb 20 |
| IRAS 20414−1651 | 1120172-001, 002 | 2009 Apr 28 |
| IRAS 22206−2715 | 1120096-001, 002, 003 | 2008 Nov 19 |
| IRAS 22491−1808 | 1120033-001, 002 | 2009 May 29 |
| IRAS 02021−2103 | 1120097-001, 002, 003 | 2008 Jul 11, 12 |
| IRAS 12018+1941 | 1120099-001, 002, 003 | 2008 Jun 13, 2008 Dec 14 |
| IRAS 14197+0813 | 1120174-001, 002, 003 | 2009 Jan 20, 21 |
| IRAS 14485−2434 | 1120175-001 | 2009 Aug 11 |
| IRAS 08559+1053 | 1120183-001, 002, 1122088-001, 002 | 2009 May 4, 2009 Nov 5 |
| IRAS 11223−1244 | 1122085-001, 002, 003 | 2009 Dec 18, 19 |
| IRAS 12072−0444 | 1120184-001, 002, 003 | 2009 Jun 25 |
| IRAS 13305−1739 | 1120185-001, 002, 003 | 2008 Jul 21, 2009 Jul 20 |
| IRAS 13428+5608 (Mrk 273) | 1100273-001 | 2007 Jun 8 |
| IRAS 13443+0802 | 1120186-001, 002 | 2009 Jan 11 |
| IRAS 13451+1232 (PKS 1345+12) | 1120187-001, 002, 003 | 2009 Jan 11, 2009 Jul 12 |
| IRAS 15001+1433 | 1122087-001, 002, 003, 004 | 2010 Jan 27, 28 |
| IRAS 15130−1958 | 1120189-001, 002, 003 | 2009 Aug 14 |
| IRAS 16156+0146 | 1120190-001, 002, 003 | 2009 Aug 25 |
| IRAS 22541+0833 | 1120182-001, 002, 003 | 2008 Jun 8, 9 |
| IRAS 23060+0505 | 1120005-001 | 2008 Jun 11 |
| IRAS 23233+2817 | 1120191-001, 002, 003 | 2009 Jun 26, 27 |
| IRAS 23389+0300 | 1120192-001, 002 | 2008 Jun 18 |
| IRAS 00183−7111 | 1100137-001 | 2007 May 2 |
| IRAS 06035−7102 | 1100130-001 | 2007 Mar 11 |
| IRAS 20100−4156 | 1122001-001, 002 | 2009 Oct 19, 20 |
| IRAS 20551−4250 | 1120003-001, 002, 003 | 2008 Oct 28, 2009 Apr 23 |
| IRAS 23128−5919 | 1100294-001 | 2007 May 10 |
| IRAS 12540+5708 (Mrk 231) | 1100271-001 | 2007 May 30 |
Note. Column 1: object name. Column 2: observation ID. Column 3: observation date in UT.
Download table as: ASCIITypeset image
Spectral analysis was performed in a standard manner, using the IDL package prepared for the reduction of AKARI IRC spectra. The actual software packages used for our data reduction were "IRC Spectroscopy Toolkit for Phase 3 data Version 20090211" for phase 3 data and "IRC Spectroscopy Toolkit Version 20090211" for data collected during phases 1 and 2, both of which can be found at http://www.ir.isas.jaxa.jp/ASTRO-F/Observation/DataReduction/IRC/. Further details concerning these data analysis tools can be found in Ohyama et al. (2007). Each frame was dark-subtracted, linearity-corrected, and flat-field-corrected. Many LIRGs display clear signals of spatially extended emission. We varied the aperture sizes for spectral extraction, depending on the actual signal profile of each source. The background signal level was estimated from data points on both sides, or in some cases only one side of the object position, in the direction perpendicular to the spectral dispersion direction of AKARI IRC, and was subtracted. Wavelength and flux calibrations were made with the data analysis toolkits. According to Ohyama et al. (2007), the wavelength calibration accuracy is ∼1 pixel or ∼0.01 μm. The absolute flux calibration accuracy is ∼10% at the central wavelength of the spectra and can be as large as ∼20% at the edge of the NG spectra (close to 2.5 μm and 5.0 μm). To reduce the scatter of the data points, appropriate binning of spectral elements was performed, particularly for faint sources.
4. RESULTS
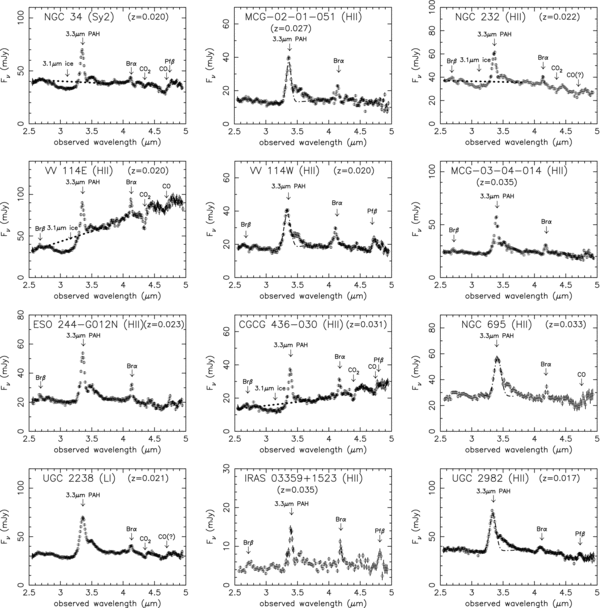
Figures 1 and 2 show the AKARI IRC infrared 2.5–5 μm spectra of the LIRGs and ULIRGs, respectively. For the LIRGs VV 114, Arp 299 (IC 694 + NGC 3690), NGC6285/6, and NGC 7592, the spectra of both the double nuclei are of adequate quality, and so the individual spectra are plotted separately. For ESO 244-G012, IC 2810, VV 250, and NGC 5256, only the spectra of the N, NW, SE, and SW nuclei, respectively, are shown. For VV 705 and IRAS 17132+5313, the spectra of combined emission from the S + N and W + E nuclei, respectively, are extracted and displayed. In total, the spectra of 64 LIRG nuclei and 54 ULIRGs are shown, more than tripling the number of available AKARI IRC 2.5–5 μm LIRG and ULIRG spectra (Imanishi et al. 2008).
Download figure:
Standard image High-resolution image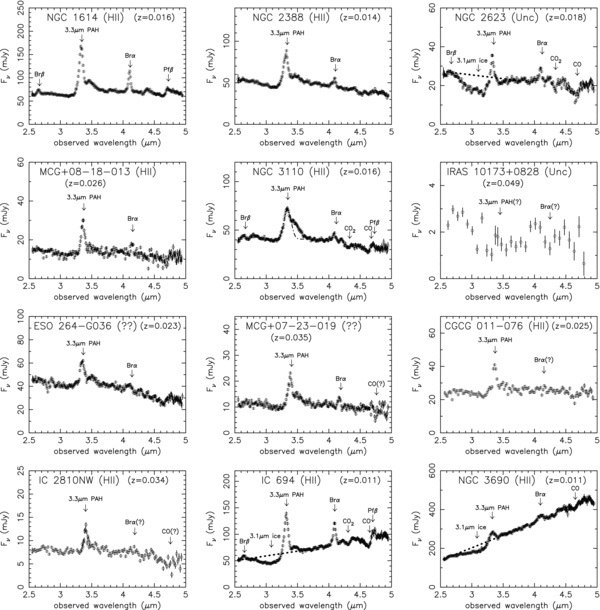
Download figure:
Standard image High-resolution image
Download figure:
Standard image High-resolution image
Download figure:
Standard image High-resolution image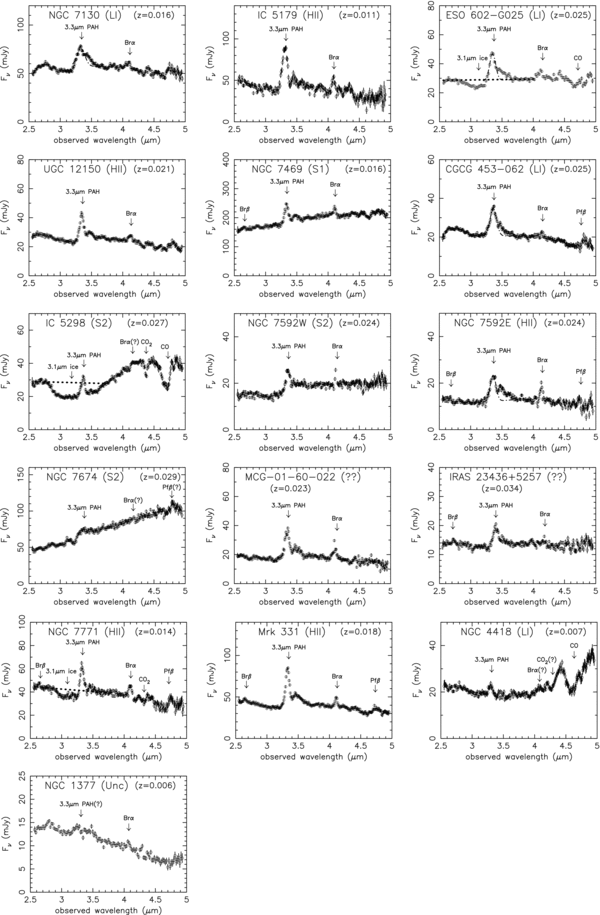
Figure 1. AKARI IRC infrared 2.5–5 μm spectra of LIRGs. The abscissa is the observed wavelength in μm and the ordinate is the flux Fν in mJy. For each object, the optical classification and redshift are shown. "LI," "H ii," "S2," "S1," "Unc," and "?" denote LINER, H ii region, Seyfert 2, Seyfert 1, unclassified, and no optical classification, respectively. The dotted lines indicate the continuum levels for measuring the optical depths of the broad 3.1 μm H2O ice absorption features. The expected wavelengths of the 3.3 μm PAH emission features and Brα emission lines (λrest = 4.05 μm) are indicated for all sources, provided they are covered by λobs< 4.8 μm in the observed frame. The expected wavelengths of Brβ emission (λrest = 2.63 μm), Pfβ emission (λrest = 4.65 μm), and Pfγ emission (λrest = 3.74 μm), as well as the broad 3.1 μm H2O ice absorption, 3.4 μm bare carbonaceous dust absorption, 4.26 μm CO2 absorption, and 4.67 μm CO absorption features, are also added for clearly detected sources. For sources whose 3.3 μm PAH emission and 3.4 μm PAH sub-peak are highly blended, our adopted choices of the 3.3 μm PAH peak components are shown as dashed–dotted lines. In MCG−03-34-064 (an optical Seyfert 2), the [Mg iv] line at λrest = 4.487 μm is detected and indicated. The "?" indicates that detection is unclear.
Download figure:
Standard image High-resolution image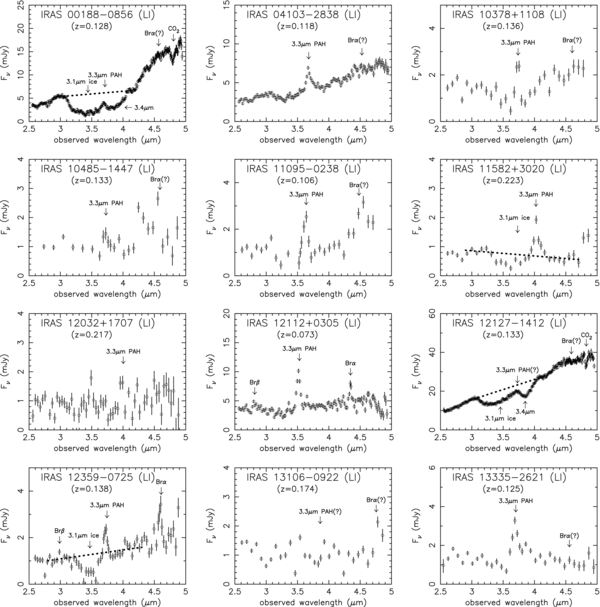
Download figure:
Standard image High-resolution image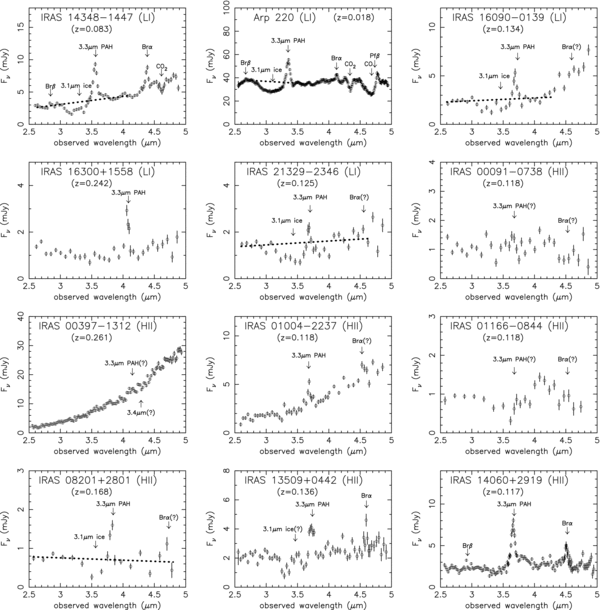
Download figure:
Standard image High-resolution image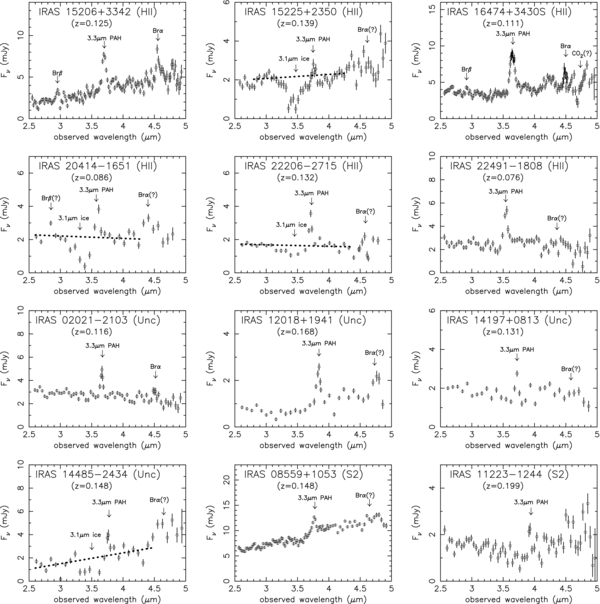
Download figure:
Standard image High-resolution image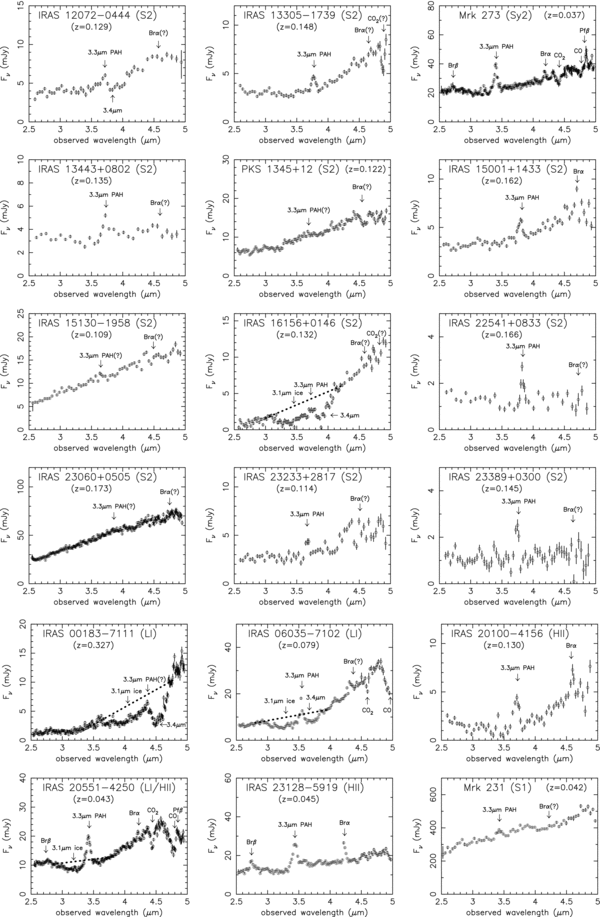
Figure 2. AKARI IRC infrared 2.5–5 μm spectra of ULIRGs. Symbols are the same as in Figure 1.
Download figure:
Standard image High-resolution imageIn Figures 1 and 2, the 3.3 μm PAH emission features are detected at λobs ∼ (1 + z) × 3.29 μm in the observed frame, for the majority of the observed sources.7 To estimate the strengths of the 3.3 μm PAH emission features of LIRGs, caution must be exercised. Unlike ULIRGs (the 2.5–5 μm emission of which is usually spatially compact), many LIRGs exhibit spatially extended emission components. For such spatially extended sources, the profiles of the 3.3 μm PAH emission features are broadened in comparison with intrinsic ones in AKARI IRC slit-less spectra, because signals from spatially different positions fall into different array positions along the spectral dispersion directions. Accordingly, although the 3.3 μm PAH emission features and the 3.4 μm PAH sub-peaks (Tokunaga et al. 1991) should be resolvable at the AKARI IRC spectral resolution of R ∼ 120 (as is the case for LIRGs dominated by spatially compact components, such as NGC 34 and NGC 7469), these features are sometimes spectrally blended, particularly for spatially extended LIRGs (e.g., UGC 2982 and NGC 3110). Thus, we let the width of the 3.3 μm PAH emission feature be a free parameter. Nevertheless, for distant, compact ULIRGs with weak PAH emission, we assume the intrinsic 3.3 μm PAH profile (type A of Tokunaga et al. 1991) to estimate the PAH strength or its upper limit. We exclude the 3.4 μm PAH sub-peak from the 3.3 μm PAH emission strength by fitting the PAH emission after removing the data points at the 3.4 μm shoulders, because the 3.3 μm PAH emission strength has been estimated and calibrated only for the 3.3 μm main components in many earlier works (Mouri et al. 1990; Imanishi & Dudley 2000; Imanishi et al. 2006a). We assume a single Gaussian component for the 3.3 μm PAH emission feature. Tables 5 and 6 summarize the fluxes, luminosities, and rest-frame equivalent widths (EW3.3 PAH) of the 3.3 μm PAH emission features of the LIRGs and ULIRGs, respectively.
The power of AKARI IRC slit-less spectroscopy as a tool for probing all the emission from a galaxy is highlighted in the LIRG NGC 7469. NGC 7469 has a Seyfert 1 nucleus at the center, with ring-shaped, spatially extended (1''–2''in radius) surrounding circumnuclear starburst activity (Soifer et al. 2003; Galliano et al. 2005; Diaz-Santos et al. 2007; Reunanen et al. 2010). In a ground-based slit spectrum with an aperture width ∼1'', only the nuclear emission was probed and no 3.3 μm PAH emission was detected (Imanishi & Wada 2004). However, our AKARI IRC slit-less spectrum of NGC 7469 clearly recovers the 3.3 μm PAH emission feature from the spatially extended starburst ring (Figure 1).
In many LIRGs and bright ULIRGs, Brα emission at λrest = 4.05 μm is clearly visible, primarily because of their high signal-to-noise ratios (S/N) in the continua. For sources with particularly strong Brα emission, Brβ emission at λrest = 2.63 μm is often discernible. Those emission lines above the linear continuum levels determined from data points of the shorter and longer wavelength components are fit with single Gaussian profiles. The central wavelength and normalization are chosen as free parameters for both the Brα and Brβ emission. The line width is taken to be a free parameter for the Brα lines, but given the faintness of the Brβ emission, we assume that the line width of Brβ is the same as that of Brα in velocity. The estimated fluxes and luminosities of these Br emission lines are listed in Tables 7 and 8, respectively, for LIRGs and ULIRGs for which the strengths of the Brα emission lines are estimated with reasonable accuracy in the AKARI IRC R ∼ 120 spectra. The calibration uncertainties of AKARI IRC spectra become large when λobs > 4.8 μm. Hence, the strengths of the Brα emission redshifted into (or close to) this wavelength could be quantitatively uncertain and are not discussed. The signatures of Pfβ lines at λrest = 4.65 μm are recognizable in many LIRGs and ULIRGs, but the flux estimates could be uncertain because the Pfβ emission lines spectrally overlap with the 4.67 μm CO absorption features in AKARI IRC spectra with R ∼ 120. Pfγ emission at λrest = 3.74 μm is intrinsically much weaker than Brα (Pfγ/Brα∼ 0.15 for 104 K case B; Wynn-Williams 1984), and its signature is clearly seen only in the LIRG Arp 193. Pfβ and Pfγ emission lines are not discussed in detail.
Another prominent feature detected in the AKARI IRC 2.5–5 μm spectra of LIRGs and ULIRGs is a broad H2O ice absorption feature, caused by ice-covered dust grains, centered at λrest = 3.05–3.1 μm and extending from λrest ∼ 2.75 μm to ∼3.55 μm. This H2O ice absorption feature is detected in many of the observed LIRGs and ULIRGs. Because of the 3.4 μm PAH sub-peaks, the continuum level at the shorter wavelength side of the 3.3 μm PAH emission could be depressed in comparison to that on the longer wavelength side, even in the absence of the 3.1 μm H2O ice absorption feature. Thus, it is important to use data points with λrest > 3.5 μm as the longer wavelength side of the continuum level, to determine the optical depth of the 3.1 μm H2O ice absorption feature (τ3.1). In the AKARI IRC 2.5–5 μm spectra, because data points with wavelengths as short as λobs = 2.5 μm are covered, the continuum level on the shorter wavelength side of the 3.1 μm H2O ice absorption feature is well determined. We assume linear continuum levels determined from data points at λrest < 2.75 μm and λrest > 3.55 μm and unaffected by other absorption and emission lines. The adopted continuum levels are shown as dotted lines in Figures 1 and 2, for sources with clearly detectable 3.1 μm H2O ice absorption features. Table 9 summarizes the estimated τ3.1 for clearly detected sources.
Other absorption features are also clearly detected in a fraction of the LIRGs and ULIRGs. Examples include the 3.4 μm bare carbonaceous dust, 4.26 μm CO2, and 4.67 μm CO absorption features. For these absorption features, linear continua are determined from data points of shorter and longer wavelength parts that are free of other obvious emission and absorption features. Unlike the very broad 3.1 μm H2O ice absorption feature, these absorption features are relatively thinner, so that continuum determination is less ambiguous. The observed optical depths of these absorption features (τ3.4, τCO2, and τCO) are summarized in Table 9 for detected sources.
The CO absorption feature shows a relatively narrow profile around λrest = 4.67 μm in a solid phase (Chiar et al. 1998). However, gas-phase CO displays many sharp absorption features (v = 1–0), extending from 4.58–4.66 μm (R-branch) and 4.675–4.73 μm (P-branch), when the rotational level is <10 (Mitchell et al. 1989; Moneti et al. 2001). In the AKARI IRC low-resolution (R ∼ 120) spectra, these sharp absorption features are widened and overlap each other, resulting in two broad absorption peaks in the P- and R-branches (Spoon et al. 2004; Imanishi et al. 2008; Imanishi 2009). When the XCN (λrest = 4.62 μm) absorption feature and the Pfβ (λrest = 4.65 μm) emission line are superimposed on the broad 4.67 μm CO absorption feature in a similar wavelength range, it is not easy to disentangle these features in the AKARI IRC low-resolution spectra. Furthermore, in AKARI IRC spectra, systematic uncertainty can become large when λobs > 4.8 μm. For these reasons, an estimate of τCO is only attempted when the CO absorption feature is clearly detected and the redshifted CO absorption profile is below λobs = 4.8 μm.
Sources with detectable 4.26 μm CO2 absorption features usually display strong 3.1 μm H2O ice absorption features as well (Figures 1 and 2), as seen in the Galactic highly obscured sources (Gibb et al. 2004). CO2 molecules cannot be efficiently formed in gas-phase reactions (Herbst & Leung 1986), but can be through UV photolysis of dust grains covered with an ice mantle (d'Hendecourt et al. 1986). Thus, the coincidence of CO2 and H2O ice absorption features seems reasonable (Pontoppidan et al. 2008).
The LIRG and ULIRG spectra shown in Figures 1 and 2 exhibit a variety of continuum slopes, ranging from a nearly flat spectral shape to a red, steeply rising continuum with increasing wavelength. One may argue that the infrared 2.5–5 μm continuum slope can also be used as an energy diagnostic tool for galaxies, in that a very red continuum is the signature of an obscured AGN (Risaliti et al. 2006, 2010; Sani et al. 2008). Thus, we estimate the continuum slope Γ (Fν ∝λΓ), using data points unaffected by absorption features (broad 3.1 μm H2O ice, 3.4 μm bare carbonaceous dust, 4.26 μm CO2, and 4.67 μm CO) and emission features (3.3 μm and 3.4 μm PAH and hydrogen recombination lines, such as 4.05 μm Brα, 2.63 μm Brβ, 4.65 μm Pfβ, and 3.74 μm Pfγ). The estimated Γ values for the LIRGs and ULIRGs observed in this paper are listed in Tables 5 and 6 (Column 7), respectively. In Table 10, we also estimate the Γ values of ULIRGs previously observed with AKARI IRC by Imanishi et al. (2008). A small fraction of sources (e.g., IRAS 15250+3609 and 13305−1739) exhibit a break in the continuum slope, in such a way that the continuum emission is flat (blue) in the shorter wavelength component of the AKARI IRC 2.5–5 μm spectrum, but rises steeply (red) in the longer wavelength component (Figures 1 and 2). This behavior could be explained if the longer wavelength components are dominated by hot (T = 100–1000 K) dust emission heated by obscured energy sources, while weakly obscured starburst-related (stellar photospheric and/or starburst heated dust) emission contributes to the shorter wavelength components of the AKARI IRC 2.5–5 μm spectra. We estimate the Γ values for these sources from the continuum slopes in the longer wavelength regions.
We note that our continuum slope Γ is defined by Fν ∝ λΓ, whereas it was defined by Fλ ∝ λΓ in earlier research (Risaliti et al. 2006, 2010; Sani et al. 2008). Thus, the values of our Γours differ from the Γprev values reported in previous papers in accordance with Γours = Γprev + 2. The wider wavelength coverage of AKARI IRC (2.5–5 μm) is superior to the limited wavelength coverage of the ground-based L-band (2.8–4.2 μm) and M-band (4.5–5.0 μm) spectra for obtaining precise estimates of the continuum slope. For sources with strong 3.1 μm ice absorption features, although the continuum level must be determined outside this broad absorption feature (λrest = 2.8–3.5 μm), the task is not readily accomplished using ground-based spectra. An example is the ULIRG IRAS 00188−0856. Our AKARI spectrum provides a reliable Γ estimate by covering the continuum emission on both the shorter and longer wavelength sides of the broad 3.1 μm H2O ice absorption feature. However, with the ground-based spectrum, the continuum slope was estimated using data points inside the broad 3.1 μm H2O ice absorption feature (Risaliti et al. 2010).
5. DISCUSSION
5.1. Modestly Obscured Starbursts
Based on the recently estimated dust extinction curve (Nishiyama et al. 2008, 2009), the amount of dust extinction at 3.3 μm is as small as ∼1/30 of that in the optical V band (λ = 0.55 μm). This indicates that the flux attenuation of the 3.3 μm PAH emission is not significant (a factor of <2.5) if the dust extinction AV is less than 30 mag. For this reason, the observed 3.3 μm PAH emission luminosities roughly map out the intrinsic luminosities of modestly obscured (AV < 30 mag) PAH-emitting normal starburst activity.
The relationship L3.3 PAH/LIR ∼ 10−3 has been used for this purpose (Mouri et al. 1990; Imanishi 2002). Mouri et al. (1990) observed a limited number of starburst galaxies, and in most of these, not all of the starburst regions were covered by their apertures. The proportion L3.3 PAH/LIR ∼ 10−3 was derived after aperture correction. The aperture correction was based on the ratio of the infrared aperture size to the optical extent of each galaxy, which could entail an uncertainty. Imanishi (2002) supported the proportion L3.3 PAH/LIR∼ 10−3 for starbursts on the basis of the rough agreement of 3.3 μm PAH-derived starburst luminosities (without a dust extinction correction) and UV-derived starburst luminosities (with a dust extinction correction) in three Seyfert galaxies. For the prototypical starburst galaxy M82, Satyapal et al. (1995) argued that the proportion L3.3 PAH/LIR ∼ 0.8 × 10⁻³ holds, once the effects of dust extinction have been corrected. We now have AKARI IRC slit-less spectra for a large number of LIRGs, many of which may be starburst-dominated, without strong AGN signatures in the infrared range. Because the 3.3 μm PAH emission from spatially extended starburst regions of LIRGs should be covered in the AKARI IRC slit-less spectra, we can use observational data to directly test the validity of the proportion L3.3 PAH/LIR ∼ 10−3 for estimating intrinsic starburst luminosity, without introducing a potentially uncertain aperture correction.
Figure 3 compares the 3.3 μm PAH emission luminosities measured with ground-based slit spectroscopy and AKARI IRC slit-less spectroscopy. For ULIRGs (Figure 3(a)), the two sets of measurements roughly agree, with some scatter (partly originating from measurement errors for faint sources), as expected from the physically compact nature of the infrared emission of ULIRGs in general (<300 pc; Soifer et al. 2000), and their relatively large distances. The largest discrepancy among the 3.3 μm PAH luminosity measurements is found in Mrk 231 (z = 0.042), one of the nearest ULIRGs in the sample, as indicated in the figure. Mrk 231 exhibits spatially extended starburst activity (Krabbe et al. 1997), the bulk of which can be missed with ground-based narrow-slit (<1''–2''wide) spectroscopy, because of the large apparent extension resulting from its proximity. However, except for the nearest ULIRG, Figure 3(a) suggests that the bulk of the 3.3 μm PAH emission from ULIRGs can be recovered effectively from ground-based narrow-slit spectra.
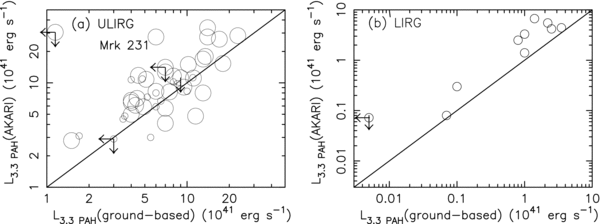
Figure 3. (a) Comparison of the 3.3 μm PAH luminosities measured with ground-based slit spectra (abscissa) and AKARI IRC slit-less spectra (ordinate) for ULIRGs for which both AKARI and ground-based spectra at 3–4 μm are available (Imanishi & Dudley 2000; Imanishi et al. 2001, 2006a, 2007b, 2008; Risaliti et al. 2003). ULIRGs newly observed in this paper are represented by large open circles. ULIRGs previously observed with AKARI IRC (Imanishi et al. 2008) are plotted as small open circles. For Mrk 231, Arp 220, and IRAS 08572+3915, more than one set of independent ground-based 3–4 μm spectroscopic observations are available (Imanishi et al. 2006a, 2007b). Larger 3.3 μm PAH luminosities are adopted. The largest outlier is Mrk 231 (marked as Mrk 231), one of the closest ULIRGs. See Section 5.1 for an explanation of the discrepancy. (b) Comparison of the 3.3 μm PAH luminosities measured with ground-based slit spectra (abscissa) and AKARI IRC slit-less spectra (ordinate) for LIRGs for which both AKARI and ground-based spectra at 3–4 μm are available. The plotted LIRGs with available ground-based 3–4 μm slit spectra are VV 114E, NGC 2623, IC 694, NGC 3690, IC 860, Arp 193, NGC 5256 (Mrk 266) SW, IRAS 15250+3609, NGC 4418, and NGC 1377 (Imanishi et al. 2004, 2007b, 2009; Imanishi 2006; Imanishi & Nakanishi 2006).
Download figure:
Standard image High-resolution imageFigure 3(b) compares the 3.3 μm PAH luminosity measurements obtained from ground-based narrow-slit spectroscopy and AKARI IRC slit-less spectroscopy for LIRGs. The AKARI IRC measurements are systematically larger, which is reasonable because the infrared emission from LIRGs is, in most cases, spatially extended (up to ∼ kpc; Soifer et al. 2001), and LIRGs are generally closer than ULIRGs, so that their apparent spatial extensions are also larger.
Figure 4 compares the rest-frame equivalent widths of the 3.3 μm PAH emission features (EW3.3 PAH) measured by ground-based slit spectroscopy and AKARI IRC slit-less spectroscopy. If the 3.3 μm PAH emission properties do not exhibit substantial spatial variation, the EW3.3 PAH values are less susceptible to aperture effects. For ULIRGs, the two sets of measurements roughly agree, with some scatter, part of which may originate from measurement errors for faint sources (Figure 4(a)). The LIRGs plotted in Figure 4(b) are generally bright, and so we do not expect large measurement errors. In Figure 4(b), many LIRGs display smaller EW3.3 PAH values in the AKARI IRC data. A possible explanation is that ground-based slit spectroscopy preferentially probes strongly PAH-emitting, very active nuclear starburst regions, while stellar photospheric continuum emission from inactive old stars (which lack PAH-exciting UV photons) in the outer regions of galaxies may contribute to the AKARI IRC slit-less spectra and reduces the EW3.3 PAH values.
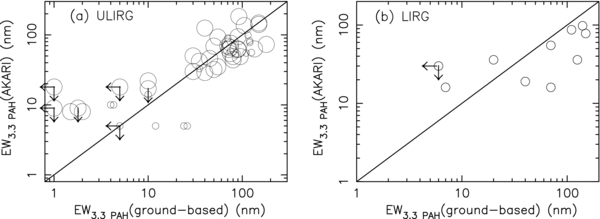
Figure 4. (a) Comparison of rest-frame 3.3 μm PAH equivalent widths (EW3.3 PAH), measured with ground-based slit spectra (abscissa) and AKARI IRC slit-less spectra (ordinate) for ULIRGs for which EW3.3 PAH values have been estimated with both AKARI IRC and ground-based spectra (Imanishi et al. 2006a; Risaliti et al. 2006; Sani et al. 2008). The additional interesting sources in the last rows of Tables 1 and 2 are also included, provided the EW3.3 PAH values are estimated with ground-based slit spectra. For Arp 220, Mrk 231, IRAS 05189−2524, IRAS 23060+0505, IRAS 20551−4250, and Superantennae, EW3.3 PAH values are estimated with more than one independent reference (Imanishi & Dudley 2000; Risaliti et al. 2003, 2006; Imanishi et al. 2006a, 2007b; Sani et al. 2008). Both values are plotted. For IRAS 12112+0305, 14348−1447, and 12072−0444, EW3.3 PAH values are separately estimated for individual nuclei using ground-based slit spectra (Imanishi et al. 2006a; Risaliti et al. 2006), but are estimated for the combined emission of both nuclei with AKARI IRC spectra. These three sources are not plotted. (b) Comparison of EW3.3 PAH values measured with ground-based slit spectra (abscissa) and AKARI IRC slit-less spectra (ordinate) for LIRGs for which EW3.3 PAH values are estimated with both AKARI IRC and ground-based spectra (Imanishi et al. 2004, 2007b, 2009; Imanishi 2006; Imanishi & Nakanishi 2006). For NGC 3690, we assume that NGC 3690 B strongly dominates NGC 3690 C in the AKARI IRC spectrum (Imanishi & Nakanishi 2006).
Download figure:
Standard image High-resolution imageIn Figure 5(a), the observed ratios of 3.3 μm PAH to infrared luminosity (L3.3 PAH/LIR) for starburst-classified LIRGs (i.e., no AGN signatures in the AKARI IRC 2.5–5 μm spectra; see next subsection) are represented by open circles. The upper bound of the L3.3 PAH/LIR distribution for these starburst-classified LIRGs is indeed ∼10−3. We have now obtained direct evidence from AKARI IRC slit-less spectroscopic observations that the relationship L3.3 PAH/LIR = 10−3 is appropriate for quantitatively estimating the intrinsic power of modestly obscured starburst activity.
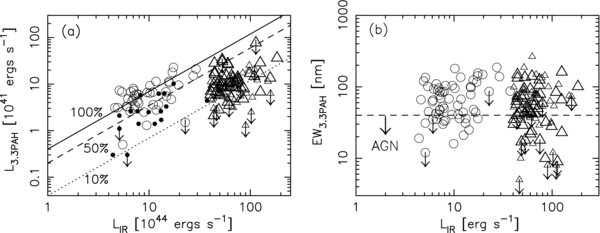
Figure 5. (a) Comparison of the observed infrared luminosity (abscissa) and 3.3 μm PAH luminosity (ordinate) in LIRGs and ULIRGs. Open circles: LIRGs without obvious AGN signatures in the AKARI IRC 2.5–5 μm spectra. Filled circles: LIRGs with AGN signatures in the AKARI IRC spectra (EW3.3 PAH < 40 nm). Large triangles: ULIRGs observed in this paper. Small triangles: ULIRGs studied by Imanishi et al. (2008). The additional interesting sources in the last rows of Tables 1 and 2 are excluded from this plot, to observe the overall statistical trend in an unbiased manner. For LIRGs with multiple nuclei, the L3.3 PAH/LIR ratios are derived by combining the emission from all the nuclei. An exception is Arp 299, for which the data from the IC 694 and NGC 3690 nuclei are plotted separately, because the infrared luminosities from these individual nuclei are estimated (Joy et al. 1989; Charmandaris et al. 2002). The solid line represents L3.3 PAH/LIR = 10−3 (i.e., 100% of the infrared luminosities of galaxies could be accounted for by modestly obscured starburst activity probed by the 3.3 μm PAH emission). The dashed and dotted lines represent L3.3 PAH/LIR = 0.5 × 10⁻³ and 0.1 × 10⁻³, respectively (in which 50% and 10% of the infrared luminosities could be explained by 3.3μm PAH-probed starburst activity). (b) Comparison of infrared luminosity (abscissa) and the rest-frame equivalent width of the 3.3 μm PAH emission (EW3.3 PAH) (ordinate). Open circles: LIRGs. Large triangles: ULIRGs observed in this paper. Small triangles: ULIRGs studied by Imanishi et al. (2008). The horizontal dashed line represents EW3.3 PAH = 40 nm, below which strong contributions from the PAH-free continua of the AGNs to the observed AKARI IRC 2.5–5 μm spectra are suggested. For sources with multiple nuclei, the EW3.3 PAH values of individual nuclei are plotted separately, but the LIR values are the total luminosities of the combined nuclei. Again, Arp 299 is the exception, for which the LIR values for the individual IC 694 and NGC 3690 nuclei are derived (Joy et al. 1989; Charmandaris et al. 2002). The additional interesting sources are excluded.
Download figure:
Standard image High-resolution imageThe L3.3 PAH/LIR ratios of LIRGs and ULIRGs are summarized in Column 4 of Tables 5 and 6, respectively. Figure 5(a) shows a plot of the L3.3 PAH/LIR ratios of the observed LIRGs and ULIRGs. As the figure indicates, the majority of starburst-classified LIRGs are distributed between the 50% and 100% lines, suggesting that the bulk of the infrared luminosities could be explained by PAH-probed modestly obscured starburst activity. On the other hand, only a very small fraction of the ULIRGs are above the 50% line. At face value, PAH-probed modestly obscured starbursts alone are insufficient to account for the large infrared luminosities of most ULIRGs. We note that the quality of the AKARI IRC 2.5–5 μm spectra of most of the LIRGs is high, because their relative proximity permits high continuum flux and high S/N to be achieved. For these objects, the 3.4 μm PAH sub-peaks are separated from the 3.3 μm PAH main peaks, and the contributions from the 3.4 μm PAH sub-peaks are removed from the final L3.3 PAH values. ULIRGs are generally fainter than LIRGs at infrared 2.5–5 μm, simply because of the larger overall distances, and hence it is sometimes difficult to separate the 3.3 μm PAH peak and the 3.4 μm PAH sub-peak. Thus, the 3.4 μm PAH sub-peaks may contribute to the derived L3.3 PAH values for some fraction of ULIRGs. This possible ambiguity may even reduce the true L3.3 PAH/LIR ratios for ULIRGs. The implied trend of the 3.3 μm PAH luminosity suppression in ULIRGs is therefore robust.
Table 5. The 3.3 μm PAH Emission, Continuum Slopes, and AGN Signatures of LIRGs Derived from AKARI IRC Spectra
| Object | f3.3 PAH | L3.3 PAH | L3.3 PAH/LIR | Rest EW3.3 PAH | AGN | Continuum | Obscured |
|---|---|---|---|---|---|---|---|
| (×10−14 ergs s−1 cm−2) | (×1041 ergs s−1) | (×10−3) | (nm) | Sign | Slope (Γ) | AGN Sign | |
| (1) | (2) | (3) | (4) | (5) | (6) | (7) | (8) |
| NGC 34 | 45.6 | 3.6 | 0.32 | 41 | X | −0.1 | X |
| MCG−02-01-051 | 63.6 | 9.2 | 0.91 | 180 | X | −0.1 | X |
| NGC 232 | 32.6 | 2.6 | 0.33 | 30 | ◯ | −0.2 | X |
| VV 114E (IC 1623A) | 53.6 | 4.2 | 0.24 | 36 | ◯ | 1.7 | ◯ |
| VV 114W (IC 1623B) | 74.5 | 5.9 | 0.34 | 156 | X | 0.04 | X |
| MCG−03-04-014 | 72.7 | 17.9 | 1.1 | 116 | X | −0.1 | X |
| ESO 244-G012 (N) | 63.1 | 6.6 | 0.69 | 104 | X | 0.07 | X |
| CGCG 436-030 | 24.2 | 4.7 | 0.28 | 44 | X | 0.9 | X |
| NGC 695 | 104.2 | 22.8 | 1.3 | 142 | X | −0.3 | X |
| UGC 2238 | 92.5 | 8.0 | 1.1 | 96 | X | 0.1 | X |
| IRAS 03359+1523 | 11.4 | 2.8 | 0.24 | 67 | X | 0.7 | X |
| UGC 2982 | 129.9 | 7.3 | 1.4 | 135 | X | −0.05 | X |
| NGC 1614 | 228.7 | 11.4 | 0.73 | 124 | X | 0.3 | X |
| NGC 2388 | 86.1 | 3.3 | 0.55 | 62 | X | −0.4 | X |
| NGC 2623 | 21.5 | 1.4 | 0.12 | 36 | ◯ | −0.3 | X |
| MCG+08-18-013 | 32.0 | 4.3 | 0.63 | 90 | X | −0.08 | X |
| NGC 3110 | 121.1 | 6.8 | 1.0 | 110 | X | −0.2 | X |
| IRAS 10173+0828 | <2.9 | <1.5 | <0.07 | <86 | X | −0.8 | X |
| ESO 264-G036 | 46.0 | 4.8 | 0.68 | 41 | X | −0.3 | X |
| MCG+07-23-019 | 27.7 | 6.8 | 0.46 | 100 | X | −0.1 | X |
| CGCG 011-076 | 34.9 | 4.3 | 0.56 | 53 | X | 0.2 | X |
| IC 2810 (NW) | 7.5 | 1.7 | 0.13 | 36 | ◯ | −0.1 | X |
| IC 694 | 142.3 | 3.3 | 0.23 | 78 | X | 1.05 | ◯ |
| NGC 3690 | 107.7 | 2.5 | 0.26 | 16 | ◯ | 1.9 | ◯ |
| IRAS 12224−0624 | <2.2 | <0.3 | <0.05 | <35 | ◯ | −1.0 | X |
| ESO 507-G070 | 29.3 | 2.5 | 0.29 | 68 | X | −0.4 | X |
| NGC 5010 | 65.2 | 1.3 | 0.13 | 41 | X | −0.2 | X |
| IC 860 | 9.1 | 0.3 | 0.07 | 19 | ◯ | −0.7 | X |
| VV 250 (UGC 8335) (SE) | 49.3 | 9.5 | 0.48 | 148 | X | 0.7 | X |
| Arp 193 (UGC 8387) | 52.6 | 5.5 | 0.37 | 98 | X | 0.5 | X |
| NGC 5104 | 30.2 | 2.1 | 0.42 | 31 | ◯ | −0.7 | X |
| MCG−03-34-064 | <18.2 | <1.1 | <0.21 | <12 | ◯ | 1.5 | ◯ |
| NGC 5135 | 67.1 | 2.6 | 0.39 | 35 | ◯ | 0.4 | X |
| NGC 5256 (Mrk 266) (SW) | 43.1 | 6.7 | 0.62 | 55 | X | −0.1 | X |
| ESO 221-IG010 | 168.3 | 6.8 | 1.2 | 101 | X | −0.3 | X |
| CGCG 247-020 | 25.6 | 3.4 | 0.47 | 69 | X | 0.01 | X |
| VV 340 | 48.9 | 10.7 | 0.68 | 48 | X | −0.2 | X |
| CGCG 049-057 | 16.6 | 0.5 | 0.10 | 45 | X | −0.5 | X |
| VV 705 (S+N) | 44.2 | 15.1 | 0.55 | 187 | X | 0.3 | X |
| IRAS 15250+3609 | 7.1 | 4.4 | 0.12 | 87 | X | 5.1 | ◯ |
| IRAS 15335−0513 | 19.7 | 2.6 | 0.41 | 42 | X | −0.2 | X |
| NGC 6090 | 63.4 | 11.4 | 0.98 | 136 | X | −0.04 | X |
| CGCG 052-037 | 53.4 | 6.1 | 0.81 | 84 | X | −0.1 | X |
| NGC 6285 | 21.4 | 1.5 | 0.21 | 85 | X | −0.4 | X |
| NGC 6286 | 60.4 | 4.3 | 0.59 | 48 | X | −0.1 | X |
| IRAS 17132+5313 (E+W) | 39.5 | 21.1 | 0.73 | 139 | X | 0.05 | X |
| NGC 6621 | 37.4 | 3.3 | 0.54 | 65 | X | −0.07 | X |
| ESO 339-G011 | 43.4 | 3.1 | 0.67 | 66 | X | 0.3 | X |
| NGC 7130 | 78.6 | 3.9 | 0.50 | 50 | X | −0.1 | X |
| IC 5179 | 134.2 | 3.1 | 0.64 | 120 | X | −0.2 | X |
| ESO 602-G025 | 59.2 | 7.3 | 1.0 | 76 | X | 0.1 | X |
| UGC 12150 | 33.3 | 2.9 | 0.41 | 47 | X | −0.4 | X |
| NGC 7469 | 125.8 | 6.3 | 0.44 | 25 | ◯ | 0.7 | X |
| CGCG 453-062 | 48.3 | 6.0 | 0.75 | 86 | X | −0.5 | X |
| IC 5298 | 17.8 | 2.6 | 0.20 | 31 | ◯ | 0.7 | X |
| NGC 7592 W | 16.2 | 1.8 | 0.23 | 34 | ◯ | 0.6 | X |
| NGC 7592 E | 34.6 | 3.9 | 0.48 | 104 | X | 0.05 | X |
| NGC 7674 | 37.1 | 6.2 | 0.50 | 21 | ◯ | 1.4 | ◯ |
| MCG−01-60-022 | 45.7 | 4.8 | 0.77 | 93 | X | −0.1 | X |
| IRAS 23436+5257 | 15.5 | 3.6 | 0.29 | 44 | X | 0.2 | X |
| NGC 7771 | 37.3 | 1.4 | 0.18 | 33 | ◯ | −0.4 | X |
| Mrk 331 | 100.9 | 6.4 | 0.63 | 95 | X | −0.3 | X |
| NGC 4418 | 8.2 | 0.08 | 0.02 | 16 | ◯ | −0.4 | X |
| NGC 1377 | <10.4 | <0.08 | <0.14 | <30 | ◯ | −0.9 | X |
Notes. Column 1: object name. Column 2: observed flux of the 3.3 μm PAH emission in 10−14 (ergs s−1 cm−2). Column 3: observed luminosity of the 3.3 μm PAH emission in 1041 (ergs s−1). Column 4: observed 3.3 μm PAH-to-infrared luminosity ratio in units of 10−3. Typical ratios for modestly obscured starbursts are ∼10−3 (Mouri et al. 1990; Imanishi 2002; Section 5.1 of this paper). Column 5: rest-frame equivalent width of the 3.3 μm PAH emission (EW3.3 PAH). The values for starbursts are typically ∼100 nm (Moorwood 1986; Imanishi & Dudley 2000). Column 6: AGN signatures from EW3.3 PAH. ◯: present (EW3.3 PAH < 40 nm). X: none (EW3.3 PAH ⩾ 40 nm). Column 7: continuum slope Γ (Fν ∝ λΓ). Larger Γ values mean redder continua in the AKARI IRC 2.5–5 μm spectra of Figures 1 and 2. Column 8: obscured AGN signatures from the continuum slope Γ. ◯: present (Γ > 1.0). X: none (Γ ⩽ 1.0).
Table 6. The 3.3 μm PAH Emission, Continuum Slopes, and AGN Signatures of ULIRGs Derived from AKARI IRC Spectra
| Object | f3.3 PAH | L3.3 PAH | L3.3 PAH/LIR | Rest EW3.3 PAH | AGN | Continuum | Obscured |
|---|---|---|---|---|---|---|---|
| (×10−14 ergs s−1 cm−2) | (×1041 ergs s−1) | (×10−3) | (nm) | Sign | Slope (Γ) | AGN Sign | |
| (1) | (2) | (3) | (4) | (5) | (6) | (7) | (8) |
| IRAS 00188−0856 | 2.1 | 8.0 | 0.09 | 32 | ◯ | 2.4 | ◯ |
| IRAS 04103−2838 | 4.8 | 15.0 | 0.26 | 46 | X | 1.5 | ◯ |
| IRAS 10378+1108 | 2.8 | 11.8 | 0.16 | 125 | X | 0.6 | X |
| IRAS 10485−1447 | 1.0 | 4.1 | 0.07 | 44 | X | 0.9 | X |
| IRAS 11095−0238 | 3.3 | 8.3 | 0.13 | 141 | X | 1.5 | ◯ |
| IRAS 11582+3020 | 2.3 | 28.7 | 0.24 | 161 | X | 0.2 | X |
| IRAS 12032+1707 | 1.1 | 13.5 | 0.09 | 61 | X | 0.1 | X |
| IRAS 12112+0305 | 10.2 | 11.6 | 0.16 | 105 | X | 0.6 | X |
| IRAS 12127−1412 | <7.5 | <30.5 | <0.65 | <18 | ◯ | 2.1 | ◯ |
| IRAS 12359−0725 | 2.1 | 9.1 | 0.17 | 76 | X | 1.3 | ◯ |
| IRAS 13106−0922 | <1.2 | <8.6 | <0.13 | <59 | X (?) | −0.6 | X |
| IRAS 13335−2612 | 4.6 | 16.5 | 0.37 | 133 | X | −0.2 | X |
| IRAS 14348−1447 | 8.6 | 12.7 | 0.17 | 79 | X | 1.2 | ◯ |
| Arp 220 | 43.4 | 2.8 | 0.06 | 49 | X | −0.1 | X |
| IRAS 16090−0139 | 4.1 | 16.9 | 0.14 | 66 | X | 1.4 | ◯ |
| IRAS 16300+1558 | 2.4 | 36.5 | 0.20 | 101 | X | 0.6 | X |
| IRAS 21329−2346 | 1.8 | 6.5 | 0.13 | 69 | X | 0.5 | X |
| IRAS 00091−0738 | <1.2 | <3.5 | <0.06 | <43 | X (?) | 0.3 | X |
| IRAS 00397−1312 | <6.7 | <122 | <0.37 | <24 | ◯ | 4.2 | ◯ |
| IRAS 01004−2237 | 3.4 | 10.8 | 0.15 | 50 | X | 2.8 | ◯ |
| IRAS 01166−0844 | <0.7 | <2.1 | <0.05 | <40 | ◯ | 0.1 | X |
| IRAS 08201+2801 | 1.2 | 8.5 | 0.12 | 70 | X | −0.3 | X |
| IRAS 13509+0442 | 3.6 | 15.3 | 0.23 | 63 | X | 0.5 | X |
| IRAS 14060+2919 | 9.2 | 28.3 | 0.64 | 148 | X | 0.4 | X |
| IRAS 15206+3342 | 7.7 | 27.5 | 0.46 | 93 | X | 1.8 | ◯ |
| IRAS 15225+2350 | 1.3 | 5.7 | 0.11 | 29 | ◯ | 0.3 | X |
| IRAS 16474+3430 (S) | 12.2 | 33.7 | 0.64 | 136 | X | −0.2 | X |
| IRAS 20414−1651 | 3.1 | 5.0 | 0.08 | 54 | X | 0.1 | X |
| IRAS 22206−2715 | 2.1 | 8.3 | 0.15 | 50 | X | −0.2 | X |
| IRAS 22491−1808 | 4.9 | 6.1 | 0.12 | 73 | X | −0.05 | X |
| IRAS 02021−2103 | 2.3 | 7.1 | 0.17 | 35 | ◯ | −0.4 | X |
| IRAS 12018+1941 | 2.2 | 14.6 | 0.13 | 84 | X | 0.95 | X |
| IRAS 14197+0813 | 2.1 | 8.2 | 0.21 | 63 | X | −0.3 | X |
| IRAS 14485−2434 | 3.5 | 17.9 | 0.43 | 69 | X | 1.7 | ◯ |
| IRAS 08559+1053 | 5.1 | 26.2 | 0.44 | 22 | ◯ | 1.2 | ◯ |
| IRAS 11223−1244 | 0.7 | 6.8 | 0.05 | 23 | ◯ | −0.2 | X |
| IRAS 12072−0444 | 1.3 | 4.8 | 0.06 | 10 | ◯ | 1.5 | ◯ |
| IRAS 13305−1739 | 2.0 | 10.2 | 0.17 | 24 | ◯ | 3.2 | ◯ |
| Mrk 273 | 24.8 | 6.8 | 0.15 | 42 | X | 0.6 | X |
| IRAS 13443+0802 | 3.6 | 15.1 | 0.29 | 43 | X | 0.3 | X |
| PKS 1345+12 | <4.2 | <14.1 | <0.19 | <18 | ◯ | 1.8 | ◯ |
| IRAS 15001+1433 | 2.7 | 17.0 | 0.17 | 28 | ◯ | 1.2 | ◯ |
| IRAS 15130−1958 | <4.3 | <11.2 | <0.26 | <17 | ◯ | 1.7 | ◯ |
| IRAS 16156+0146 | 2.5 | 9.9 | 0.23 | 57 | X | 4.4 | ◯ |
| IRAS 22541+0833 | 1.3 | 8.6 | 0.13 | 42 | X | −0.3 | X |
| IRAS 23060+0505 | <10.7 | <77.4 | <0.69 | <9 | ◯ | 1.7 | ◯ |
| IRAS 23233+2817 | 2.3 | 5.9 | 0.15 | 30 | ◯ | 1.4 | ◯ |
| IRAS 23389+0300 | 2.3 | 11.1 | 0.23 | 94 | X | 0.2 | X |
| IRAS 00183−7111 | <1.8 | <54.5 | <0.20 | <14 | ◯ | 4.2 | ◯ |
| IRAS 06035−7102 | 11.2 | 15.0 | 0.27 | 55 | X | 2.4 | ◯ |
| IRAS 20100−4156 | 6.6 | 25.7 | 0.17 | 183 | X | 2.6 | ◯ |
| IRAS 20551−4250 | 17.7 | 6.7 | 0.17 | 62 | X | 1.1 | ◯ |
| IRAS 23128−5919 | 32.0 | 13.2 | 0.35 | 92 | X | 0.9 | X |
| Mrk 231 | 76.6 | 27.5 | 0.23 | 8 | ◯ | 0.8 | X |
Note. Columns 1–8: same as in Table 5.
Download table as: ASCIITypeset image
Table 7. Hydrogen Recombination Emission Lines in LIRGs
| Object | f(Brα) | f(Brβ) | L(Brα) | L(Brβ) | Brβ/Brα | L(Brα)/LIR |
|---|---|---|---|---|---|---|
| (×10−14 ergs s−1 cm−2) | (×10−14 ergs s−1 cm−2) | (×1041 ergs s−1) | (×1041 ergs s−1) | (×10−4) | ||
| (1) | (2) | (3) | (4) | (5) | (6) | (7) |
| NGC 34 | 3.0 | ... | 0.24 | ... | ... | 0.22 |
| MCG−02-01-051 | 7.2 | ... | 1.05 | ... | ... | 1.03 |
| NGC 232 | 3.8 | 3.6 | 0.36 | 0.35 | 0.95 | 0.47 |
| VV 114E | 12.9 | 4.1 | 1.02 | 0.32 | 0.32 | 0.58 |
| VV 114W | 15.0 | 7.3 | 1.18 | 0.57 | 0.49 | 0.68 |
| MCG−03-04-014 | 6.0 | 3.0 | 1.48 | 0.74 | 0.50 | 0.87 |
| ESO 244-G012 (N) | 9.8 | 4.8 | 1.02 | 0.50 | 0.49 | 1.06 |
| CGCG 436-030 | 6.1 | 2.8 | 1.17 | 0.54 | 0.46 | 0.70 |
| NGC 695 | 6.7 | ... | 1.47 | ... | ... | 0.85 |
| UGC 2238 | 5.5 | ... | 0.48 | ... | ... | 0.68 |
| IRAS 03359+1523 | 3.8 | 2.8 | 0.94 | 0.70 | 0.75 | 0.80 |
| UGC 2982 | 8.5 | ... | 0.48 | ... | ... | 0.93 |
| NGC 1614 | 34.8 | 14.6 | 1.74 | 0.73 | 0.42 | 1.11 |
| NGC 2388 | 9.5 | ... | 0.36 | ... | ... | 0.60 |
| NGC 2623 | 5.1 | 2.5 | 0.32 | 0.16 | 0.49 | 0.28 |
| MCG+08-18-013 | 3.9 | ... | 0.52 | ... | ... | 0.76 |
| NGC 3110 | 5.4 | 4.7 | 0.31 | 0.27 | 0.87 | 0.46 |
| ESO 264-G036 | 8.8 | ... | 0.92 | ... | ... | 1.31 |
| MCG+07-23-019 | 2.8 | ... | 0.68 | ... | ... | 0.46 |
| IC 694 | 34.5 | 10.9 | 0.81 | 0.25 | 0.31 | 0.55 |
| NGC 3690 | 46.7 | ... | 1.10 | ... | ... | 1.11 |
| ESO 507-G070 | 3.0 | 1.3 | 0.26 | 0.11 | 0.42 | 0.29 |
| NGC 5010 | 7.0 | ... | 0.13 | ... | ... | 0.14 |
| VV 250 (SE) | 9.9 | 4.6 | 1.90 | 0.89 | 0.47 | 0.97 |
| Arp 193 | 9.0 | 3.3 | 0.94 | 0.34 | 0.37 | 0.63 |
| NGC 5104 | 5.1 | ... | 0.36 | ... | ... | 0.71 |
| MCG−03-34-064 | 4.1 | ... | 0.23 | ... | ... | 0.45 |
| NGC 5135 | 7.9 | ... | 0.30 | ... | ... | 0.46 |
| NGC 5256 (SW) | 4.5 | ... | 0.70 | ... | ... | 0.65 |
| CGCG 247-020 | 1.3 | ... | 0.17 | ... | ... | 0.23 |
| VV 340 | 2.2 | ... | 0.48 | ... | ... | 0.31 |
| CGCG 049-057 | 1.6 | ... | 0.053 | ... | ... | 0.096 |
| VV 705 (S+N) | 6.0 | 3.3 | 1.95 | 1.07 | 0.55 | 0.71 |
| IRAS 15335−0513 | 1.8 | ... | 0.24 | ... | ... | 0.37 |
| NGC 6090 | 10.2 | 4.0 | 1.83 | 0.72 | 0.40 | 1.57 |
| CGCG 052-037 | 4.9 | 3.3 | 0.56 | 0.38 | 0.67 | 0.74 |
| NGC 6285 | 3.6 | 3.5 | 0.25 | 0.25 | 0.98 | 0.35 |
| NGC 6286 | 6.7 | ... | 0.48 | ... | ... | 0.66 |
| IRAS 17132+5313 (W+E) | 4.2 | 2.0 | 2.23 | 1.09 | 0.49 | 0.77 |
| NGC 6621 | 7.9 | 4.3 | 0.68 | 0.37 | 0.55 | 1.13 |
| NGC 7130 | 8.3 | ... | 0.41 | ... | ... | 0.52 |
| IC 5179 | 15.5 | ... | 0.36 | ... | ... | 0.74 |
| ESO 602-G025 | 7.1 | ... | 0.88 | ... | ... | 1.23 |
| UGC 12150 | 4.6 | ... | 0.40 | ... | ... | 0.56 |
| NGC 7469 | 25.0 | 14.1 | 1.25 | 0.70 | 0.56 | 0.88 |
| CGCG 453-062 | 1.5 | ... | 0.19 | ... | ... | 0.24 |
| NGC 7592 W | 3.7 | ... | 0.42 | ... | ... | 0.51 |
| NGC 7592 E | 5.0 | 2.0 | 0.57 | 0.23 | 0.40 | 0.70 |
| MCG−01-60-022 | 9.9 | ... | 1.04 | ... | ... | 1.66 |
| IRAS 23436+5527 | 3.2 | 2.5 | 0.74 | 0.58 | 0.77 | 0.60 |
| NGC 7771 | 9.4 | 4.2 | 0.36 | 0.16 | 0.44 | 0.45 |
| Mrk 331 | 8.4 | 5.5 | 0.53 | 0.35 | 0.66 | 0.52 |
| NGC 1377 | 1.2 | ... | 0.0081 | ... | ... | 0.15 |
Notes. Column 1: object name. Column 2: flux of Brα emission line (λrest = 4.05 μm) in 10−14 (ergs s−1 cm−2). Column 3: flux of Brβ emission line (λrest = 2.63 μm) in 10−14 (ergs s−1 cm−2). Column 4: Brα luminosity in 1041 (ergs s−1). Column 5: Brβ luminosity in 1041 (ergs s−1). Column 6: Brβ to Brα flux (luminosity) ratio. Column 7: Brα to infrared luminosity ratio in 10−4.
Download table as: ASCIITypeset image
Table 8. Hydrogen Recombination Emission Lines in ULIRGs
| Object | f(Brα) | f(Brβ) | L(Brα) | L(Brβ) | Brβ/Brα | L(Brα)/LIR |
|---|---|---|---|---|---|---|
| (×10−14 ergs s−1 cm−2) | (×10−14 ergs s−1 cm−2) | (×1041 ergs s−1) | (×1041 ergs s−1) | (×10−4) | ||
| (1) | (2) | (3) | (4) | (5) | (6) | (7) |
| IRAS 12112+0305 | 1.8 | 1.5 | 2.09 | 1.72 | 0.82 | 0.28 |
| IRAS 12359−0725 | 1.4 | 0.6 | 6.06 | 2.66 | 0.44 | 1.17 |
| IRAS 14348−1447 | 2.3 | 2.1 | 3.35 | 3.09 | 0.92 | 0.44 |
| Arp 220 | 4.3 | 2.5 | 0.28 | 0.16 | 0.58 | 0.057 |
| IRAS 13509+0442 | 0.90 | ... | 3.85 | ... | ... | 0.59 |
| IRAS 14060+2919 | 1.5 | 1.0 | 4.52 | 3.16 | 0.70 | 1.03 |
| IRAS 15206+3342 | 2.8 | 1.9 | 9.80 | 6.58 | 0.67 | 1.64 |
| IRAS 16474+3430 (S) | 1.6 | 1.1 | 4.29 | 2.97 | 0.69 | 0.82 |
| IRAS 02021−2103 | 0.78 | ... | 2.36 | ... | ... | 0.58 |
| Mrk 273 | 4.4 | 4.2 | 1.24 | 1.17 | 0.96 | 0.27 |
| IRAS 15001+1433 | 2.2 | ... | 13.8 | ... | ... | 1.40 |
| IRAS 20100−4156 | 2.0 | ... | 7.90 | ... | ... | 0.53 |
| IRAS 20551−4250 | 1.4 | 1.2 | 0.53 | 0.47 | 0.88 | 0.14 |
| IRAS 23128−5919 | 8.3 | 7.8 | 3.44 | 3.20 | 0.93 | 0.92 |
Note. Columns 1–7: same as in Table 7.
Download table as: ASCIITypeset image
5.2. Possible Origin of 3.3 μm PAH Depression in ULIRGs
There are several plausible scenarios for the generally small observed L3.3 PAH/LIR ratios of ULIRGs. (1) The 3.3 μm PAH emission is more highly flux-attenuated in ULIRGs, because of the larger dust extinction, whereas the 8–1000 μm infrared fluxes are not significantly reduced. (2) Powerful AGN activity produces large infrared luminosities, but virtually no PAH emission in ULIRGs. (3) PAH emission from ULIRG starbursts is intrinsically weak. A normal starburst galaxy is observationally considered to be a composite of spatially well-mixed H ii regions, molecular gas, and photodissociation regions (Puxley 1991; McLeod et al. 1993; Forster Schreiber et al. 2001). If the starburst magnitudes per unit volume are larger in ULIRGs, more intense radiation fields could lead to greater destruction of 3.3 μm PAH carriers than in LIRG starbursts (Smith et al. 2007). Alternatively, under the effect of stronger radiation fields, a larger fraction of stellar UV photons could be absorbed by dust inside H ii regions (Abel et al. 2009), producing stronger infrared dust continuum emission, instead of creating photodissociation regions, which are the main source of the 3.3 μm PAH emission (Sellgren 1981). A higher fraction of UV photons could also be absorbed by dust, if the H ii regions are dustier in ULIRGs than in LIRGs (Luhman et al. 2003). In the third scenario, the L3.3 PAH/LIR ratios could decrease, even if the total amount of dust extinction is similar.
Regarding scenario (3), if the PAH emission from starbursts in ULIRGs is intrinsically more suppressed than in LIRGs, then even starburst-dominated ULIRGs should exhibit weak 3.3 μm PAH emission, and the upper envelope of the EW3.3 PAH distribution should decrease in ULIRGs, compared with LIRGs. Figure 5(b) shows a plot of the EW3.3 PAH distribution as a function of LIR. There is no clear trend that the upper envelope systematically decreases for higher LIR, and so at least for ULIRGs with minimum AGN contributions, the 3.3 μm PAH emission is as strong as in LIRG starbursts. Thus, scenario (3) is not strongly supported by our AKARI IRC observational data.
In scenario (1), the EW3.3 PAH distribution should be relatively insensitive to dust extinction. This is because the 3.3 μm PAH and continuum emission are comparably flux-attenuated in a pure normal starburst galaxy with spatially well-mixed H ii regions/molecular gas/photodissociation regions. Specifically, the dust extinction of starbursts only decreases the L3.3 PAH values, while the EW3.3 PAH values remain relatively unchanged (Imanishi et al. 2006a, 2008). In scenario (2), the EW3.3 PAH values diminish when the contributions from AGNs to the observed 2.5–5 μm fluxes become important. In Figure 5(b), many ULIRGs show small EW3.3 PAH values, suggesting that scenario (2) occurs in at least a fraction of the observed ULIRGs.
We note that stellar photospheric continuum emission could also affect the EW3.3 PAH values even for galaxies dominated by normal starbursts, if its contribution to the AKARI IRC 2.5–5 μm spectra is important and varies with different galaxies. The stellar photospheric emission shows a decreasing continuum flux with increasing wavelength at >1.8 μm (Sawicki 2002). The 3.5 μm to 2.5 μm flux ratio in Fν is ∼ 0.75 (Γ = −0.85; Fν∝ λΓ), which is insensitive to stellar ages, as long as they are >10 Myr (Bruzual & Charlot 1993; see also Figure 1 of Sawicki 2002). The stellar photospheric emission is bluer than the starburst-heated dust continuum emission (Γ ∼ 0; see Section 5.4), and so its contribution becomes relatively less important at longer wavelengths. Sources with the blue observed continuum emission at 2.5–5 μm are candidates largely contaminated by the stellar photospheric emission. Assuming that the stellar photospheric and starburst-heated hot dust continuum emission have Γ = −0.85 and Γ = 0, respectively, the stellar photospheric contribution to the 3.5 μm flux is estimated to be <30%, if the observed 3.5 μm to 2.5 μm flux ratio in Fν is >0.9. Almost all sources meet this criterion (Figures 1 and 2), suggesting that the stellar photospheric contributions are not so important to largely decrease the EW3.3 PAH values in the majority of the observed LIRGs and ULIRGs. Furthermore, given that the observed continuum emission of ULIRGs is generally redder than that of LIRGs (Section 5.4), this possible stellar photospheric contribution cannot explain the smaller EW3.3 PAH trend in ULIRGs than LIRGs at all.
5.3. AGNs with Weak Starbursts
To find sources that may possess luminous AGNs on the basis of depressed EW3.3 PAH values, we follow Imanishi et al. (2008). Sources with EW3.3 PAH ≲ 40 nm are classified as galaxies that contain luminous AGNs, and the AGN contributions to the observed 2.5–5 μm fluxes are significant. Tables 5 and 6 (Column 6) indicate whether or not AGN signatures are found.
Based on this low EW3.3 PAH method, 15 of 62 LIRG nuclei and 15 of 48 ULIRG nuclei display AGN signatures, after excluding additional interesting sources. Among the 15 LIRGs with detectable AGN signatures, 6 nuclei (MCG−03-34-064, NGC 5135, NGC 7469, IC 5298, NGC 7592W, and NGC 7674) are optically classified as Seyferts. For the ULIRGs, 9 of the 15 AGN-detected sources are optical Seyferts. After removing these optically identified AGNs surrounded by torus-shaped dusty media, nine LIRG nuclei and six ULIRG nuclei are possible containers for optically elusive luminous buried AGNs.
5.4. AGNs with Strong Starbursts
The low EW3.3 PAH method provides clear AGN signatures if the observed 2.5–5 μm flux primarily originates in AGN-heated PAH-free hot dust emission. This can happen if (1) the surrounding starbursts are weak and/or (2) the AGN emission is not heavily obscured. However, luminous AGN signatures could be overlooked by this method if the AGN is dust-obscured (i.e., the AGN emission is flux-attenuated) to the point that the AGN contribution to the observed 2.5–5 μm flux is insignificant compared with weakly obscured starbursts in the foreground. Such a highly obscured AGN may be distinguished by measuring the optical depths of dust absorption features. While stellar energy sources and dust are spatially well mixed in a normal starburst (see Section 1), in an obscured AGN, the energy source (i.e., a mass-accreting compact SMBH) is more centrally concentrated than dust. In the former mixed dust/source geometry, there are upper limits for the optical depths of the dust absorption features found at 2.5–5 μm (Imanishi & Maloney 2003; Imanishi et al. 2006a), because the observed flux primarily originates from weakly obscured, less flux-attenuated foreground emission (which has weak dust absorption features), with a small contribution from highly obscured, highly flux-attenuated emission from the obscured regions (which should exhibit strong dust absorption features). On the other hand, in a centrally concentrated energy source geometry, the optical depths of the dust absorption features can be larger than the upper limits of the mixed dust/source geometry, because dust extinction and flux attenuation can be approximated by a foreground screen dust model. It has been determined that the optical depths of 3.1 μm ice-covered dust absorption features with τ3.1 > 0.3 and 3.4 μm bare (ice-mantle-free) carbonaceous dust absorption features with τ3.4 > 0.2 cannot be reproduced in the mixed dust/source geometry, if the Galactic elemental abundance patterns and dust compositions are assumed (Imanishi & Maloney 2003; Imanishi et al. 2006a).
In Table 9 (Column 6), sources with τ3.1 > 0.3 and/or τ3.4 > 0.2 are indicated as possible hosts for obscured AGNs with centrally concentrated energy source geometry. Three LIRGs and 16 ULIRGs meet the criteria, of which one LIRG (IC 5298) and two ULIRGs (IRAS 12072−0444 and 16156+0146) are optically classified as Seyfert 2s. Thus, the remaining two LIRGs and 14 ULIRGs are buried AGN candidates. The number and fraction of sources with large τ3.1 and/or τ3.4 is substantially larger for ULIRGs than for LIRGs, suggesting that the 2.5–5 μm ULIRG emission generally comes from more obscured regions.
Table 9. Absorption Features and AGN Signatures
| Object | τ3.1 | τ3.4 | τCO2 | τCO | AGN Sign |
|---|---|---|---|---|---|
| (1) | (2) | (3) | (4) | (5) | (6) |
| NGC 34 | 0.2 | ... | 0.1 | 0.25 | X |
| NGC 232 | 0.15 | ... | 0.15 | ... | X |
| VV 114E | 0.4 | ... | 0.3 | 0.1 | ◯ |
| CGCG 436-030 | 0.25 | ... | 0.25 | 0.2 | X |
| NGC 695 | ... | ... | ... | 0.3 | X |
| UGC 2238 | ... | ... | 0.15 | ... | X |
| NGC 2623 | 0.4 | ... | 0.3 | 0.3 | ◯ |
| NGC 3110 | ... | ... | 0.1 | 0.15 | X |
| IC 694 | 0.3 | ... | 0.1 | 0.2 | X |
| NGC 3690 | 0.15 | ... | ... | 0.05 | X |
| ESO 507-G070 | 0.1 | ... | 0.2 | 0.3 | X |
| Arp 193 | 0.3 | ... | 0.3 | 0.2 | X |
| NGC 5256 (Mrk 266) (SW) | 0.15 | ... | ... | ... | X |
| VV 340 | 0.15 | ... | ... | ... | X |
| CGCG 049-057 | 0.1 | ... | ... | 0.2 | X |
| IRAS 15250+3609 | ... | ... | 0.5 | >1.0 | X |
| IRAS 15335−0513 | 0.1 | ... | ... | ... | X |
| CGCG 052-037 | 0.1 | ... | ... | 0.1 | X |
| NGC 6286 | 0.2 | ... | ... | ... | X |
| ESO 602-G025 | 0.2 | ... | ... | 0.2 | X |
| IC 5298 | 0.4 | ... | 0.25 | 0.5 | ◯ |
| NGC 7771 | 0.2 | ... | 0.15 | ... | X |
| NGC 4418 | ... | ... | ... | 0.5 | X |
| IRAS 00188−0856 | 1.3 | 0.5 | 0.2 | ... | ◯ |
| IRAS 11582+3020 | 0.6 | ... | ... | ... | ◯ |
| IRAS 12127−1412 | 0.35 | 0.3 | 0.2 | ... | ◯ |
| IRAS 12359−0725 | 1.0 | ... | ... | ... | ◯ |
| IRAS 14348−1447 | 0.4 | ... | 0.3 | ... | ◯ |
| Arp 220 | 0.3 | ... | 0.3 | 0.4 | X |
| IRAS 16090−0139 | 0.6 | ... | ... | ... | ◯ |
| IRAS 21329−2346 | 0.6 | ... | ... | ... | ◯ |
| IRAS 08201+2801 | 1.0 | ... | ... | ... | ◯ |
| IRAS 15225+2350 | 1.0 | ... | ... | ... | ◯ |
| IRAS 20414−1651 | 1.0 | ... | ... | ... | ◯ |
| IRAS 22206−2715 | 0.4 | ... | ... | ... | ◯ |
| IRAS 14485−2434 | 0.8 | ... | ... | ... | ◯ |
| IRAS 12072−0444 | ... | 0.3 | ... | ... | ◯ |
| Mrk 273 | ... | ... | 0.2 | 0.15 | X |
| IRAS 16156+0146 | 1.0 | 0.75 | ... | ... | ◯ |
| IRAS 00183−7111 | 0.6 | 1.0 | ... | ... | ◯ |
| IRAS 06035−7102 | 0.6 | 0.25 | 0.3 | ... | ◯ |
| IRAS 20551−4250 | 0.3 | ... | 0.35 | >0.5 | X |
Notes. Column 1: object name. LIRGs and ULIRGs are separated by the central horizontal solid line. The additional interesting sources are included in each category. Column 2: observed optical depth of the 3.1 μm H2O ice absorption feature. Column 3: observed optical depth of the 3.4 μm bare carbonaceous dust absorption feature. Column 4: observed optical depth of the 4.26 μm CO2 absorption feature. The 4.26 μm CO2 absorption feature is intrinsically so narrow (van Dishoeck et al. 1996; Whittet et al. 1998) that it may not be fully resolvable in AKARI IRC spectra with R ∼ 120. In this case, the τCO2 value could be slightly underestimated for sources with large τCO2 values (e.g., IRAS 15250+3609). Column 5: observed optical depth of the 4.67 μm CO absorption feature. Column 6: obscured AGN signature, based on τ3.1 > 0.3 and/or τ3.4 > 0.2 (see Section 5.4).
Download table as: ASCIITypeset image
The continuum slope Γ (Fν ∝ λΓ) can also be used to find candidates for obscured AGNs with coexisting strong starbursts in the foreground (Risaliti et al. 2006, 2010; Sani et al. 2008). The logic is basically the same. The 2.5–5 μm continuum emission from a normal starburst with mixed dust/source geometry cannot be so red, while that from an obscured AGN can become very red (Risaliti et al. 2006). Figure 6(a) shows the distribution of Γ for the LIRGs and ULIRGs observed in this paper. In Figure 6(b), the same distribution is shown with the ULIRGs studied by Imanishi et al. (2008) included. A larger value of Γ indicates a redder, rising continuum with increasing wavelength. In both plots, a larger fraction of the ULIRGs are distributed in the red, large Γ tails compared to the LIRGs, again suggesting that the infrared 2.5–5 μm emission from ULIRGs is generally more obscured than that of LIRGs. After excluding the very red outliers, most of the LIRGs and ULIRGs have Γ = −1 to 1, with a median value of Γ ∼ 0 (Tables 5, 6, and 10). This Γ value may be regarded as a typical value for a starburst.
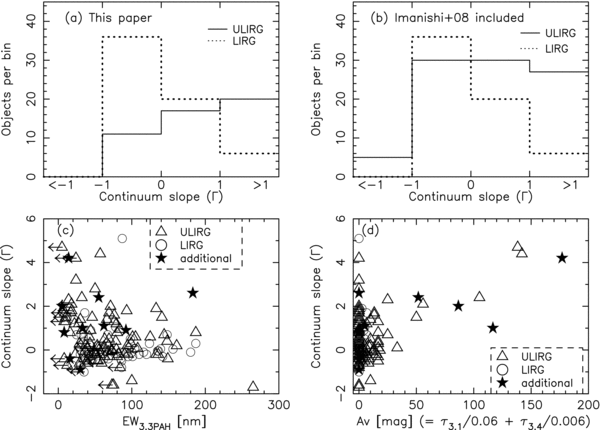
Figure 6. (a) Histogram of the continuum slopes (Γ; Fν∝ λΓ) of LIRGs (62 nuclei) and ULIRGs (48 nuclei) studied in this paper. The additional interesting LIRGs (two sources) and ULIRGs (six sources) in the last rows of Tables 1 and 2 are excluded, for the sake of an unbiased statistical comparison. (b) Histogram of the continuum slopes (Γ; Fν∝ λΓ) of ULIRGs and LIRGs. Forty-four ULIRG nuclei studied by Imanishi et al. (2008) are added, after excluding the two additional interesting ULIRGs (UGC 5101 and IRAS 19254−7245). (c) Relationship between EW3.3 PAH (abscissa) and the continuum slope (Γ) (ordinate) for all LIRGs and ULIRGs studied in this paper and in Imanishi et al. (2008). The additional interesting LIRGs and ULIRGs are included. (d) Relationship between dust extinction, estimated from the formula AV = τ3.1/0.06 + τ3.4/0.006 (abscissa), and the continuum slope (Γ) (ordinate) for all LIRGs and ULIRGs studied in this paper and in Imanishi et al. (2008). The additional interesting LIRGs and ULIRGs are included. Because of the dilution of τ3.4 by the 3.4 μm PAH sub-peak, the AV values in the abscissa are only lower limits, and can be substantially smaller than the actual dust extinction toward the 2.5–5 μm continuum emission regions, particularly for PAH-strong sources with apparently small AV values (see Section 5.7).
Download figure:
Standard image High-resolution imageTable 10. Continuum Slopes (Γ) of ULIRGs, Previously Observed with AKARI IRC by Imanishi et al. (2008)
| Object | Γ | Object | Γ |
|---|---|---|---|
| (1) | (2) | (3) | (4) |
| IRAS 03521+0028 | 0.07 | IRAS 09539+0857 | −0.01 |
| IRAS 04074−2801 | 0.2 | IRAS 10494+4424 | −0.01 |
| IRAS 05020−2941 | 0.2 | IRAS 16468+5200 | 0.4 |
| IRAS 09463+8141 | −0.4 | IRAS 16487+5447 | −0.2 |
| IRAS 10091+4704 | −1.6 | IRAS 17028+5817W | −0.2 |
| IRAS 11028+3130 | −1.4 | IRAS 17044+6720 | 2.3 |
| IRAS 11180+1623 | −0.07 | IRAS 00456−2904 | −0.2 |
| IRAS 14121−0126 | 0.8 | IRAS 01298−0744 | 1.9 |
| IRAS 16333+4630 | 0.1 | IRAS 01569−2939 | −0.8 |
| IRAS 21477+0502 | −0.6 | IRAS 11387+4116 | −0.6 |
| IRAS 23129+2548 | −0.7 | IRAS 13539+2920 | −0.2 |
| IRAS 01199−2307 | 1.6 | IRAS 17028+5817E | −3.5 |
| IRAS 01355−1814 | −0.5 | IRAS 01494−1845 | −0.08 |
| IRAS 03209−0806 | 0.2 | IRAS 02480−3745 | −1.7 |
| IRAS 10594+3818 | 0.03 | IRAS 04313−1649 | −1.6 |
| IRAS 12447+3721 | 0.8 | IRAS 08591+5248 | −0.5 |
| IRAS 13469+5833 | −0.6 | IRAS 10035+2740 | −0.3 |
| IRAS 14202+2615 | 0.9 | IRAS 05189−2524 | 1.3 |
| IRAS 15043+5754 | −0.2 | IRAS 14394+5332 | 2.0 |
| IRAS 17068+4027 | 0.7 | IRAS 17179+5444 | 0.8 |
| IRAS 22088−1831 | −0.4 | IRAS 23498+2423 | 1.3 |
| IRAS 00482−2721 | 0.3 | UGC 5101 | 1.0 |
| IRAS 08572+3915 | 4.7 | IRAS 19254−7245 | 2.0 |
Notes. Column 1: object name. Column 2: continuum slope (Γ). Column 3: object name. Column 4: continuum slope (Γ).
Download table as: ASCIITypeset image
If we interpret values of Γ > 1 as obscured AGN signatures, then only six LIRGs correspond to this case, of which two sources (MCG−03-34-064 and NGC 7674) are optical Seyferts. 11/34 (32%) of optically non-Seyfert ULIRGs and 9/14 (64%) of optically Seyfert ULIRGs in the IRAS 1 Jy sample have large Γ values (>1), indicative of obscured AGNs. Among the additional interesting sources, red continuum emission is seen in four sources (IRAS 00183−7111, 06035−7102, 20100−4156, and 20551−4250). Tables 5 and 6 (Column 8) summarize the detection or non-detection of AGN signatures, based on Γ values.
In previous research (Risaliti et al. 2006, 2010; Sani et al. 2008), Γ is defined by Fλ ∝ λΓ and Γprev = −0.5 is assumed to be a typical value for a weakly obscured starburst/AGN. Because Γours, as defined in our paper (Fν ∝λΓ), is related to Γprev by Γours = Γprev + 2, the typical Γours values of 0 (−1 to 1) correspond to Γprev = −2 (−3 to −1), which is smaller (bluer) than the previously assumed values for weakly obscured starbursts/AGNs.
Figure 6(c) compares the Γ and EW3.3 PAH values. Red continuum sources with large Γ values are preferentially distributed in the low EW3.3 PAH regions, usually occupied by AGN-important galaxies, demonstrating that large Γ values can be a good criterion for finding obscured AGNs. However, there are many sources that have low EW3.3 PAH values, and yet exhibit blue continuum emission (small Γ). Obviously, weakly obscured AGNs cannot be detected by large Γ values.
To relate Γ value to obscuration, we estimate the dust extinction toward the observed 2.5–5 μm continuum emission regions, based on the observed optical depths of the 3.1 μm ice-covered dust (τ3.1) and 3.4 μm bare carbonaceous dust absorption features (τ3.4). The τ3.1 value reflects the column density of dust grains covered with an ice mantle deep inside molecular clouds and is roughly proportional to the dust extinction (τ3.1/AV = 0.06; Tanaka et al. 1990; Smith et al. 1993; Murakawa et al. 2000). The τ3.4 value can be used to estimate the column density of bare, ice-mantle-free dust grains in the diffuse interstellar medium (outside molecular clouds) and is correlated with the dust extinction (τ3.4/AV = 0.004–0.007; Pendleton et al. 1994; Imanishi et al. 1996; Rawlings et al. 2003). Because the 3.4 μm dust absorption feature is absent from ice-covered dust grains (Mennella et al. 2001), we can estimate the total column densities of dust, including both ice-covered and ice-mantle-free, from the combination of τ3.1 and τ3.4 values. Assuming that AV = τ3.1/0.06 + τ3.4/0.006, the continuum slope Γ and dust extinction toward the 2.5–5 μm continuum emission regions (AV) are compared in Figure 6(d). For sources with undetectable τ3.1 and τ3.4, we tentatively adopt AV = 0 mag. It can be seen that all the sources with AV > 40 mag show red continua (Γ > 1), supporting the hypothesis that large Γ values are caused by dust obscuration.
5.5. Combination of Energy Diagnostic Methods
Here, we summarize the fraction of sources for which AGN signatures are observed using at least one of the methods previously discussed (low EW3.3 PAH, large τ3.1 and/or τ3.4, and large Γ), after excluding the additional interesting sources. The low EW3.3 PAH method is relatively sensitive to weakly obscured AGNs, while both the large τ and large Γ techniques can selectively detect highly obscured AGNs. Thus, these methods complement each other for the purpose of finding AGNs.
AGN signatures are found in 17/62 (27%) LIRG nuclei. The AGN detection rate is 6/8 (75%) for optically Seyfert LIRG nuclei and 11/54 (20%) for optically non-Seyfert LIRG nuclei.
For ULIRGs, the fraction of AGN-detected sources is 29/48 (60%) for all nuclei, 10/14 (71%) for nuclei classified as optically Seyfert, and 19/34 (56%) for nuclei classified as optically non-Seyfert. The detection rate for buried AGNs in galaxies classified as optically non-Seyfert is higher in ULIRGs (19/34; 56%) than in LIRGs (11/54; 20%). For optically identified AGNs (optical Seyferts) of LIRGs and ULIRGs combined, our AKARI IRC 2.5–5 μm spectroscopic methods recover AGN signatures in 16/22 (73%). A small fraction of optically identified AGNs does not exhibit clear AGN signatures according to our methods (see also Nardini et al. 2010), possibly because of a relatively small covering of dust around a central AGN. For such an AGN, the NLRs develop so well that optical AGN detection becomes easy, while AGN-heated hot dust emission (on which our infrared AGN diagnostic is based) is not so strong.
For the additional interesting sources, AGN signatures are detected in 7/8 (88%) by at least one method. Because these sources are selected for their strong dust absorption features and/or AGN signatures at other wavelengths, the high AGN detection rate is exactly what we would expect.
5.6. Hydrogen Recombination Emission Lines
In many LIRGs and a small fraction of bright ULIRGs with high S/N, strong Brα (λrest = 4.05 μm) emission lines are clearly seen, particularly for PAH-strong, starburst-important galaxies. The Brβ (λrest = 2.63 μm) emission lines are often recognizable in sources with very strong Brα emission with larger equivalent widths. Although an AGN can also produce Brα and Brβ emission, their equivalent widths are expected to be low, because of dilution by strong, AGN-heated hot dust continuum emission. Thus, Brα and Brβ emission from strong Br emission sources is assumed to originate mostly from starburst activity. Both lines are relatively strong, and their dust extinction effects are much smaller than the widely used hydrogen recombination lines, such as Lyα (λrest = 0.12 μm) in the UV range, or Hα (λrest = 0.66 μm) and Hβ (λrest = 0.49 μm) in the optical range. Thus, the Brα and Brβ emission lines could provide a good tracer for probing the properties of starbursts in the dusty LIRG and ULIRG populations, by substantially reducing the uncertainties of dust extinction corrections.
Brα (λrest = 4.05 μm) is observable from the ground in the longest wavelength component of the L-band (2.8–4.2 μm) Earth's atmospheric window for only the nearest sources with small redshifts. However, for such nearby sources, Brβ (λrest = 2.63 μm) emission is not covered by the ground-based L band. Even if the Brα line is covered, it is difficult to measure with ground-based spectroscopy because of the considerable amount of Earth's atmospheric background noise in the 4.05–4.2 μm range. If a galaxy is redshifted, the Brβ emission line enters the L-band atmospheric window. However, for such redshifted sources, the Brα emission is shifted beyond the L-band's longest wavelength range. Consequently, in ground-based spectroscopy, it is impossible to observe both the Brα and Brβ emission lines. The simultaneous coverage of 2.5–5 μm provided by AKARI IRC is quite unique, in that it enables the comparison of the Brα and Brβ emission lines.
For sources in which both the Brα and Brβ emission lines are detected, the observed Brβ/Brα luminosity ratios are compared with the value predicted by case B theory (∼0.64 for 104 K; Wynn-Williams 1984) and are found to agree to within a factor of 2 (Tables 7 and 8). The lowest and highest observed values deviate from the theoretical value by a factor of ∼2 (VV 114E and IC 694) and ∼1.5 (NGC 232, NGC 6285, and Mrk 273), respectively. Given the possible presence of flux measurement uncertainties (due to the faintness of Brβ), we see no clear evidence that the Brβ/Brα luminosity ratio deviates from the case B prediction. Even if the factor of ∼ 2 for the lower value is due to dust extinction, assuming the dust extinction curve Aλ∝ λ−1.75 (Cardelli et al. 1989), the estimated dust extinction is AV < 16 mag. Thus, the strong Br emission lines are most likely to originate from modestly obscured (AV < 30 mag) starbursts, as probed by the 3.3 μm PAH emission features (Section 5.1).
For this reason, the Brα emission luminosity could also furnish an independent probe for modestly obscured starburst magnitudes. In starburst galaxies, the luminosity ratio of the optical Hα and far-infrared (40–500 μm) emission is estimated to be 0.57 × 10⁻² (Kennicutt 1998). Given that the far-infrared luminosity is only slightly smaller than the infrared (8–1000 μm) luminosity in high-luminosity starbursts (Sanders & Mirabel 1996), and assuming a Brα/Hα luminosity ratio of ∼0.02, as predicted by case B (104 K; Wynn-Williams 1984), we obtain a Brα to infrared luminosity ratio of LBrα/LIR ∼ 1 × 10⁻⁴ for a starburst.
Figure 7 compares the LBrα/LIR and L3.3 PAH/LIR ratios for Brα-detected LIRGs and ULIRGs. The source distribution lies along the dotted line, with some scatter, suggesting that both the Brα and 3.3 μm PAH emission provide similar starburst contributions to the infrared luminosities of these LIRGs and ULIRGs. Hence, both the Brα and 3.3 μm PAH emission can be used as independent measures of the magnitudes of modestly obscured starbursts. There may be a greater number of sources above the dashed line than that below the line, indicating that for some fraction of sources, the Brα emission tends to provide a higher starburst contribution than the 3.3 μm PAH emission. The fraction of such sources is higher in ULIRGs (Figure 7). Although AGN contribution to the Brα emission line is a possibility, this trend could be due to selection bias, because only ULIRGs with clearly detectable, strong Brα emission lines are plotted. In fact, for the modestly obscured (AV < 30 mag) starbursts probed with the 3.3 μm PAH and Brα emission, dust extinction reduces the L3.3 PAH/LBrα flux ratios by only ∼30%, if the dust extinction curve Aλ ∝λ−1.75 (Cardelli et al. 1989) is adopted.
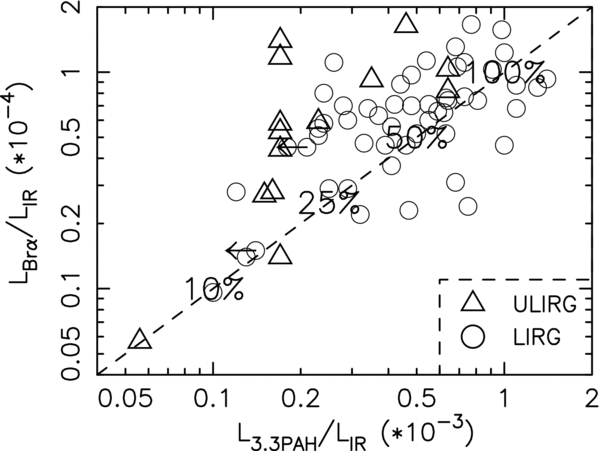
Figure 7. Comparison of the 3.3 μm PAH to infrared (L3.3 PAH/LIR) (abscissa) and Brα to infrared (LBrα/LIR) (ordinate) luminosity ratios for sources with clearly detectable Brα emission. For starburst-dominated galaxies with modest dust obscuration, L3.3 PAH/LIR ∼ 10−3 and LBrα/LIR ∼ 10−4 are the expected values. The symbol "100%" indicates that all the infrared luminosity can be accounted for by modestly obscured starburst emission probed by the 3.3 μm PAH and Brα emission. The symbols "50%," "25%," and "10%" indicate, respectively, that 50%, 25%, and 10% of the observed infrared luminosities can be explained by PAH- or Brα-probed starburst activity. For sources on the dashed line, both 3.3 μm PAH and Brα provide consistent starburst fractions of the observed infrared luminosities. For Arp 299 (IC 694 + NGC 3690), NGC 3690 and IC 694 are plotted separately, and we assume that 40% and 60% of the infrared luminosity originates from NGC 3690 and IC 694, respectively (Joy et al. 1989; Charmandaris et al. 2002).
Download figure:
Standard image High-resolution image5.7. Dust Extinction and Intrinsic AGN Luminosities
For LIRGs and ULIRGs with low EW3.3 PAH values, we can reasonably assume that the bulk of the observed 2.5–5 μm continuum fluxes originate in AGN-heated hot dust continuum emission. By applying the correction for flux attenuation by dust extinction, we can estimate the extinction-corrected intrinsic luminosity of AGN-heated hot dust emission. Conversion from this type of luminosity to the intrinsic primary energetic radiation luminosity of an AGN is straightforward if the AGN is surrounded by a large column of dust in virtually all directions, because energy is conserved (without escape) from the inner hot dust regions to the outer cool dust regions. In a pure AGN with this type of geometry, and without strong starbursts, the luminosity of the AGN-heated hot dust emission must be comparable to the primary energetic radiation of the AGN (Figure 2 of Imanishi et al. 2007a). Buried AGNs in optically non-Seyfert LIRGs and ULIRGs could be modeled by this geometry, as a first approximation.
However, for Seyfert-type AGNs, which are thought to be surrounded by torus-shaped dusty media, the discussion is more complex. If the solid angle of the torus, viewed from the central compact SMBH, does not vary with the distance from the center, the AGN-originated 2.5–5 μm continuum luminosity (hot dust of the inner part) should be similar to the luminosity at longer infrared wavelengths (cool dust on the outside). However, if the torus is strongly flared (Wada et al. 2009) or warped (Sanders et al. 1989), this assumption is no longer valid, and the luminosity at the longer wavelengths could be greater than the AGN-originated 2.5–5 μm continuum luminosity. Furthermore, a significant fraction of the primary AGN radiation may escape without being absorbed by dust, and such an emission component cannot be probed by infrared observations. To estimate the primary energetic radiation luminosity of an AGN from the AGN-originated 2.5–5 μm continuum luminosity, we adopt a correction factor of 5 (LAGN/L2.5−5 μm = 5) for sources optically classified as Seyferts (Risaliti et al. 2010).
We choose λrest = 3.5 μm as representative of the 2.5–5 μm continuum emission and estimate νFν(3.5 μm) or equivalently λFλ(3.5 μm), for sources with EW3.3 PAH < 40 nm. The 3.5 μm continuum flux attenuation is estimated from the τ3.4 and τ3.1 values, rather than the continuum slope Γ, because the intrinsic Γ value for unobscured AGNs could have high uncertainty (Section 5.4). The dust extinction is derived from the formula AV = τ3.1/0.06 + τ3.4/0.006 (see Section 5.4). The flux attenuation at 3.5 μm, relative to the optical V band (0.55 μm), is observationally found to be A3.5 μm/AV = 0.03–0.06 (Rieke & Lebofsky 1985; Nishiyama et al. 2008, 2009). By adopting A3.5 μm/AV = 0.05, we obtain A3.5 μm = 0.83 × τ3.1 + 8.3 ×τ3.4.
Figure 8 compares the extinction-corrected intrinsic AGN luminosities and observed infrared luminosities of LIRGs and ULIRGs with EW3.3 PAH < 40 nm. Only a small fraction of the sources exhibit intrinsically luminous AGNs, which could quantitatively account for the observed infrared luminosities. However, we note that all but one of them are 3.4 μm absorption-detected sources. As the formula of A3.5 μm = 0.83 ×τ3.1 + 8.3 × τ3.4 indicates, correction of the flux attenuation at 3.5 μm is very sensitive to the τ3.4 values, and yet the detection rate of this 3.4 μm bare carbonaceous dust absorption feature is limited, partly because the feature is intrinsically weak (small oscillator strengths) and/or can be veiled by the 3.4 μm PAH emission sub-peak for PAH-detected sources. Thus, it is fair to assume that the estimated intrinsic AGN luminosities for sources with non-detectable 3.4 μm absorption features are only lower limits, and the actual AGN luminosities could be much higher. To clarify this possible ambiguity, sources with detectable and non-detectable 3.4 μm absorption features are distinguished by different symbols in Figure 8. For LIRGs and ULIRGs optically classified as Seyferts, the estimated AGN luminosity is a significant fraction (>10%) of the observed infrared luminosity in most cases. For buried AGN candidates in optically non-Seyfert LIRGs and ULIRGs without detectable 3.4 μm absorption features, the buried AGNs could explain at least a few to 10% of the observed infrared luminosities.
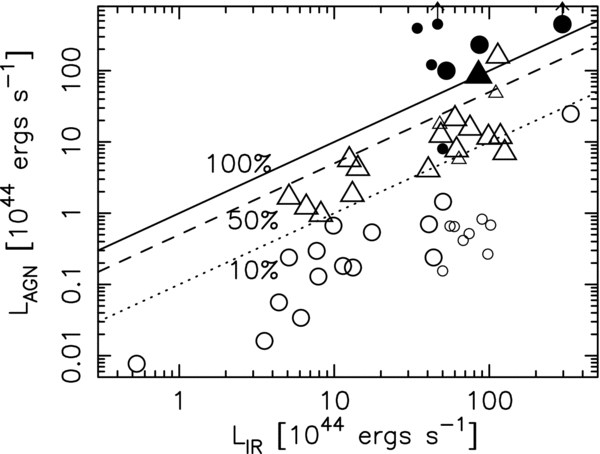
Figure 8. Comparison of the observed infrared luminosity (abscissa) and the intrinsic, dust-extinction-corrected AGN luminosity, estimated from the AKARI IRC 2.5–5 μm spectra (ordinate) for sources with low 3.3 μm PAH equivalent widths (EW3.3 PAH < 40 nm). Circles: optically non-Seyfert LIRGs and ULIRGs that display buried AGN signatures. Triangles: LIRGs and ULIRGs optically classified as Seyferts. Filled and open symbols represent sources with detectable and non-detectable 3.4 μm bare carbonaceous dust absorption features, respectively. Large and small symbols represent sources studied in this paper and by Imanishi et al. (2008), respectively. For Seyfert-type objects, the bolometric correction factor of 5 is applied (see Section 5.7). The solid line indicates that the estimated intrinsic AGN luminosity equals the observed infrared luminosity. The dashed (dotted) line indicates that the intrinsic AGN luminosity is 50% (10%) of the observed infrared luminosity. For Arp 299 (IC 694 + NGC 3690), NGC 3690 and IC 694 are plotted separately, and we assume that 40% of the infrared luminosity originates from NGC 3690, and 60% from IC 694 (Joy et al. 1989; Charmandaris et al. 2002).
Download figure:
Standard image High-resolution imageIn this regard, the non-detection of the 3.4 μm bare carbonaceous dust absorption feature in the ULIRG IRAS 00397−1312 is puzzling. This galaxy displays a very red continuum, but no detectable 3.3 μm PAH emission (Figure 2), both of these factors indicating an energetically important buried AGN. In this ULIRG, the abundance of carbonaceous dust (= the carrier of the 3.4 μm absorption feature) may be suppressed for some reason. At the same time, the intrinsic AGN luminosities for 3.4μm absorption-detected sources are often greater than the observed infrared luminosities (Figure 8) where the carbonaceous dust abundance may be enhanced and the τ3.4 value per unit dust extinction could be higher than in the Galactic diffuse interstellar medium. In this case, the intrinsic AGN luminosity could be overestimated, if we are based on the τ3.4 values and the Galactic extinction curve. Possible variation of the abundance of carbonaceous dust as the carrier of the 3.4 μm absorption feature could introduce additional ambiguity into the estimates of the intrinsic AGN luminosities obtained from the AKARI IRC 2.5–5 μm spectra.
5.8. Comments on Individual Buried AGN Candidates
We selected buried AGN candidates based on low EW3.3 PAH values, large τ3.1 and τ3.4 values, and large Γ values in the AKARI IRC 2.5–5 μm spectra. Although the presence of a buried AGN is a natural explanation for these observed properties, alternative scenarios are also possible and cannot be ruled out completely. For example, extreme starbursts which are exceptionally more centrally concentrated than the surrounding molecular gas and dust (Figure 1(e) of Imanishi et al. 2007a) and consist of H ii regions only, with virtually no molecular gas or photodissociation regions, could also produce weak PAH emission, strong dust absorption features, and red continuum slopes. It has been argued that extreme starbursts do not readily occur in ULIRGs (Imanishi et al. 2007a, 2010a; Imanishi 2009), because of the extremely high emission surface brightness required, which is much higher than the value normally sustained by starburst phenomena (Thompson et al. 2005). Additionally, a normal starburst nucleus with a mixed dust/source geometry and a large amount of foreground screen dust in an edge-on host galaxy (Figure 1(d) of Imanishi et al. 2007a) could produce large τ3.1, τ3.4, and Γ values, although a low EW3.3 PAH value is not explained in this way. To investigate whether our buried AGN interpretation is generally persuasive, we compare our results with published data for several selected well-studied sources.
Since LIRGs are generally closer than ULIRGs, high-quality data are available at other wavelengths and can be used to detect the presence of buried AGNs. In Tables 5 and 9, 17 LIRG nuclei display AGN signatures. After excluding six optically identified AGNs (i.e., optical Seyferts; MCG−03-34-064, NGC 5135, NGC 7469, IC 5298, NGC 7592W, and NGC 7674), 11 buried AGN candidates remain. These are NGC 232, VV 114E, NGC 2623, IC 2810, IC 694, NGC 3690, IRAS 12224−0624, IC 860, NGC 5104, IRAS 15250+3609, and NGC 7771, of which buried AGN signatures are found in VV 114E, NGC 2623, and NGC 3690 by more than one of the methods based on the AKARI IRC 2.5–5 μm spectra. The nuclei of these three LIRGs are thus particularly strong buried AGN candidates. In fact, for NGC 2623 and NGC 3690, X-ray observations strongly suggest the presence of Compton-thick (NH > 1024 cm−2) AGNs (Della Ceca et al. 2002; Maiolino et al. 2003; Zezas et al. 2003; Ballo et al. 2004). The presence of an obscured AGN in NGC 2623 is also supported by the detection of a high-excitation, mid-infrared [Ne v] 14.3 μm forbidden emission line (Evans et al. 2008). For VV 114E, Le Floc'h et al. (2002) argued the presence of a luminous buried AGN on the basis of the strong, featureless mid-infrared 15 μm continuum emission. Thus, for all three of the particularly strong buried AGN candidates (VV 114E, NGC 2623, and NGC 3690), there are independent buried AGN arguments in other works.
Among other buried AGN candidates, IC 694, the pair galaxy of NGC 3690 in the Arp 299 merging system, may also contain an obscured X-ray-emitting AGN (Zezas et al. 2003; Ballo et al. 2004). IRAS 12224−0624 exhibits strong core radio emission suggestive of an AGN (Hill et al. 2001). The infrared >5 μm spectrum of IRAS 15250+3609 is typical of buried AGNs (Spoon et al. 2002; Armus et al. 2007). These supporting results demonstrate the reliability of our AKARI IRC 2.5–5 μm spectroscopic technique as a tool for finding optically elusive buried AGNs.
Unlike LIRGs, the literature contains relatively few references to buried AGN signatures for members of our ULIRG sample. Because most ULIRGs are more distant than LIRGs, the detection of AGN signatures generally becomes difficult by X-ray observation (the most powerful AGN search tool), simply due to the lack of sensitivity of the currently available X-ray satellites. Even with this difficulty, Teng et al. (2008) detected AGN signatures in our buried AGN candidate IRAS 04103−2838 by deep X-ray observations. In another buried AGN candidate, IRAS 12127−1412, Spoon et al. (2009) found AGN signatures via high-velocity neon forbidden emission lines in the mid-infrared range.
5.9. Buried AGN Fraction as a Function of Galaxy Infrared Luminosity
The energetic importance of AGNs as a function of galaxy infrared luminosity has previously been investigated by a number of researchers (Tran et al. 2001; Imanishi 2009; Veilleux et al. 2009; Nardini et al. 2009, 2010; Valiante et al. 2009; Imanishi et al. 2010a). However, these studies focused on ULIRGs with LIR ⩾ 1012 L☉, simply because energy diagnostics of LIRGs with LIR = 1011–1012 L☉ are still relatively scarce (Brandl et al. 2006; Imanishi et al. 2009; Pereira-Santaella et al. 2010). The infrared emission of LIRGs is apparently more extended than that of ULIRGs, so that slit spectroscopy using ground-based spectrographs with large telescopes and the Spitzer IRS are not adequate to fully cover the emission from LIRGs. A second possible reason for the scarcity of LIRG studies is that while there are numerous indications that luminous buried AGNs are present in at least some fraction of ULIRGs (Sanders et al. 1988a; Soifer et al. 2000), and thus there is some motivation for seeking AGNs through detailed infrared spectroscopy, such AGN implications are generally rarer in optically non-Seyfert LIRGs than in ULIRGs (Soifer et al. 2001).
With the acquisition of the AKARI IRC 2.5–5 μm slit-less spectra for a large sample of LIRGs, systematic investigations of LIRG energy sources are now possible, enabling us to understand the role of both optically identified and optically elusive AGNs in galaxies with a wide infrared luminosity range, from LIRGs to ULIRGs. It is known that the fraction of optically identified AGNs (optical Seyferts) increases with increasing galaxy infrared luminosity (Veilleux et al. 1999; Goto 2005). Figure 9 shows a plot of the fraction of sources with detectable buried AGN signatures8 as a function of galaxy infrared luminosity, including both LIRGs and ULIRGs. Only optically non-Seyfert LIRGs and ULIRGs are plotted, and optical Seyferts are excluded. In the AKARI IRC results, the number of LIRGs with LIR < 1012 L☉ is sufficient (50 sources), but the sample is not statistically complete for ULIRGs with 1012 L☉ ⩽ LIR < 1012.3 L☉ (43 sources) and LIR ⩾ 1012.3 L☉ (30 sources). In the Spitzer IRS results, although the sample is statistically complete for ULIRGs with 1012 L☉ ⩽ LIR < 1012.3 L☉ (54 sources) and LIR ⩾ 1012.3 L☉ (31 sources), the number of LIRGs (LIR < 1012 L☉) is limited (18 sources). Thus, these results complement each other. Although the samples are not exactly the same, both the AKARI and Spitzer results show that the energetic importance of buried AGNs gradually increases with increasing galaxy infrared luminosity, ranging from LIRGs to ULIRGs. Accordingly, the existing implications that the AGN–starburst connections are luminosity-dependent in ULIRGs (Imanishi et al. 2010a; Nardini et al. 2010) can be extended to LIRGs as well.
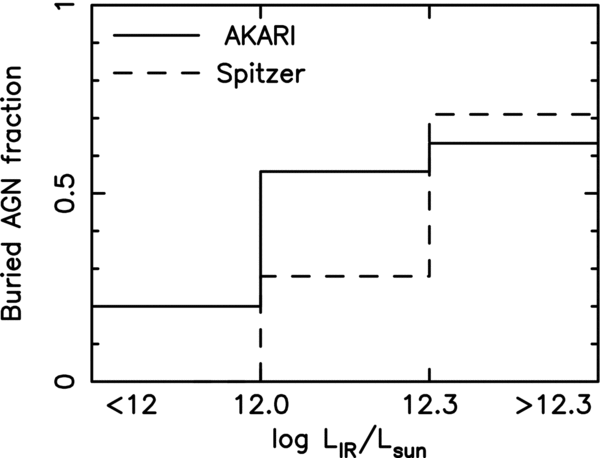
Figure 9. Detectable buried AGN fraction in optically non-Seyfert LIRGs and ULIRGs as a function of galaxy infrared luminosity. Sources with optical Seyfert signatures are excluded from this plot, because our aim is to investigate the fraction of optically elusive buried AGNs. For sources with multiple nuclei, if optical Seyfert signatures are seen in at least one nucleus, then these sources are excluded. Solid line: buried AGN fraction in statistically significant number of unbiased LIRGs and ULIRGs, as determined by AKARI IRC 2.5–5 μm spectroscopy (this paper; Imanishi et al. 2008). The total number of sources is 50, 43, and 30 for LIRGs with LIR < 1012 L☉, ULIRGs with 1012 L☉ ⩽ LIR < 1012.3 L☉, and ULIRGs with LIR ⩾ 1012.3 L☉, respectively. The number of sources is based on LIRGs or ULIRGs, and not on individual nuclei. For sources with multiple nuclei, if buried AGN signatures are found in at least one nucleus, then the sources are classified as buried AGNs. Dashed line: buried AGN fraction in LIRGs and ULIRGs, as determined by Spitzer IRS 5–35 μm slit spectroscopy (Imanishi et al. 2007a, 2010a; Imanishi 2009). For LIRGs, the fraction is derived only from a limited number of sources (Brandl et al. 2006). For ULIRGs, the sample is statistically complete because all ULIRGs optically classified as non-Seyfert in the IRAS1 Jy sample are covered. The total number of sources is 18, 54, and 31 for LIRGs with LIR < 1012 L☉, ULIRGs with 1012 L☉ ⩽ LIR < 1012.3 L☉, and ULIRGs with LIR ⩾ 1012.3 L☉, respectively.
Download figure:
Standard image High-resolution image
The AGN luminosity increases when the mass accretion rate onto an SMBH increases. The luminosity dependence of AGN–starburst connections suggests that more (less) infrared luminous galaxies currently are actively (sluggishly) accreting mass onto SMBHs. More luminous buried AGNs with higher SMBH mass accretion rates could provide stronger feedback to the surrounding host galaxy, because the buried AGNs are still surrounded by a large amount of gas and dust. As Imanishi et al. (2010a) have argued, galaxies with greater infrared luminosities not only demonstrate the relatively higher energetic importance of buried AGNs but also indicate higher absolute star formation rates, and thus are likely to be the progenitors of more massive galaxies with larger stellar masses. The recently discovered galaxy downsizing phenomenon, in which massive red galaxies have completed their major star formation more quickly in an earlier cosmic age (Cowie et al. 1996; Heavens et al. 2004; Bundy et al. 2005), is widely argued to have resulted from stronger AGN feedback in the past (Granato et al. 2004; Sijacki et al. 2007; Booth & Schaye 2009). Our new AKARI results further indicate a possible connection between buried AGN feedback and the origin of the galaxy downsizing phenomenon.
6. SUMMARY
We have reported the results of systematic AKARI IRC infrared 2.5–5 μm slit-less spectroscopy of LIRGs (LIR = 1011–1012 L☉) and ULIRGs (LIR ⩾ 1012 L☉) in the local universe at z< 0.3. The slit-less spectroscopic capability of AKARI IRC is particularly useful for investigating the properties of LIRGs, which often display spatially extended emission structures. When we combine these results with previously obtained AKARI IRC spectra of ULIRGs, the total number of observed LIRG and ULIRG nuclei is >150. This is by far the largest 2.5–5 μm spectral database of LIRGs and ULIRGs, and thus is useful for investigating their general properties. We draw the following major conclusions.
- 1.The 3.3 μm PAH emission features (the signatures of starburst activity) were detected in the bulk of the observed LIRGs and ULIRGs. The AKARI IRC slit-less spectra clearly indicated that the upper envelope of the 3.3 μm PAH to infrared luminosity ratios was L3.3 PAH/LIR ∼ 10−3. Given that flux attenuation of the 3.3 μm PAH emission is insignificant for dust extinction with AV < 30 mag, this ratio can be used as a canonical value for starburst activity with modest dust obscuration (AV < 30 mag), as has been widely assumed.
- 2.Starburst luminosities were estimated from the observed 3.3 μm PAH emission features and Brα (λrest = 4.05 μm) emission lines. Both methods provided roughly consistent results, suggesting that the 3.3 μm PAH and Brα emission are both good indicators of the absolute magnitudes of modestly obscured starbursts.
- 3.For sources with clearly detectable Brα (λrest = 4.05 μm) and Brβ (λrest = 2.63 μm) emission lines, it was confirmed that the Brβ/Brα flux ratios fell within the expected range of case B (104 K) theory, within a factor of ∼2.
- 4.The L3.3 PAH/LIR ratios of LIRGs are >0.5 × 10⁻³ in many cases for which the bulk of the observed large infrared luminosities could be accounted for by detected modestly obscured starburst activity. However, the L3.3 PAH/LIR ratios of ULIRGs are mostly less than half the canonical ratio for modestly obscured starbursts, and hence ULIRGs are generally PAH-deficient. Additional energy sources, such as AGNs or very heavily obscured starbursts (AV > 30 mag), would be required in the majority of ULIRGs.
- 5.For the PAH-deficient ULIRGs, the equivalent widths of the 3.3 μm PAH emission, the optical depths of the dust absorption features observed at 2.5–5 μm, and the continuum slopes were used to find potential hosts for AGNs (the energy sources of which should be more centrally concentrated than dust), by differentiating them from heavily obscured starbursts (with mixed dust/source geometry). More than half of the observed ULIRGs that are optically classified as non-Seyferts displayed luminous buried AGN signatures. The detectable buried AGN fraction in optically non-Seyfert galaxies was found to systematically increase with increasing galaxy infrared luminosity, from LIRGs to ULIRGs.
- 6.The fraction of sources with strong dust absorption features and/or very red continuum emission was substantially higher in ULIRGs than in LIRGs, suggesting that the contributions from obscured emission to the observed 2.5–5 μm fluxes are higher in ULIRGs.
- 7.For sources with clearly detectable AGN signatures, the dust extinction toward the AGN-heated, PAH-free continuum emission was derived from the optical depths of the absorption features at λrest = 3.1 μm by ice-covered dust grains, and at λrest = 3.4 μm by bare carbonaceous dust grains. The intrinsic, extinction-corrected AGN luminosities were then estimated and were quantitatively found to be comparable to or even larger than the observed infrared luminosities when 3.4 μm bare carbonaceous dust absorption features were detected. For these sources, the AGNs could be energetically dominant. However, for sources with AGN signatures, but without detectable 3.4 μm dust absorption features, the estimated intrinsic AGN luminosities were far below the observed infrared luminosities. The intrinsically weak 3.4 μm dust absorption features could be diluted by PAH sub-peaks at the same wavelength, and the dust extinction of the AGN-heated dust emission might be underestimated for these sources.
- 8.The AKARI IRC spectra are unique in that CO2 absorption features at λrest = 4.26 μm, inaccessible from the ground, were detected in many of the observed LIRGs and ULIRGs. The CO2-absorption-detected sources often accompany clear 3.1 μm H2O ice absorption features, as is expected from the formation scenario for CO2 molecules through the photolysis of ice-covered dust grains.
This work is based on observations made with AKARI, a JAXA project, with the participation of ESA. We thank the AKARI IRC instrument team for making this study possible. We thank the anonymous referee for his/her useful comments. M.I. was supported by a Grant-in-Aid for Scientific Research (19740109). Part of the data analysis was performed using a computer system operated by the Astronomical Data Analysis Center (ADAC) and the Subaru Telescope of the National Astronomical Observatory, Japan. This research made use of the SIMBAD database, operated at CDS, Strasbourg, France, and the NASA/IPAC Extragalactic Database (NED) operated by the Jet Propulsion Laboratory, California Institute of Technology, under contract with the National Aeronautics and Space Administration.
Footnotes
- 6
In this paper, galaxies with LIR = 1011–1012 L☉ are called LIRGs, while those with LIR ⩾ 1012 L☉ are referred to as ULIRGs.
- 7
- 8
Strictly speaking, AGNs, which have well-developed NLRs but their optical emission is obscured by host galaxy dust, could be optically elusive but infrared detectable. Such AGNs are included in our buried AGN category.