


ABSTRACT
We have conducted millimeter-wave observations of deuterated species of various carbon-chain molecules toward a low-mass star-forming region, L1527, which shows extraordinary richness of carbon-chain molecules in a vicinity of the protostar (Warm Carbon Chain Chemistry; WCCC). We have detected the spectral lines of l-C3D, C4D, C4HD, DC3N, DC5N, and c-C3HD, where l-C3D and C4HD are detected for the first time in space. The deuterium fractionation ratios are found to be moderate (2% to 7%), although they tend to be higher than those in the starless core, TMC-1. The upper limit to the [CH2DOH]/[CH3OH] ratio is also as low as 3%. Therefore, high deuterium fractionation ratios reported for hot corino sources are not seen in L1527. The observed ratios mean that the depletion of CO onto dust grains had not proceeded far in L1527, compared to the hot corino case. This would be consistent with a short timescale of the starless core phase, as suggested for the possible origin of WCCC.
Export citation and abstract BibTeX RIS
1. INTRODUCTION
Chemical evolution from a protostellar disk to a protoplanetary disk in low-mass star-forming regions is an important subject to be addressed observationally, because it is a missing link between interstellar chemistry and planetary chemistry. A recent remarkable achievement in this direction was the discovery of complex organic molecules, such as HCOOCH3, (CH3)2O, and C2H5CN in hot corinos around low-mass protostars (e.g., Cazaux et al. 2003; Bottinelli et al. 2004; Sakai et al. 2006). It had long been thought that these molecules are specific to hot cores in massive star-forming regions. Their discovery in low-mass hot corinos clearly demonstrated that complex organic molecules are already formed around low-mass protostars, and may further be incorporated into protoplanetary disks.
It has been believed that the chemical composition of low-mass protostars is thought to be relatively uniform within various classes, and hence, that the chemical evolution from a protostellar disk to a protoplanetary disk could be understood with a single common picture. However, we have recently discovered a star-forming region, L1527, whose chemical composition is quite different from those of hot corinos. L1527 is known to be in class 0 (Ohashi et al. 1997) or in a transient phase from class 0 to class I (André et al. 2000). In this source, various carbon-chain molecules are extraordinarily abundant in warm and dense gas found near to the protostar (Sakai et al. 2008a). Mapping of C4H with the Nobeyama 45 m telescope shows that the distribution is concentrated toward the protostar, and more importantly that the line width is broader toward the protostar position. This indicates that the carbon-chain molecules can exist in an infalling envelope around the protostar.
The above results for L1527 apparently contradict with current understanding of the carbon-chain chemistry (e.g., Suzuki et al. 1992; Aikawa et al. 2001). Carbon-chain molecules are preferentially produced in the early evolutionary stage of starless cores, where the atomic carbon has not all been converted to CO, and then become deficient in evolved starless cores and protostellar cores. The extraordinary richness of carbon-chain molecules in L1527 suggests a new carbon-chain chemistry occurring in a lukewarm region, which we have called Warm Carbon Chain Chemistry (WCCC; Sakai et al. 2008a). In WCCC, carbon-chain molecules are thought to be efficiently regenerated in a vicinity of the protostar, triggered by the evaporation of CH4 from grain mantles. Since the sublimation temperature of CH4 is 30 K, much lower than that of H2O, such chemical processes can occur in a warm region extending to a few thousand AU from a protostar with 1 M☉ (Masunaga & Inutsuka 2000; Aikawa et al. 2008). The basic mechanism of WCCC was confirmed by chemical model simulations by Aikawa et al. (2008) and Hassel et al. (2008). Furthermore, a second WCCC source, IRAS15398-3359 in Lupus, has recently been found by Sakai et al. (2009), indicating that WCCC is not specific to L1527. Considering that carbon-chain molecules are generally deficient in hot corions, it seems likely that the chemical composition of low-mass star-forming regions may show significant variation with the two extreme cases of hot corino chemistry and WCCC. A comprehensive study of the WCCC sources is therefore important for a deeper understanding of the origin of the chemical variation in low-mass class 0 sources.
It is well established that heavy deuterium fractionation is generally seen in hot corino sources, although it is also seen in the coldest starless cores (e.g., Caselli et al. 2008; Dalgarno 2006). For instance, the [HDCO]/[H2CO] and [CH2DOH]/[CH3OH] ratios are as high as 15% and 37%, respectively in the low-mass protostar, IRAS16293-2422 (e.g., van Dishoeck et al. 1995; Parise et al. 2006). More strikingly, doubly and triply deuterated molecules have also been detected in hot corino sources (e.g., van der Tak et al. 2002; Parise et al. 2002; Parise et al. 2004; Marcelino et al. 2005). Such heavy fractionation is a characteristic feature of hot corino chemistry, and is not seen in the hot cores of high-mass star-forming regions. It originates from the heavy depletion of CO onto dust grains together with sufficient time for deuterium exchange reactions to occur during the prestellar collapse phase (e.g., Caselli et al. 1999; Hirota et al. 2001).
An important question to ask is whether high deuterium fractionation is seen in the WCCC sources as it is for the hot corino sources. In particular, it is interesting to assess the deuterium fractionation ratios of the carbon-chain molecules which are abundant in the WCCC sources. These ratios would provide important information constraining the WCCC mechanism, and if they are high enough, new deuterated carbon-chain molecules could be detected. With this motivation, we have conducted sensitive observations of deuterated molecules toward one of the WCCC sources, L1527.
2. OBSERVATIONS
2.1. Observation with the IRAM 30 m
Observations of all the lines in the 90 and 150 GHz regions listed in Table 1 were carried out with the IRAM 30 m telescope at Pico Veleta toward L1527 in 2007 July 11–14 and 2008 April 15–28. The observed position was (α2000, δ2000) = (04h39m53 89, 26°03'11
 0), which is the IRAS position of L1527. The 3 and 2 mm Superconductor–Insulator–Superconductor (SIS) receivers (A/B100 and C/D150) were used as front ends, whose system noise temperatures ranged from 80 to 160 K and from 190 to 270 K, respectively. The beam size of the telescope is 279 and 171 at 88.3 and 143.5 GHz, respectively. The main beam efficiency is 0.81 and 0.75 at 88.3 and 143.5 GHz, respectively. The telescope pointing was checked every hour by observing nearby continuum sources, and was maintained to be better than 4''. The back end was an autocorrelator, VESPA. We set the individual bandwidth and resolution to be 20 MHz and 20 kHz, respectively. The frequency resolution corresponds to a velocity resolution of 0.07 km s−1 at 88.3 GHz, which is narrower than the typical line width of L1527 (0.5 km s−1). Most of the observations were made in the wobbler switching mode with a 120'' throw. We also observed the HC3N lines (J = 10–9 and J = 17–16) using the position switching mode with an offset of Δα = 30', Δδ = 30', and confirmed that the line intensities are almost the same as those observed by the wobbler switching mode. For the l-C3H and HC5N lines, we used frequency switching mode with an offset of 2 MHz.
Table 1. Molecular Lines Observed Toward L1527
| Species | Transition | Frequency (GHz) | S | Eu (K) | TMBa (mK) | dva (km s−1) | ∫TMBdv(3σ) (mK km s−1) | VLSRa,b (km s−1) | rmsc (mK) |
|---|---|---|---|---|---|---|---|---|---|
| l-C3H | 2Π1/2, J = 9/2–7/2 | ||||||||
| F = 5–4, e | 97.995166 | 4.89 | 12.5 | 552(19) | 0.44(2) | 263(18) | 5.8 | 13.5 | |
| F = 4–3, e | 97.995913 | 3.89 | 12.5 | 399(20) | 0.42(2) | 192(17) | 5.8 | 13.7 | |
| F = 5–4, f | 98.011611 | 4.89 | 12.5 | 515(16) | 0.50(2) | 280(17) | 5.8 | 11.4 | |
| F = 4–3, f | 98.012524 | 3.89 | 12.5 | 436(18) | 0.39(2) | 191(15) | 5.8 | 12.8 | |
| l-C3D | 2Π1/2, J = 9/2–7/2 | ||||||||
| F = 11/2–9/2, e | 88.318409 | 5.33 | 11.3 | ... | 0.81(14)d | 16(4)d | ... | 1.2 | |
| F = 9/2–7/2, e | 88.318513 | 4.22 | 11.3 | ... | ... | ... | ... | ... | |
| F = 7/2–5/2, e | 88.318662 | 3.33 | 11.3 | ... | ... | ... | ... | ... | |
| F = 11/2–9/2, f | 88.345688 | 5.33 | 11.3 | ... | 1.59(15)d | 38(6)d | ... | 1.8 | |
| F = 9/2–7/2, f | 88.345883 | 4.22 | 11.3 | ... | ... | ... | ... | ... | |
| F = 7/2–59/2, f | 88.345997 | 3.33 | 11.3 | ... | ... | ... | ... | ... | |
| c-C3H2 | 43,2 − 42,3 | 85.656431 | 1.75 | 29.1 | 511(5) | 0.59(1) | 328(6) | 5.9 | 3.5 |
| c-C3HD | 43,2 − 42,3 | 85.643313 | 1.90 | 26.6 | 43(7) | 0.34(6) | 16(5) | 5.9 | 4.9 |
| C4D | N = 10–9, F1 | 88.308034 | 10.48 | 23.3 | 39(4) | 0.44(5) | 19(4) | 5.9 | 2.9 |
| F2 | 88.344000 | 9.47 | 23.3 | 41(4) | 0.29(3) | 14(3) | 5.8 | 2.9 | |
| C4H2 | 51,5 − 41,4 | 44.471138 | 4.80 | 19.9 | 323(24) | 0.54(2) | 241(28) | 5.9 | 17.0 |
| 50,5 − 40,4 | 44.659015 | 5.00 | 6.4 | 176(17) | 0.50(6) | 91(18) | 5.7 | 11.8 | |
| 51,4 − 41,3 | 44.844590 | 4.80 | 20.0 | 300(23) | 0.52(5) | 167(26) | 5.8 | 16.4 | |
| C4HD | 50,5 − 40,4 | 42.377275 | 5.00 | 5.3 | 23(4) | 0.30(6) | 7(3) | 5.8 | 2.9 |
| HC3N | J = 5–4 | ||||||||
| F = 5–5 | 45.488839 | 0.06 | 6.5 | 132(20) | 0.56(9) | 71(25) | 6.0 | 12.0 | |
| (F = 6–5, 5–4, 4–3)d | 45.490314 | 4.86 | 6.5 | 3572(28) | 0.87(1) | 3373(31) | 6.2 | 12.0 | |
| J = 10–9 | |||||||||
| F = 10–10 | 90.977481 | 0.03 | 24.0 | 45(6) | 0.28(4) | 13(6) | 6.0 | 7.2 | |
| (F = 11–10, 10–9, 9–8)d | 90.979023 | 9.93 | 24.0 | 3556(15) | 0.58(1) | 2344(7) | 6.0 | 3.8 | |
| F = 9–9 | 90.980728 | 0.03 | 24.0 | 26(4) | 0.54(10) | 19(8) | 5.9 | 5.0 | |
| J = 17–16 | 154.657284 | 17.00 | 66.8 | 911(34) | 0.59(3) | 637(43) | 5.9 | 24.1 | |
| DC3N | J = 5–4 | 42.215583 | 5.00 | 6.1 | 222(12) | 0.70(4) | 170(17) | 5.9 | 7.9 |
| J = 10–9 | 84.429814 | 10.00 | 22.3 | 230(6) | 0.45(1) | 91(6) | 5.9 | 4.2 | |
| J = 17–16 | 143.524871 | 17.00 | 62.0 | 36(10) | 0.88(29) | 22(19) | 5.8 | 7.3 | |
| HC5N | J = 16–15 | 42.602153 | 16.00 | 17.4 | 1190(25) | 0.49(1) | 585(16) | 5.9 | 11.3 |
| J = 17–16 | 45.264720 | 17.00 | 19.6 | 1154(17) | 0.47(1) | 615(25) | 5.9 | 17.0 | |
| J = 32–31 | 85.201340 | 32.00 | 67.5 | 136(4) | 0.57(2) | 83(5) | 5.9 | 3.1 | |
| DC5N | J = 17–16 | 43.215438 | 17.00 | 18.7 | 44(5) | 0.38(5) | 17(4) | 5.9 | 3.8 |
| J = 32–31 | 83.885953 | 32.00 | 64.4 | ... | ... | ≤ 6 | ... | 3.3 | |
| CH3OH | 10 − 00 A+ | 48.372456 | 0.78 | 2.3 | 680(40) | 0.39(3) | 296(33) | 5.8 | 27.9 |
| CH2DOH | 10,1 − 00,0 e0 | 44.71386 | 1.00 | 2.1 | ... | ... | ⩽ 6 | ... | 5.3 |
Notes. The numbers in parentheses represent the errors in units of the last significant digits. aObtained by a Gaussian fit. The error denotes one standard deviation. bRest frequency errors (typicaly 0.01–0.1 km s−1) are much larger than Gaussian fitting errors. cThe rms noise averaged over the line width. dBlended.
Download table as: ASCIITypeset image
2.2. Observation with the Green Bank Telescope
All the lines in the 40 GHz region listed in Table 1 were observed with Robert C. Byrd Green Bank Telescope (GBT) of the National Radio Astronomy Observatory4 in 2008 October. We used the Q-band receiver, whose instantaneous bandwidth is 4 GHz. The beam size of the telescope is 175, and the main beam efficiency is 0.60 at 42.4 GHz. The pointing of the telescope was checked by observing the nearby continuum sources every hour, and the maximum pointing error was 6''. The frequency-switching mode with a frequency offset of ±1 MHz was employed for the observations. The system temperature during the observations ranged from 60 K to 90 K. We used a bank of the autocorrelators as back ends, whose bandwidth and resolution each are 50 MHz and 12 kHz, respectively. The resolution corresponds to a velocity resolution of 0.085 km s−1 at 42.4 GHz. The intensity scale was calibrated by using the noise injection diode. We took the weighted average of the spectra of the right- and left-handed circular polarizations to obtain the final spectrum.
3. RESULTS
3.1. l-C3D
The Λ-type doubling components (e and f) of the 2Π1/2 J = 9/2–7/2 transition of l-C3D were successfully detected, as shown in Figure 1. This is the first detection of l-C3D in space. Since the hyperfine components due to the D nucleus are partly resolved, the line widths are broader than those of other molecules (∼0.5 km s−1). The laboratory rotational spectrum of l-C3D was first measured by Yamamoto et al. (1990). They found that l-C3D has an extremely low vibrationally excited state (ν42Σμ) between the 2Π1/2 and 2Π3/2 states owing to a strong vibronic interaction. We have newly calculated the hyperfine component frequencies for the above transition on the basis of new hyperfine structure constants, reported by Kim & Yamamoto (2005) using a full consideration of the vibronic interaction. These are listed in Table 1. Details of the calculation and a list of the frequencies for the other transitions are given in the Appendix. The e component is well fit by composition of three Gaussians corresponding to the three hyperfine components, whereas the f component is not (Figure 2). Moreover, the f component seems to be stronger than the e component. These features of the f component would most likely be due to contamination by unknown lines in the low-velocity (high-frequency) side. If we assume the same intensity for the e and f components, the fit to the f component shows a residual, clearly indicating a pair of lines (Figure 2). These lines remain unassigned, and can be regarded as the unidentified lines. Since the line profile of the e component is well fitted to the hyperfine structure and the f component does not show negative residuals in the fit, the identification of l-C3D is unambiguous. Hence, we only use the e component in our further analysis.
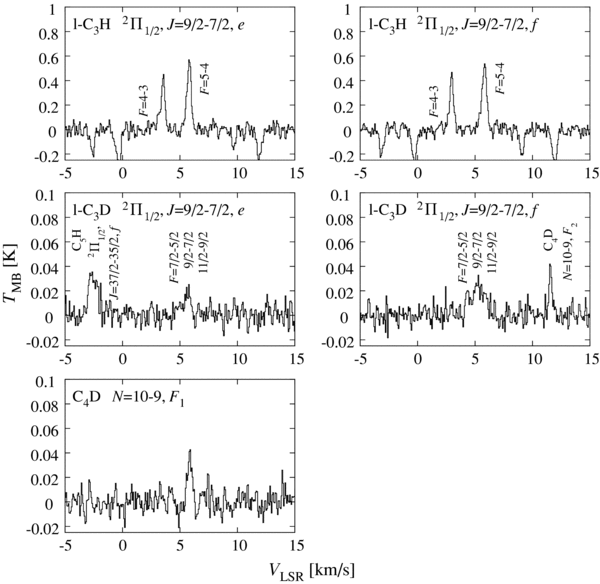
Figure 1. Spectral line profiles of l-C3H, l-C3D, and C4D in L1527. As for l-C3H, the VLSR values are calculated for the frequencies of the F = 5–4 hyperfine components. The VLSR values for l-C3D are calculated for the frequencies of the F = 11/2–9/2 components. Negative features in the l-C3H spectra are artifacts caused by frequency switching.
Download figure:
Standard image High-resolution image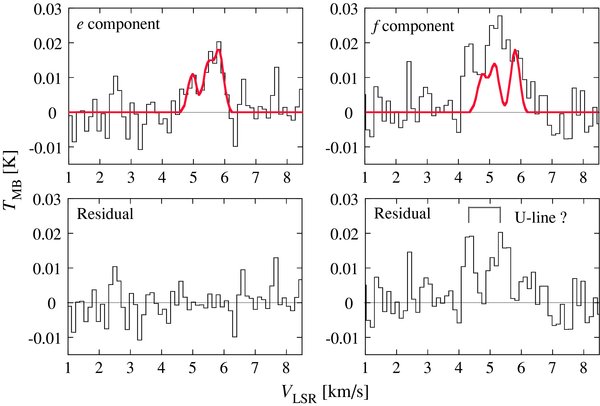
Figure 2. Observed and calculated spectra of l-C3D. The e component is well fit by a triple Gaussian function representing the three hyperfine components, whose frequencies and relative intensities are given in Table 1. The line width is fixed to 0.34 km s−1, which is the value determined for c-C3HD. The VLSR and peak temperature of the strongest component (F = 11/2–9/2, e) is determined to be (5.83 ± 0.11) km s−1 and (0.017 ± 0.006) K, respectively. The f component spectrum is calculated by using the parameters obtained for the e component. The residual shows contamination from doublet lines. Although we carefully checked the available databases such as the CDMS (Müller et al. 2005), JPL catalogs (Pickett et al. 1998), and Toyama Microwave Atlas (http://www.sci.u-toyama.ac.jp/phys/4ken/atlas/), they are still unidentified (U). The frequencies of the U lines are 88345.83 MHz and 88346.13 MHz, where the VLSR is assumed to be 5.85 km s−1.
Download figure:
Standard image High-resolution imageIn the present study, the column densities are evaluated under the assumption of local thermodynamic equilibrium (LTE) conditions, where the effects of optical depth are taken into account (Sakai et al. 2008a). We assume the excitation temperature to be the same as the rotational temperature of C4H2 (12.3 ± 2.3 K) obtained by Sakai et al. (2008a). This is close to the beam averaged gas kinetic temperature of 13.9 ± 1.3 K derived from the K = 1 and 2 lines of CH3CCH (Sakai et al. 2008a), and hence, the rotational level population of C4H2 is almost thermalized. The above kinetic temperature is based on the observation of Nobeyama 45 m telescope whose beam size is 20'', and does not conflict with the WCCC hypothesis, which requires the temperature above 30 K. The beam-averaged kinetic temperature can be 13.9 K, because of the contribution of the cold envelope emission. Since the dipole moment of l-C3D is 3.1 D, smaller than that of C4H2 (4.5 D), the rotational level population of l-C3D is also considered to be thermalized. Thus, the LTE assumption is justified. The source coupling factor is assumed to be unity, because the distribution of a related carbon-chain molecule, C4H, is known to be extended over a 40'' scale around the protostar (Sakai et al. 2008a). The column density of l-C3D is determined to be (1.6 ± 0.4) × 1011 cm−2 from the e component data, where the partition function is calculated by considering rotational energy levels of the 2Π1/2, 2Π3/2, and 2Σμ states. The quoted error is evaluated from three times the root-mean-square (rms) noise of the integrated intensities and uncertainty in the excitation temperature (±2.3 K; the 3 σ error for the C4H2 case).
We also observed the Λ-type doubling components (e and f) of the 2Π1/2 J = 9/2–7/2 line of l-C3H. The line profiles are shown in Figure 1, and the line parameters are listed in Table 1. Note that we observed the lines of l-C3D and l-C3H with the same rotational quantum numbers. In contrast to l-C3D, the hyperfine structure components (F = 5–4 and F = 4–3) due to the H nucleus are clearly resolved for both Λ-type doubling components of l-C3H (Gottlieb et al. 1985). The column density of l-C3H is evaluated under the same assumptions employed for the l-C3D case. It is found to be (3.3 ± 0.4) × 1012 cm−2 by a least-squares analysis of the observed intensities of the four component lines. The optical depths are as low as 0.06. The error quoted is three times the standard deviation involving the uncertainty in the excitation temperature of ±2.3 K.
The deuterium fractionation ratio of [l-C3D]/[l-C3H] is then evaluated to be (4.8+1.4−2.1) × 10−2 from the column densities determined above. The ratio is insensitive to the assumed rotational temperature; even if we assume excitation temperatures of 5 K and 20 K, the ratios become 3.2 × 10⁻² and 5.1 × 10⁻², respectively. The derived ratio is comparable to the ratio of the integrated intensities of the e component between l-C3D and l-C3H, (3.4 ± 0.9) × 10−2.
3.2. C4D
The two fine-structure component lines (F1 and F2) of C4D were clearly detected, as shown in Figure 1. For C4D, the hyperfine components due to the D nucleus are not resolved for the fine-structure components, and hence, we ignore the hyperfine structure in the following analysis. The column density of C4D is derived to be (3.0 ± 1.1) × 1012 cm−2 from a least-squares analysis of the observed intensities for the two components. Here, we assume LTE conditions with an excitation temperature of 12.3 ± 2.3 K. The dipole moment of C4H and C4D (0.9 D) are much smaller than that of C4H2, and hence, the rotational level populations are expected to be thermalized. The error is evaluated as described in the previous section. The column density of C4H derived from the IRAM 30 m observation was reported to be (1.6 ± 0.3) × 1014 cm−2 under the same assumption for the excitation temperature (Sakai et al. 2008b). Therefore, the [C4D]/[C4H] ratio is determined to be (1.8 ± 0.5) × 10−2, where the error is three times the standard deviation. As shown in Section 3.1, the ratio is insensitive to the assumed excitation temperature, if the same temperature can be applied for the normal and D species.
3.3. C4HD
A carbon-chain carbene, C4H2, is a characteristic species in WCCC, and hence, we searched for its deuterated species in the present study. Laboratory spectroscopy of C4HD is reported only for the Ka = 0 ladder, where the effective rotational and centrifugal distortion constants are given (Kim & Yamamoto 2005). We calculate the transition frequency of the 505–404 line by use of these constants, as shown in Table 1. The error in the rest frequency is estimated to be less than 0.01 MHz. In our GBT observations, we found the line of C4HD exactly at the expected frequency with a confidence level of 8.6σ in the integrated intensity. The line profile is shown in Figure 3, and the line parameters are listed in Table 1. We carefully checked the available molecular line databases, including the CDMS (Müller et al. 2005), JPL catalogs (Pickett et al. 1998), and Toyama Microwave Atlas (see caption of Figure 2), and confirmed that no other lines appear at the frequency within a tolerance of 0.5 km s−1. The local standard of rest (LSR) velocity of 5.8 km s−1 is consistent with the corresponding normal species, C4H2. This is the first detection of C4HD in space. The column density of C4HD is derived to be (6.2 ± 2.2) × 1010 cm−2 under the assumption of LTE conditions with an excitation temperature of 12.3 ± 2.3 K. Here, the partition function is calculated by considering all the rotational levels of C4HD with J ⩽ 50 and Ka ⩽ 1, which are calculated from the rotational constants (A = 201 GHz, B = 4.27 GHz, and C = 4.18 GHz) obtained from the molecular structure (Killian et al. 1990). The error is evaluated as described in Section 3.1.
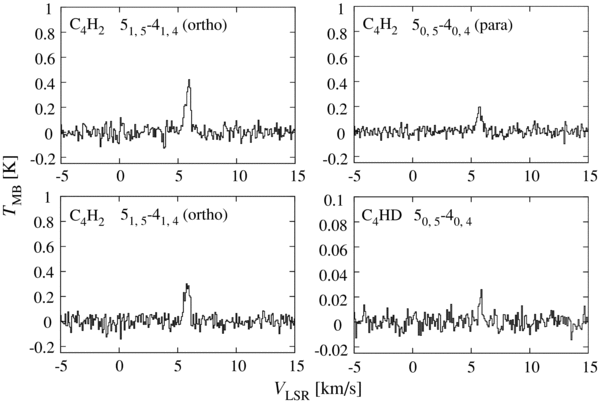
Figure 3. Spectral line profiles of C4H2 and C4HD in L1527.
Download figure:
Standard image High-resolution imageThe column density of the para species of C4H2 is derived from the intensity of the 50,5–40,4 line, whereas that of ortho species is from the intensities of the 51,5–41,4 and 51,4–41,3 lines. Assuming the excitation temperature of 12.3 ± 2.3 K, the column density of para-C4H2 is derived to be (3.7 ± 0.7) × 1011 cm−2, whereas for ortho-C4H2 it is (1.7 ± 1.0) × 1012 cm−2. The total column density is thus evaluated to be (2.1 ± 1.0) × 1012 cm−2. Here, the errors are estimated from the 3σ noise of the integrated intensity, as in the case of Section 3.1. The derived column density is consistent with the value ((1.6 ± 0.3) × 1012 cm−2) reported for this molecule by Sakai et al. (2008a).
In evaluation of the [C4HD]/[C4H2] ratio, we employ the column density of C4H2 derived in the present study, because the excitation condition of the observed line is similar to the C4HD line. Thus the ratio is evaluated to be 3.0+2.1−1.7 × 10⁻², where the error is three times the standard deviation.
3.4. DC3N and DC5N
We detected the J = 5–4, J = 10–9, and J = 17–16 lines of DC3N as well as those of the normal species. Their spectral line profiles are shown in Figure 4. As for the normal species, the weak hyperfine components with ΔF = 0 (F = 5–5 for J = 5–4 and F = 10–10 and F = 9–9 for J = 10–9) were also detected, in addition to the main hyperfine components with ΔF = 1. Since the intrinsic line strengths of these weak components are smaller than the total line strengths of the main components by a factor of 73 and 298 for J = 5–4 and J = 10–9, respectively, the main hyperfine components of these lines are not optically thin, as we mention below.

Figure 4. Spectral line profiles of HC3N and DC3N in L1527. Inserts in the HC3N (J = 5–4 and 10–9) spectra are expansions of the weak hyperfine components (ΔF = 0).
Download figure:
Standard image High-resolution imageIn deriving the column density of HC3N, we first tried the LTE analysis using a single excitation temperature, where the effect of the optical depth is taken into account. However, we failed to fit the three transitions simultaneously; the standard deviation of the fit is 380 mK, being much larger than the errors of the observed intensities (6–34 mK). When only the J = 5–4 and J = 10–9 data including the weak hyperfine components are used, the excitation temperature is determined to be 9.7 ± 0.2 K. On the other hand, it is determined to be 16.9 ± 0.5 K, if the J = 10–9 and J = 17–16 data are used. Although the excitation conditions are quite different in the two cases, the average excitation temperature is close to the excitation temperature employed in the analyses for other molecules (12.3 K). This situation is also true for DC3N. When the J = 5–4 and J = 10–9 data are used, the excitation temperature is evaluated to be 7.7 K. In contrast, it is determined to be 15.6 K from the J = 10–9 and J = 17–16 data. These results mean that the excitation conditions for the HC3N and DC3N lines with the same quantum numbers are similar to each other. Hence, we evaluate the column densities of HC3N and DC3N for the two cases separately; one for the J = 5–4 and J = 10–9 lines, whereas the other for the J = 10–9 and J = 17–16 lines.
First, the HC3N (J = 5–4 and J = 10–9) data and the DC3N (J = 5–4 and J = 10–9) data are simultaneously fitted by a least-squares method to obtain the column densities of HC3N and DC3N as well as the common excitation temperature. The column density of HC3N, that of DC3N, and the excitation temperature are determined to be (2.7 ± 0.2) × 1013 cm−2, (8.4 ± 3.0) × 1011 cm−2, and 9.7 ± 0.3 K, respectively. Here, the errors denote three times the standard deviation. The [DC3N]/[HC3N] ratio is derived to be (3.1 ± 1.1) × 10−2. The optical depths of the main hyperfine components of the J = 5–4 and J = 10–9 lines are found to be 0.8 and 0.9, respectively.
Then the HC3N (J = 10–9 and J = 17–16) data and the DC3N (J = 10–9 and J = 17–16) data are analyzed similarly. The column density of HC3N, that of DC3N, and the excitation temperature are determined to be (1.19 ± 0.03) × 1013 cm−2, (4.2 ± 1.2) × 1011 cm−2, and 16.9 ± 0.4 K, respectively. The [DC3N]/[HC3N] ratio is derived to be (3.5 ± 1.0) × 10−2, not very different from that obtained from the lower excitation lines. The excitation condition of HC3N and DC3N is not simple due to non-LTE effects, and the higher J lines would tend to exist in the gas close to the protostar. In spite of these, deuterium fractionation ratio of HC3N appears rather constant from the present observations.
We also detected the J = 17–16 line of DC5N as well as the J = 16–15, J = 17–16, and J = 33–32 lines of HC5N, as shown in Figure 5. Their line parameters are given in Table 1. The J = 32–31 line of DC5N was not detected in the present study (Figure 5). In contrast to HC3N, the three lines of HC5N (J = 16–15, J = 17–16, and J = 32–31) can be fitted under the assumption of LTE conditions with a single temperature, probably because two of them are close to each other in the upper state energy. Thus the rotation temperature and the column density of HC5N are evaluated to be 14.7 ± 5.3 K and (6.8 ± 1.4) × 1012 cm−2, respectively, by using a least-squares analysis of the intensities of the three lines. The errors represent three times the standard deviations in the least-squares analysis. The rotation temperature is comparable to that reported for C4H2 (12.3 K). We have recently observed several higher excitation lines of HC5N in the course of a line survey toward L1527 with the Nobeyama 45 m telescope, which will enable us to determine the excitation conditions more accurately. This result will be published separately (N. Sakai et al. 2009, in preparation). On the other hand, the column density of DC5N is determined to be (2.0 ± 0.6) × 1011 cm−2 from the integrated intensity of the J = 17–16 line by assuming the excitation temperature for HC5N (14.7 ± 5.3 K). The error in the column density is derived, as described in Section 3.1. The [DC5N]/[HC5N] ratio is thus evaluated to be (2.9+0.7−1.1) × 10−2. This value is consistent with the integrated intensity ratio between the DC5N (J = 17–16) line and the HC5N (J = 17–16) line, (2.8 ± 0.7) × 10−2.
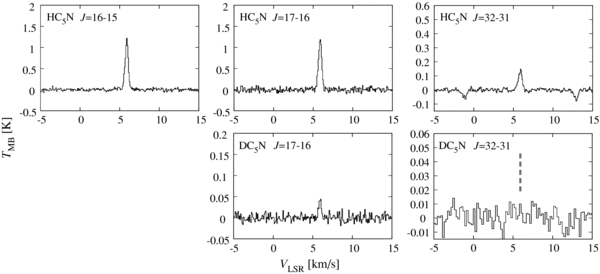
Figure 5. Spectral line profiles of HC5N and DC5N in L1527. Negative features in the HC5N (J = 32–31) spectra are artifacts caused by frequency-switching.
Download figure:
Standard image High-resolution image3.5. c-C3HD
We detected the high excitation line of c-C3HD (43,2–42,3) together with the corresponding line of the normal species, as shown in Figure 6. Since the 43,2 and 42,3 levels of c-C3H2 belong to the ortho species, the column density of ortho c-C3H2 is derived by assuming LTE conditions with the excitation temperature of 12.3 ± 2.3 K. Then, the total column density is evaluated to be (1.3 ± 0.4) × 1013 cm−2 under an assumption of the ortho-to-para ratio of 3. Here, the error is estimated from three times the rms noise, as described in Section 3.1. The ortho-to-para ratio of 3 would be justified, because the ortho-to-para ratio for C4H2 is determined to be 3.0 ± 0.4 in L1527 (Sakai et al. 2008a). Even if the ortho-to para ratio were unity, the total column density would become larger only by a factor of 1.5.
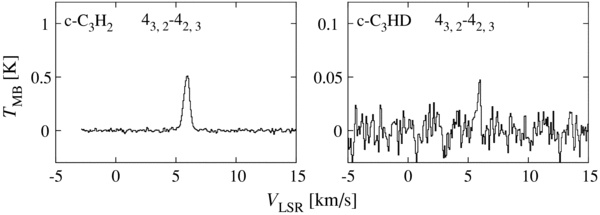
Figure 6. Spectral line profiles of c-C3H2 and c-C3HD in L1527.
Download figure:
Standard image High-resolution imageIn contrast to c-C3H2, c-C3HD has no classification into the ortho and para species due to the lack of rotation symmetry. Then the total column density is evaluated from the intensity of the 43,2–42,3 line to be (9.2 ± 3.9) × 1011 cm−2 by assuming LTE conditions with an excitation temperature of 12.3 ± 2.3 K. Here, the error is based on three times the rms noise as before. The [c-C3HD]/[c-C3H2] ratio is thus derived to be (7.1 ± 2.3) × 10−2. The ratio would be lower by a factor of 1.5, if the ortho-to-para ratio were unity.
3.6. CH2DOH
We carried out a sensitive observation of the 101–000 e0 line of the mono-deuterated methanol, CH2DOH, with GBT. However, the line was not detected within the 3σ rms noise level of 5.3 mK, although the corresponding line (10–00 A+) of CH3OH is as intense as 680 mK (Figure 7). In deriving their column densities, LTE conditions with an excitation temperature of (12.3 ± 2.3) K are assumed. The energy level structure of CH2DOH is completely different from that of CH3OH. As for CH3OH, the A and E states of the internal rotation of the methyl group, each behave as an independent molecule. Therefore, we assume the same column densities for the A and E states. The total column density is evaluated to be (6.3 ± 1.0) × 1013 cm−2. The error is evaluated in the same way as described in Section 3.1. On the other hand, CH2DOH has the e0, e1, and o1 states for its internal rotation, which can be coupled with one another by collisional and radiative transitions. Hence, the populations of these states are assumed to be thermalized with the excitation temperature. We derive an upper limit to the column density to be 1.9 × 1012 cm−2 from three times the rms noise of the spectrum. Hence, the upper limit to the [CH2DOH]/[CH3OH] ratio is evaluated to be 3.0 × 10⁻².

Figure 7. Spectral line profiles of CH3OH and CH2DOH in L1527.
Download figure:
Standard image High-resolution image
4. DISCUSSION
4.1. Comparison with Starless Cores
The column densities obtained above are summarized in Table 2, and the deuterium fractionation ratios for l-C3D, C4HD, C4D, DC3N, DC5N, and c-C3HD are listed in Table 3. The ratios indicate moderate fractionation within a very narrow range from 2% to 7%. Note that the deuterium fractionation ratio is affected by the statistical weight of 2 for [C4HD]/[C4H2] and [c-C3HD]/[c-C3H2] due to presence of a pair of equivalent H nuclei. However, we do not consider this effect in the following discussions, because we do not compare the ratio among different species but only discuss the source-to-source difference of each species.
Table 2. Column Densities of Observed Molecules
| Molecule | N (cm−2) |
|---|---|
| l-C3D | (1.6 ± 0.4) × 1011 |
| l-C3H | (3.3 ± 0.4) × 1012 |
| c-C3HD | (9.2 ± 3.9) × 1011 |
| c-C3H2 | (1.3 ± 0.4) × 1013 |
| C4D | (3.0 ± 1.1) × 1012 |
| C4HD | (6.2 ± 2.2) × 1010 |
| C4H2 | (2.1 ± 1.0) × 1012 |
| DC3N (low)a | (8.4 ± 3.0) × 1011 |
| HC3N (low)a | (2.7 ± 0.2) × 1013 |
| DC3N (high)b | (4.2 ± 1.2) × 1011 |
| HC3N (high)b | (1.19 ± 0.03) × 1013 |
| DC5N | (2.0 ± 0.6) × 1011 |
| HC5N | (6.8 ± 1.4) × 1012 |
| CH2DOH | ⩽1.9 × 10¹² |
| CH3OH | (6.3 ± 1.0) × 1013 |
Notes. aDetermined from the J = 5–4 and J = 10–9 lines. bDetermined from the J = 10–9 and J = 17–16 lines.
Download table as: ASCIITypeset image
Table 3. List of Deuterium Fractionation Ratios
| Ratio | L1527 | TMC-1 | IRAS16293-2422 |
|---|---|---|---|
| [C2D]/[C2H] | ... | 0.048 ± 0.015a | 0.18b |
| [l-C3D]/[l-C3H] | 0.048+0.014−0.021 | ... | ... |
| [c-C3HD]/[c-C3H2] | 0.071 ± 0.023 | 0.0475a | ... |
| [C4D]/[C4H] | 0.018 ± 0.005 | 0.0043c | ... |
| [C4HD]/[C4H2] | 0.030+0.021−0.017 | ... | ... |
| [DC3N]/[HC3N] | 0.031 ± 0.011d, 0.035 ± 0.010e | 0.0145a | ... |
| [DC5N]/[HC5N] | 0.029+0.007−0.011 | 0.016f | ... |
| [CH2DOH]/[CH3OH] | ⩽0.030 | ... | 0.37+0.38−0.19g |
| [HDCO]/[H2CO] | 0.06 ± 0.025h, 1.7+2.6−1.1g | 0.0595a | 0.15 ± 0.07g |
| [NH2D]/[NH3] | 0.04 ± 0.02i | 0.00085a | 0.1b |
| [N2D+]/[N2H+] | 0.06 ± 0.01h | 0.04 ± 0.01j | ... |
| [DNC]/[HNC] | 0.046 ± 0.004k | 0.028 ± 0.002k | 0.091 ± 0.005k |
Notes. aTurner (2001). bvan Dishoeck et al. (1995). cTurner (1989). dDetermined from the J = 5–4 and J = 10–9 lines. eDetermined from the J = 10–9 and J = 17–16 lines. fSchloerb et al. (1981). gParise et al. (2006). hRoberts & Millar (2007). iHatchell (2003). jCrapsi et al. (2005). kHirota et al. (2001).
Download table as: ASCIITypeset image
First, we compare the observed ratios with those in a starless core TMC-1, where C4D, DC3N, DC5N, and c-C3HD have been detected. The [C4D]/[C4H] ratio in TMC-1 is reported to be 4.3 × 10⁻³ (Turner 1989). The ratio observed in L1527 (0.018) is significantly higher than this value. A similar trend can be seen for the [DC3N]/[HC3N] ratio; the ratio in L1527 (0.029) is higher than that in TMC-1 (0.0145; Turner 2001), although the difference is marginal. The [DC5N]/[HC5N] ratio in L1527 (0.029) is also higher than the ratio reported for TMC-1 (0.016; Schloerb et al. 1981). The [c-C3HD]/[c-C3H2] ratio in L1527 is 0.071, being higher than that reported for TMC-1 (0.029; Bell et al. 1986). These trends can also be seen in the [DNC]/[HNC] ratio (Hirota et al. 2001) and the [NH2D]/[NH3] ratio (Hatchell 2003; Turner 2001), as shown in Table 3. Therefore, the deuterium fractionation ratios in L1527 are systematically higher at least by a factor of 1.5 than in TMC-1.
It should be noted that the [DNC]/[HNC] ratio in L1527 (0.046) is higher than those found in the young starless cores L1521E and L1521B (0.008 and 0.012, respectively) (Hirota et al. 2001), and is comparable to that in an evolved starless core, L1544 (0.034). In contrast, the ratio is even lower than those found in starless cores in the Ophiuchus region, such as L63 and L1689B (0.117 and 0.060, respectively). This point will be discussed further in Section 4.3.
Owing to the moderate deuterium fractionation and high abundances of carbon-chain molecules, the two new deuterated carbon-chain molecules, l-C3D and C4HD, have been detected for the first time. As we demonstrated in the case of C4H− (Sakai et al. 2008b), L1527 is a useful source for searching for new molecules.
4.2. Comparison with Hot Corino Sources
On the other hand, the deuterium fractionation ratios in L1527 are not as high as found in hot corino sources. The most striking result is for the [CH2DOH]/[CH3OH] ratio. This ratio is as high as 0.37 in a hot corino source, IRAS16293-2422 (Parise et al. 2006), whereas it is less than 0.030 (3 σ) in L1527. Similarly, the [NH2D]/[NH3] ratio is lower than that in IRAS16293-2422 (Hatchell 2003) by a factor of 2.5. Since the carbon-chain molecules are deficient in hot corino sources, we cannot directly compare their deuterium fractionation ratios. Nevertheless, the [C2D]/[C2H] ratio in IRAS16293-2422 is reported to be 0.18 (van Dishoeck et al. 1995), much higher than the deuterium fractionation ratios of the carbon-chain molecules which we have found in L1527 by factors of 3–6.
The [HDCO]/[H2CO] ratio is difficult to compare, as there are two independent papers reporting different ratios in L1527. Parise et al. (2006) reported a very high ratio (1.7), whereas Roberts & Millar (2007) reported a moderate ratio of 0.06. In the latter case, the fractionation ratio is consistent with those of other molecules. If the former case is correct, the origin of the very high fractionation would be very interesting. It might reflect hot corino activities in the WCCC source.
It should be noted, however, that the [DC3N]/[HC3N] ratios derived from the higher excitation lines (J = 10–9 and J = 17–16) are not very different from those from the lower excitation lines (J = 5–4 and J = 10–9), even though the upper state energy for the J = 17–16 line of DC3N is as high as 62 K. In this regard, it is interesting to derive the deuterium fractionation ratio by using very high excitation lines (J = 32–31) of DC5N and HC5N whose upper state energies are 64.4 K and 67.5 K, respectively. Since these lines trace a dense and warm region around the protostar, the ratio would selectively reflect the deuterium fractionation there. In the present study, we could not detect the DC5N line (J = 32–31), and we derive an upper limit to the [DC5N]/[HC5N] ratio of 0.067 (3σ). Therefore, we conclude that the deuterium fractionation ratios are not as high as those found in hot corino sources even with the high excitation lines.
4.3. Implications for the WCCC Mechanism
As shown in Sections 4.1 and 4.2, the deuterium fractionation is moderate in L1527, and the very high fractionation ratios found in hot corino sources are not seen except for the uncertain case of HDCO. This is true not only for carbon-chain molecules but also for CH3OH and NH3.
There are two necessary conditions for heavy deuterium fractionation to occur. The first is heavy depletion of CO onto dust grains (e.g., Caselli et al. 1999). Since the CO molecule is the main destroyer of H+3 and H2D+, its removal from the gas phase extends their lifetimes, and ultimately realizes heavy fractionation in various molecules. In addition, a second condition has to be fulfilled for heavy fractionation to occur. Since the deuterium fractionation is mainly transferred from H2D+ to neutral molecules in the gas phase, a cloud has to survive for at least the timescale for the deuterium transfer reactions to cause heavy fractionation. The timescale can roughly be estimated by
where k is a rate constant of the deuterium transfer reaction and n(H2D+) the number density of H2D+. When the fractional abundance of H+3 is assumed to be 10−9, for the H2 density of 105 cm−3 (McCall et al. 1999), the timescale for deuterium fractionation by the deuterium transfer from H2D+ is estimated to be 3 × 10⁵ yr, even if the [H2D+]/[H+3] ratio is as high as 1 due to the depletion of CO (Roberts & Millar 2000). Here, we assume the Langevin rate (1 × 10⁻⁹ cm3 s−1) for k. This timescale is comparable to the free fall time (∼105 yr) for the density of 105 cm−3. Moderate deuterium fractionation in L1527 implies that at least one of the above two conditions has not been well fulfilled in this source.
In principle, another possibility is that the temperature of the core of L1527 could never have got very cold, preventing from the efficient depletion of CO. However, this is not the case, because the gas kinetic temperature averaged over the 195 beam is found to be 13.9 K. Considering that the beam samples the cold envelope as well as the warm inner portion near to the protostar, the temperature of the cold part should be even lower than the above value, which is well below the CO sublimation temperature.
According to Sakai et al. (2008a, 2009), a short timescale for the starless core phase, which is close to that of the free fall, is preferable for WCCC to occur. In this case, the carbon atoms are depleted onto dust grains before they are converted to CO in the gas phase. Then, CH4 is efficiently produced from the carbon atoms through grain surface reactions with H, and its evaporation after the onset of star formation realizes WCCC. In addition, carbon-chain molecules produced in the gas phase can still survive near to the protostar, if the timescale for contraction is short.
This scenario for WCCC is consistent with the moderate deuterium fractionation ratio found in the present study. If fast contraction take place, the degree of depletion is lower than in the slow contraction case. Furthermore, the timescale for contraction may not be long enough for the deuterium transfer reactions. Therefore, deuterium fractionation cannot be high in the gas phase. In this case, the abundance ratio between the deuterium atom and the hydrogen atom, [D]/[H], in the gas phase will not also become high, because the H and D atoms are mainly supplied from dissociative recombination reactions of molecular ions. Hence, deuterium fractionation would be ineffective in the hydrogenation reactions of C and CO on dust grains. As a result, the deuterium fractionation does not proceed well for CH4 on dust grains, resulting in moderate fractionation ratios for carbon-chain molecules in WCCC. As mentioned in Section 3.4, the [DC3N]/[HC3N] ratios obtained from low and high excitation lines are almost the same. According to the above argument, the deuterium fractionation cannot be very high, even if the HC3N molecule is regenerated efficiently near the protostar triggered by evaporation of CH4. Therefore, it seems reasonable that the moderate fractionation ratio is obtained from the high excitation lines tracing the dense inner region near the protostar.
Aikawa et al. (2005) simulated the chemical composition of a gravitationally contracting cloud, where deuterated species are taken into account. They presented two cases for contraction with different initial conditions. One case starts from a core close to the critical Bonner–Ebert, sphere where gravity balances pressure, while the other starts from a core where gravity overwhelms pressure. The latter case can be regarded as that for fast contraction. According to their results, deuterium fractionation ratios are generally lower in the latter case, because of the low degree of CO depletion. Although this simulation only treats the prestellar core phase and is not intended to simulate WCCC, it qualitatively supports the above discussion.
Thus, the fast contraction scenario for WCCC can explain the moderate deuterium fractionation naturally. In fact, the deuterium fractionation ratio in L1527 is comparable to or lower than in "evolved" starless cores, L1544, L63, and L1689B, as mentioned before (Section 4.1). This may support the fast contraction of the L1527 core. The fast contraction would be realistic, because it is now pointed out that the core contraction timescale is different from source to source as well as from region to region (e.g., Tachihara et al. 2000; Jørgensen et al. 2008; Sakai et al. 2009; Hirota et al. 2009).
In order to confirm whether the above picture holds in the densest part near to the protostar, high resolution maps of the deuterated molecules and their corresponding normal species are indispensable. It would also be interesting to observe the deuterated molecules toward the second WCCC source, IRAS15398-3359. Such observational efforts, as well as chemical model simulations including deuterated species, will lead us to a detailed understanding of the mechanism of WCCC and its origin in relation to physical processes of star formation.
5. SUMMARY
We have observed the deuterated species of several carbon-chain molecules, as well as those of c-C3H2 and CH3OH, toward the low-mass star-forming region, L1527, where the WCCC activity has previously been found. The major results are summarized as follows.
- 1.We have successfully detected the spectral lines of l-C3D, C4D, C4HD, DC3N, DC5N, and c-C3HD.
- 2.The deuterium fractionation ratios of the carbon-chain molecules and c-C3H2 are found to be moderate; the [l-C3D]/[l-C3H], [c-C3HD]/[c-C3H2], [C4D]/[C4H], [C4HD]/[C4H2], [DC3N]/[HC3N] (low excitation lines), [DC3N]/[HC3N] (high excitation lines), and [DC5N]/[HC5N] ratios are 4.8+1.4−2.1, 7.1 ± 2.3, 1.8 ± 0.5, 3.0+2.1−1.7, 3.1 ± 1.1, 3.5 ± 1.0, and 2.9+0.7−1.1%, respectively. These ratios are slightly higher than those reported for the starless core, TMC-1.
- 3.In particular, l-C3D and C4HD are detected in space for the first time. These detections are due to the high abundances of carbon-chain molecules and to the moderate degree of deuterium fractionation in L1527.
- 4.The upper limit of the [CH2DOH]/[CH3OH] ratio is found to be as low as 3%. A heavy deuterium fractionation reported for hot corino sources is not found in L1527 not only for carbon-chain molecules but also for CH3OH.
- 5.The moderate deuterium fractionation ratios imply that the CO depletion has not proceeded far for L1527 in comparison to hot corino sources. This finding is consistent with the short timescale of the starless core phase hypothesized for WCCC.
The authors thank Berengere Parise for valuable discussions, and Michael Burton for critical reading of the manuscript. This study is supported by Grant-in-Aids from Ministry of Education, Culture, Sports, Science, and Technologies (21224002, 15071201, and 19-6825).
APPENDIX: ROTATIONAL TRANSITION FREQUENCIES OF L-C3D
The rotational transition frequencies in the Ω = 1/2 state of l-C3D with the hyperfine structure due to the D nucleus are calculated as shown in Table A1. The laboratory microwave spectroscopic data by Yamamoto et al. (1990) and Kim & Yamamoto (2005) were used in the calculation, where the vibronic interaction between the ground state and CCD bending state (ν42Σμ) is taken into account, as described by Yamamoto et al. (1990). The error (1σ), the upper state energy, and the line intensity for each transition are also given in Table A1. Since the hyperfine structures in the Ω = 3/2 state and the ν42Σμ state are not determined well by the laboratory experiment, we only give the frequencies for the Ω = 1/2 state.
Table A1. Rotational Transition Frequencies of l-C3D
| Transition | Frequency (MHz) | Error (MHz) | Eu (cm−1) | S |
|---|---|---|---|---|
| J = 3/2–1/2, F = 5/2–3/2, e | 29446.453 | 0.002 | 0.98 | 2.00 |
| J = 3/2–1/2, F = 3/2–1/2, e | 29446.832 | 0.004 | 0.98 | 0.74 |
| J = 3/2–1/2, F = 3/2–3/2, e | 29447.851 | 0.004 | 0.98 | 0.59 |
| J = 3/2–1/2, F = 1/2–1/2, e | 29447.572 | 0.003 | 0.98 | 0.59 |
| J = 3/2–1/2, F = 5/2–3/2, f | 29394.692 | 0.002 | 0.98 | 2.00 |
| J = 3/2–1/2, F = 3/2–1/2, f | 29396.688 | 0.004 | 0.98 | 0.74 |
| J = 3/2–1/2, F = 3/2–3/2, f | 29392.875 | 0.004 | 0.98 | 0.59 |
| J = 3/2–1/2, F = 1/2–1/2, f | 29395.500 | 0.003 | 0.98 | 0.59 |
| J = 5/2–3/2, F = 7/2–5/2, e | 49060.343 | 0.003 | 2.62 | 3.20 |
| J = 5/2–3/2, F = 5/2–3/2, e | 49060.499 | 0.002 | 2.62 | 2.02 |
| J = 5/2–3/2, F = 3/2–1/2, e | 49060.762 | 0.002 | 2.62 | 1.20 |
| J = 5/2–3/2, F = 7/2–5/2, f | 49026.646 | 0.003 | 2.62 | 3.20 |
| J = 5/2–3/2, F = 5/2–3/2, f | 49027.133 | 0.002 | 2.62 | 2.02 |
| J = 5/2–3/2, F = 3/2–1/2, f | 49027.266 | 0.002 | 2.62 | 1.20 |
| J = 7/2–5/2, F = 9/2–7/2, e | 68682.731 | 0.003 | 4.91 | 4.29 |
| J = 7/2–5/2, F = 7/2–5/2, e | 68682.850 | 0.003 | 4.91 | 3.15 |
| J = 7/2–5/2, F = 5/2–3/2, e | 68683.037 | 0.003 | 4.91 | 2.29 |
| J = 7/2–5/2, F = 9/2–7/2, f | 68675.661 | 0.003 | 4.91 | 4.29 |
| J = 7/2–5/2, F = 7/2–5/2, f | 68675.930 | 0.002 | 4.91 | 3.15 |
| J = 7/2–5/2, F = 5/2–3/2, f | 68676.052 | 0.002 | 4.91 | 2.29 |
| J = 9/2–7/2, F = 11/2–9/2, e | 88318.409 | 0.003 | 7.86 | 5.33 |
| J = 9/2–7/2, F = 9/2–7/2, e | 88318.513 | 0.003 | 7.86 | 4.22 |
| J = 9/2–7/2, F = 7/2–5/2, e | 88318.662 | 0.003 | 7.86 | 3.33 |
| J = 9/2–7/2, F = 11/2–9/2, f | 88345.688 | 0.003 | 7.85 | 5.33 |
| J = 9/2–7/2, F = 9/2–7/2, f | 88345.883 | 0.003 | 7.85 | 4.22 |
| J = 9/2–7/2, F = 7/2–5/2, f | 88345.997 | 0.003 | 7.85 | 3.33 |
| J = 11/2–9/2, F = 13/2–11/2, e | 107971.438 | 0.004 | 11.46 | 6.36 |
| J = 11/2–9/2, F = 11/2–9/2, e | 107971.531 | 0.003 | 11.46 | 5.27 |
| J = 11/2–9/2, F = 9/2–7/2, e | 107971.658 | 0.004 | 11.46 | 4.36 |
| J = 11/2–9/2, F = 13/2–11/2, f | 108039.864 | 0.004 | 11.46 | 6.36 |
| J = 11/2–9/2, F = 11/2–9/2, f | 108040.024 | 0.003 | 11.46 | 5.27 |
| J = 11/2–9/2, F = 9/2–7/2, f | 108040.132 | 0.003 | 11.46 | 4.36 |
| J = 13/2–11/2, F = 15/2–13/2, e | 127645.093 | 0.004 | 15.72 | 7.38 |
| J = 13/2–11/2, F = 13/2–11/2, e | 127645.177 | 0.004 | 15.72 | 6.31 |
| J = 13/2–11/2, F = 11/2–9/2, e | 127645.288 | 0.004 | 15.72 | 5.38 |
| J = 13/2–11/2, F = 15/2–13/2, f | 127760.475 | 0.004 | 15.72 | 7.38 |
| J = 13/2–11/2, F = 13/2–11/2, f | 127760.612 | 0.004 | 15.72 | 6.31 |
| J = 13/2–11/2, F = 11/2–9/2, f | 127760.716 | 0.004 | 15.72 | 5.38 |
| J = 15/2–13/2, F = 17/2–15/2, e | 147341.825 | 0.005 | 20.63 | 8.40 |
| J = 15/2–13/2, F = 15/2–13/2, e | 147341.901 | 0.004 | 20.63 | 7.33 |
| J = 15/2–13/2, F = 13/2–11/2, e | 147341.999 | 0.005 | 20.63 | 6.40 |
| J = 15/2–13/2, F = 17/2–15/2, f | 147508.963 | 0.005 | 20.64 | 8.40 |
| J = 15/2–13/2, F = 15/2–13/2, f | 147509.086 | 0.004 | 20.64 | 7.33 |
| J = 15/2–13/2, F = 13/2–11/2, f | 147509.185 | 0.004 | 20.64 | 6.40 |
Download table as: ASCIITypeset image
Footnotes
- 4
The National Radio Astronomy Observatory is a facility of the National Science Foundation operated under cooperative agreement by Associated Universities, Inc.