


ABSTRACT
We report the nuclear spin temperatures (Tspin) of H2O and CH4 in comet C/2004 Q2 (Machholz) based on high-dispersion spectroscopic observations of the comet in the L band taken by the Keck II telescope with the NIRSPEC spectrograph on 2005 January 30.2 UT. The ortho-to-para abundance ratio of H2O was determined to be 3.13+0.56−0.42, which is consistent with the high-temperature limit of H2O (3.0). The lower limit of Tspin is 27 K (95% confidence limit (c.l.)) for H2O. In the case of CH4, the abundance ratios of A:E:F are consistent with 5:2:9 (high-temperature limit) and the lower limit of Tspin is 36 K (95%-c.l.). We also report the result of our sensitive search for mono-deuterated methane (CH3D) in C/2004 Q2 (Machholz). A candidate for the emission line from the CH3D ν4 RR(3, 3) transition was found in our spectra. Although the D/H ratio in methane could be determined as (3.8 ± 1.3) × 10−3 based on a tentative detection of CH3D, this emission line also might be assigned to other molecules, e.g., CH3OH. Therefore, we conclude that the D/H ratio in methane is lower than 6.4 × 10⁻³ (95%-c.l.) in the comet. Both the lower limits of Tspin of H2O and CH4 and the upper limit of the D/H ratio in methane indicate the formation of molecules frozen in C/2004 Q2 (Machholz) at relatively higher temperatures compared with the typical Oort Cloud comets.
Export citation and abstract BibTeX RIS
1. INTRODUCTION
Since comets are the most pristine icy bodies in the solar system, the chemical composition, physical structure and various properties of cometary nuclei are considered to be precious clues to the formation of the solar system. In particular, the chemical compositions of cometary ices are interesting from the viewpoint of the chemical evolution of materials from the presolar molecular cloud to the solar nebula. There are many studies on the chemical composition of volatiles in comets based on observations of coma in the UV, optical, near-infrared and radio domains (nice reviews have been given by Bockelée-Morvan et al. 2005 and Feldman et al. 2005). In addition to mixing ratios of the volatiles with respect to H2O (the most abundant molecule in cometary ices), deuterium-to-hydrogen abundance ratios (D/H ratios) and abundance ratios of nuclear spin modifications in a molecular species that have identical H atoms (such as H2O) have been used to infer physical temperatures in the solar nebula or in the presolar molecular cloud (Bockelée-Morvan et al. 2005). The D/H ratios in cometary molecules depend on physical temperatures where the molecules formed. Higher D/H ratios could be achieved by chemical reactions at lower temperatures (Millar 2003). The abundance ratios of nuclear spin modifications are also considered as a probe of temperatures where molecules formed or condensed. In contrast with D/H ratios, however, the real meaning of the abundance ratio of nuclear spin modifications in a molecular species is still under debate (Crovisier 2007).
Here, we report the abundance ratios of nuclear spin modifications in H2O and CH4 in comet C/2004 Q2 (Machholz) based on high-dispersion spectroscopic observations of the comet in the L band. The result of a sensitive search for mono-deuterated methane (CH3D) in the comet is also reported. We discuss the formation conditions of icy materials in the comet based on our observations. We concentrate on nuclear spin modifications of H2O and CH4 in addition to the D/H ratio in methane in this paper. The mixing ratios of organic molecules in the comet based on the same observations have already been reported (Kobayashi & Kawakita 2008).
2. DEUTERIUM-TO-HYDROGEN RATIOS IN MOLECULAR SPECIES
Although the proto-solar value of the atomic abundance ratio between deuterium and hydrogen was estimated to be (2.1 ± 0.5) × 10−5 (Owen & Encrenaz 2003), the D/H ratios in water and hydrogen cyanide measured in comets exhibit much higher D/H ratios than the protosolar value (Bockelée-Morvan et al. 2005). The D/H ratio in water was about 3 × 10⁻⁴ in three Oort Cloud comets: (3.08+0.38−0.53) × 10−4 (Balsiger et al. 1995) and (3.06 ± 0.34) × 10−4 (Eberhardt et al. 1995) for comet 1P/Halley, (2.9 ± 1.0) × 10−4 for comet C/1996 B2 (Hyakutake; Bockelée-Morvan et al. 1998), and (3.3 ± 0.8) × 10−4 for comet C/1995 O1 (Hale-Bopp; Meier et al. 1998a). The upper limit of the water D/H ratio was also reported in comet 153P/Ikeya-Zhang to be D/H <(2.8 ± 0.3) × 10−4 (Biver et al. 2006). This upper limit is consistent with the D/H ratios of the three Oort Cloud comets within the error bars.
Moreover, the D/H ratio in hydrogen cyanide was also measured in comet Hale-Bopp. It was about (2.3 ± 0.4) × 10−3 (Meier et al. 1998b). The D/H ratio in hydrogen cyanide is almost 10 times higher than in water. These results are indicative of molecular formation at low temperatures (Meier & Owen 1999). Recent measurements of the D/H ratio in cometary grains sampled by the STARDUST mission also showed deuterium fractionation in cometary materials (McKeegan et al. 2006; Sandford et al. 2006).
Such fractionation of D atoms in cometary molecules could be explained by the formation reactions of the molecules at low temperatures in a molecular cloud or in the solar nebula (Millar et al. 1989; Meier & Owen 1999; Bergin et al. 1999; Aikawa & Herbst 1999; Mousis et al. 2000; Horner et al. 2007; Willacy 2007). In general, different molecules have different D/H ratios since the D/H ratio depends on the formation reactions of the molecule and physical conditions such as temperature at molecular formation. Thus, the D/H ratio is a precious clue to temperature at molecular formation in the early stage of the solar system. Based on the measurements of D/H ratios of water and hydrogen cyanide in comet Hale-Bopp (Meier et al. 1998a, 1998b), Meier & Owen (1999) discussed the formation temperature of the molecules. They concluded that the molecules formed at 30 K or higher in the case of Hale-Bopp.
We note that the upper limit of the water D/H ratio in comet C/2004 Q2 (Machholz) was also reported to be D/H < 2.2 × 10⁻⁴ (Biver et al. 2005). This upper limit is significantly lower than the typical D/H ratios in cometary water. Such a lower D/H ratio corresponds to higher temperatures for deuterium fractionation than the three Oort Cloud comets (1P/Halley, C/Hyakutake, and C/Hale-Bopp).
In contrast with water and hydrogen cyanide, the D/H ratio in methane has never been determined precisely since mono-deuterated methane (CH3D) is difficult to detect in comets. Previous attempts showed upper limits only (Kawakita et al. 2003, 2005). If the solar system originated from a cold dark molecular cloud at 10 K, the D/H ratio in methane is expected to be about 0.025 in cometary ices (Aikawa & Herbst 1999; Willacy 2007). This value is much higher than the D/H ratios in water and hydrogen cyanide. On the other hand, Kawakita et al. (2005) reported the upper limit of the D/H ratio in methane in comet C/2001 Q4 (NEAT) to be 0.01 (95% confidence limit (c.l.)). According to Meier & Owen (1999) and Meier et al. (1998b), this upper limit is consistent with the deuterium fractionation in methane at a temperature of about 20 K or higher in a dense molecular cloud (Kawakita et al. 2005). Thus, the D/H ratios in cometary molecules (water, hydrogen cyanide, and methane) indicate warm environments (≳30 K) for molecular formation.
3. NUCLEAR SPIN CONVERSION MECHANISMS IN THE CASE OF COMETS
Molecules that have identical nuclei having nonzero nuclear spin could exist at energy levels belonging to "nuclear spin modifications" or "nuclear spin isomers" (Hougen & Oka 2005). In the case of cometary molecules, for example, H2O could be classified into "ortho" and "para" nuclear spin modifications according to their total nuclear spin quantum number I: ortho- and para-H2O for I = 1 and 0, respectively. In the cases of NH3, CH4, and other molecules that have identical H atoms, these can also be classified into nuclear spin modifications; e.g., NH3 has ortho and para (or, A and E species) for I = 3/2 and 1/2, and CH4 has A, F, and E species for I = 2, 1 and 0.
Since the nuclear spin conversion is a strongly forbidden process (but not strictly forbidden, see below) in a nondestructive inelastic molecular collision or in a radiative transition, an abundance ratio between different nuclear spin modifications has been sometimes used to infer temperatures that the molecular species experienced in the past. "Nuclear spin temperature" (Tspin) is defined as the rotational temperature at which a given abundance ratio of nuclear spin modifications could be reproduced in thermal equilibrium (Bockelée-Morvan et al. 2005 and references therein). To date, nuclear spin temperatures of H2O have been measured in more than 10 comets and that of other species (NH3, CH4, CH3OH) in several comets (Crovisier 2007; Woodward et al. 2007; Pardanaud et al. 2007; Dello Russo et al. 2008). The observed nuclear spin temperatures in comets clustered around 30 K.
However, we do not know how, when, and where the ortho-to-para abundance ratio (OPR) and the abundance ratio of nuclear spin modifications last equilibrated in the case of cometary molecules. Although Crovisier (2007) discussed possible explanations for the observed OPRs (and abundance ratios of nuclear spin modifications) in cometary molecules, it seems that any possible explanation can be ruled out based on our current knowledge. We need to clarify nuclear spin conversion mechanism(s) for cometary molecules in gas and solid phases.
Experiments and theories about nuclear spin conversion under various conditions have been reported by many researchers (e.g., Limbach et al. 2006; Sun et al. 2005; Miani & Tennyson 2004; Critchley et al. 2001; Miki & Momose 2000; Chapovsky & Hermans 1999; Bunker & Jensen 1998, pages 407, 473, and 500). Nuclear spin conversion is a strongly forbidden process as mentioned above. In generally, nuclear spin conversions are very slow for an isolated molecule (as in the well known case of H2) unless there are one or more very close energy matches between rotational energy levels belonging to different nuclear spin states (Jensen et al. 2003). However, the existence of paramagnetic impurities (e.g., O2 molecules), external magnetic (or electric) field, or some kind of solid surface, could accelerate nuclear spin conversion since they could induce very close energy matches of rotational levels between different nuclear spin modifications (Hougen & Oka 2005; Limbach et al. 2006).
The selective adsorption of molecular species onto a surface may be responsible for the fractionation of nuclear spin modification, as proposed by Tikhonov & Volkov (2002) based on their experiments using H2O. However, Veber et al. (2006) reported that they could not reproduce the experimental results reported by Tikhonov & Volkov (2002). There is no significant difference in adsorption characteristics between ortho- and para-H2O (Veber et al. 2006).
Finally, chemical reactions that replace the identical nuclei of the molecule could also contribute to the nuclear spin conversion. Chemical reactions in a gas phase (e.g., proton-exchange reactions with H3O+ in cometary coma) or reactions on a solid surface could change the nuclear spin modifications. For another example of chemical nuclear spin conversion, UV photons (or energetic particles like cosmic rays) irradiated to water ice can break O-H bond of H2O (into OH + H) and then H2O could be reproduced from OH and a free H atom in solid or on the grain surface. This mechanism might be responsible for cometary ices (not only for H2O but also NH3, CH4, and so on.) in the molecular cloud or in the solar nebula (Kawakita et al. 2004).
4. OBSERVATIONS AND DATA REDUCTION
High-dispersion spectroscopic observations of comet C/2004 Q2 (Machholz) (hereafter, C/Machholz) in the near-infrared were carried out by the Keck II telescope with the NIRSPEC instrument (McLean et al. 1998) on 2005 January 30.22 UT. The NIRSPEC has a cross-dispersed echelle spectroscopic mode that can realize high spectroscopic resolving powers. We used a slit of 0.43 × 24 arcseconds corresponding to λ/Δλ = 25000. C/Machholz is one of the Oort Cloud comets and was considered as a dynamically new comet. The comet was as bright as about 4th magnitude (V band) in late January 2005. The heliocentric and geocentric distances of the comet during the observations were 1.21 AU and 0.480 AU, respectively. At that time, the geocentric velocity of the comet was +15.6 km s−1, which corresponded to moderate separations in wavelength between cometary emission lines and telluric absorption lines caused by the same molecular species (e.g., in the case of CH4). We put the comet on the slit at different positions named "A" and "B" with a separation of 12 arcseconds. The sequences "ABBA" were taken to subtract the sky background emission by calculating (A − B − B + A). In total, nine ABBA sequences were acquired. The integration time for each position was one minute and thus the total integration time on the source was 36 minutes.
Data reduction was performed by using the astronomical data reduction software IRAF (Image Reduction and Analysis Facility, distributed by the NOAO, USA). We used the ECHELLE and TWODSPEC packages. First, (A − B − B + A) was calculated for each ABBA sequence, and then the results were flat-fielded and combined into a single image that contains six echelle orders at once. Each order was extracted and rectified (and wavelength-calibrated) by referring sky background emission lines. Figure 1 shows the rectified two-dimensional spectra investigated here. After that, cometary signals were extracted at the center of the nucleus by summing up within nine rows along the slit (resultant sampling area is 0.43 by 1.8 arcsec at the sky). Finally, the one-dimensional spectra were flux-calibrated based on spectra of the photometric standard star (HR937, spectral type G0V).
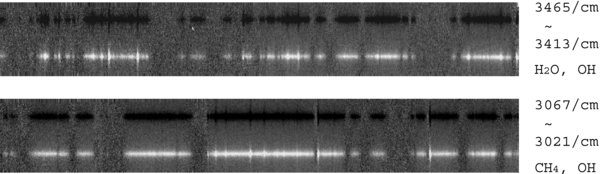
Figure 1. Two-dimensional spectra of C/Machholz for H2O (upper panel) and CH4 (lower panel). As a result of calculation of (A − B − B + A), the signal in the A-position is positive (bright) while the signal in B-position is negative (dark). Many cometary emission lines extended along the slit are recognized.
Download figure:
Standard image High-resolution imageBoth molecular emission lines and reflected sunlight by cometary grains were included in the calibrated one-dimensional spectra. In order to extract only molecular emission lines, we subtracted the reflected sunlight as follows. First, we modeled telluric atmosphere at the observations and calculated a transmittance curve of the atmosphere by using the LBLRTM synthesis code (Clough et al. 2005). Then, we convolved the synthesized transmittance curve with a Gaussian function where the spectral resolution of transmittance curve corresponds to the observed spectra. The reflected sunlight was modeled by a smooth polynomial function multiplied by the synthesized transmittance curve. We fitted the modeled spectrum of the reflected sunlight to the observed spectra. Thus, we subtracted the reflected sunlight from cometary spectra. The calibrated spectra for H2O and CH4 are shown in Figure 2. Prompt OH emission lines and some unknown lines listed in Dello Russo et al. (2007) are also recognized in these spectra. Measurements of line flux used for the model fitting (in the next section) are listed in Tables 1 and 2.
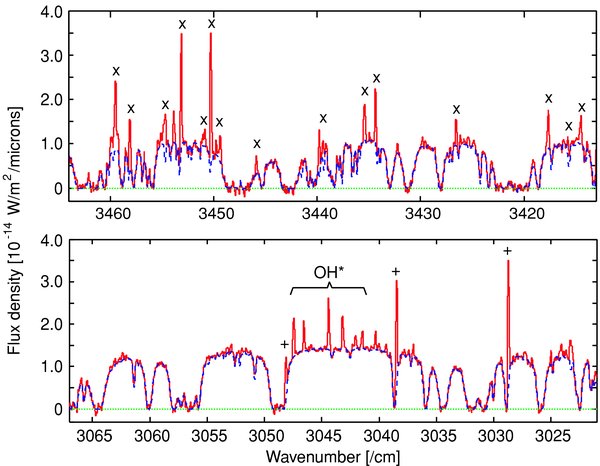
Figure 2. One-dimensional spectra centered on the nucleus (within nine rows) of H2O (upper panel) and CH4 (lower panel). Solid lines show cometary spectra and dashed lines show the continuum component convolved with telluric transmittance curve. Emission lines of H2O (x) and CH4 (+) are marked in the figure.
Download figure:
Standard image High-resolution imageTable 1. Measurements of H2O Lines
| Wavenumber (rest) (cm−1) | Line Flux (W m−2) | g-factora (W molecule−1) | Assignment |
|---|---|---|---|
| 3461.17 | (7.26 ± 2.21) × 10−20 | 1.23 × 10⁻²⁸ | (201)211–(200)110 |
| 3458.57 | (1.17 ± 0.15) × 10−19 | 1.12 × 10⁻²⁸ | (200)423–(100)432 |
| 3458.13 | (6.97 ± 0.19) × 10−19 | 1.45 × 10⁻²⁷ | (101)000–(001)111 |
| 3455.43 | (1.41 ± 0.14) × 10−19 | 2.76 × 10⁻²⁸ | (101)303–(001)312 |
| 3455.13 | (1.15 ± 0.12) × 10−19 | 3.40 × 10⁻²⁸ | (101)312–(001)321 |
| 3453.17 | (1.53 ± 0.01) × 10−18 | 2.88 × 10⁻²⁷ | (101)202–(100)321 |
| (200)110–(100)221 | |||
| 3451.10 | (1.18 ± 0.12) × 10−19 | 3.12 × 10⁻²⁸ | (200)524–(100)533 |
| (101)413–(001)422 | |||
| 3450.88 | (1.96 ± 0.12) × 10−19 | 4.62 × 10⁻²⁸ | (200)515–(100)524 |
| (201)212–(200)111 | |||
| (101)313–(100)330 | |||
| 3450.30 | (1.77 ± 0.02) × 10−18 | 3.22 × 10⁻²⁷ | (211)322–(111)211 |
| (111)101–(110)220 | |||
| (200)110–(001)111 | |||
| 3449.79 | (1.77 ± 0.14) × 10−19 | 3.69 × 10⁻²⁸ | (101)221–(001)312 |
| (110)321–(010)432 | |||
| (101)441–(100)542 | |||
| 3449.38 | (3.41 ± 0.17) × 10−19 | 7.20 × 10⁻²⁸ | (300)212–(200)101 |
| (011)514–(010)633 | |||
| (101)524–(100)625 | |||
| 3445.90 | (1.71 ± 0.18) × 10−19 | 4.84 × 10⁻²⁸ | (200)220–(001)221 |
| 3441.52 | (1.71 ± 0.20) × 10−19 | 2.66 × 10⁻²⁸ | (200)606–(100)615 |
| (200)414–(100)505 | |||
| 3440.71 | (7.76 ± 1.92) × 10−20 | 8.13 × 10⁻²⁹ | (200)441–(100)440 |
| 3439.82 | (6.13 ± 0.21) × 10−19 | 8.98 × 10⁻²⁸ | (200)432–(100)514 |
| (200)111–(001)110 | |||
| 3439.43 | (3.22 ± 0.18) × 10−19 | 5.47 × 10⁻²⁸ | (201)312–(200)313 |
| (101)101–(001)212 | |||
| 3439.17 | (1.15 ± 0.15) × 10−19 | 1.35 × 10⁻²⁸ | (200)533–(100)624 |
| (200)541–(001)542 | |||
| (211)211–(210)110 | |||
| (201)312–(200)313 | |||
| 3438.14 | (1.24 ± 0.17) × 10−19 | 1.70 × 10⁻²⁸ | (210)414–(110)423 |
| (200)404–(100)515 | |||
| 3434.96 | (1.06 ± 0.10) × 10−19 | 1.95 × 10⁻²⁸ | (201)101–(200)000 |
| (201)523–(200)524 | |||
| 3434.37 | (8.18 ± 0.12) × 10−19 | 1.64 × 10⁻²⁷ | (211)202–(210)101 |
| (200)211–(100)322 | |||
| (120)221–(020)330 | |||
| (101)414–(100)431 | |||
| (101)212–(001)303 | |||
| 3429.84 | (1.07 ± 0.12) × 10−19 | 2.34 × 10⁻²⁸ | (111)211–(011)220 |
| (121)505–(120)606 | |||
| 3429.57 | (6.00 ± 1.09) × 10−20 | 2.09 × 10⁻²⁸ | (300)321–(200)312 |
| (101)313–(001)322 | |||
| 3428.29 | (1.36 ± 0.23) × 10−19 | 2.19 × 10⁻²⁸ | (220)212–(001)211 |
| 3426.57 | (3.37 ± 0.12) × 10−19 | 5.22 × 10⁻²⁸ | (011)414–(010)533 |
| (101)615–(100)716 | |||
| (111)413–(011)422 | |||
| 3425.41 | (1.08 ± 0.11) × 10−19 | 2.44 × 10⁻²⁸ | (201)211–(200)212 |
| 3423.20 | (1.25 ± 0.21) × 10−19 | 1.15 × 10⁻²⁸ | (200)423–(001)422 |
| 3419.13 | (1.11 ± 0.22) × 10−19 | 1.83 × 10⁻²⁸ | (200)505–(100)616 |
| (101)551–(100)652 | |||
| 3417.68 | (6.25 ± 0.14) × 10−19 | 1.21 × 10⁻²⁷ | (200)707–(100)716 |
| (200)312–(100)423 | |||
| (101)322–(001)413 | |||
| 3416.20 | (5.45 ± 1.03) × 10−20 | 4.98 × 10⁻²⁹ | (300)322–(101)221 |
| (101)414–(001)423 |
Note. aCalculated at Trot = 85 K and OPR = 3.13. Telluric transmittances are included.
Download table as: ASCIITypeset image
Table 2. Measurements of CH4 Lines
| Wavenumber (rest) (cm−1) | Line Flux (W m−2) | g-factora (W molecule−1) | Assignment |
|---|---|---|---|
| 3028.75 | (1.96 ± 0.03) × 10−18 | 2.32 × 10⁻²⁵ | ν3 R0 |
| 3038.50 | (1.71 ± 0.03) × 10−18 | 2.04 × 10⁻²⁵ | ν3 R1 |
| 3048.16 | (7.05 ± 0.34) × 10−19 | 8.40 × 10⁻²⁶ | ν3 R2 |
Note. aCalculated at Trot = 90 K and A:E:F = 5:2:9. Telluric transmittances are included in.
Download table as: ASCIITypeset image
5. RESULTS
5.1. Water Hot-Bands: Nuclear Spin Temperature of H2O
High-S/N ratios of H2O emission lines enabled us to determine the abundance ratio between ortho- and para-H2O precisely. We adopted the fluorescence excitation model to the water hot-bands in the 2.9 μm region. The basic ideas were described in detail by Dello Russo et al. (2004, 2005). In the model, H2O molecules are excited from the ground state to the upper vibrational states by the solar radiation field, and the population distribution of the vibrational ground state is assumed to follow a Boltzmann distribution at a given rotational temperature. The population distribution in the ground vibrational state is assumed to be maintained by frequent intermolecular collisions in the inner coma. Wavelengths and Einstein's A coefficients of the transitions related to the water hot-bands were taken from Barber et al. (2006). The high-dispersion solar spectrum in the near-infrared was calculated by Kurucz's spectrum synthetic code (Kurucz 1994; Fontenla et al. 1999).
There are two free parameters for the fluorescence excitation model, the rotational temperature of H2O in the vibrational ground state (Trot) and the abundance ratio between ortho- and para-H2O (OPR). We have fitted the observed spectrum near 2.9 μm with the modeled spectrum by minimizing the reduced-χ2 to determine the best Trot and OPR. Errors in the measured line flux and in the telluric transmittance are considered in the model fitting.
Figure 3 shows the modeled spectrum of H2O compared with the observed spectrum. There is not a perfect match between the observed and modeled spectrum of water for some lines. Uncertainties in Einstein's A coefficients for water hot-band transitions used in the model calculation may cause these errors (Dello Russo et al. 2004, 2005). Moreover, one of the emission lines labeled as "SH" in Barber et al. (2007) was also found in our spectrum. These "SH" lines are caused by the transitions from the "high-v but low-J" levels having energies in the range from ∼10,000 to ∼15,000 cm−1 (Barber et al. 2007). Since the excitation mechanism for these SH lines is not well understood, we did not use "SH" lines for the model fitting. There were some unidentified lines in our spectrum and some of these may be "SH" lines.
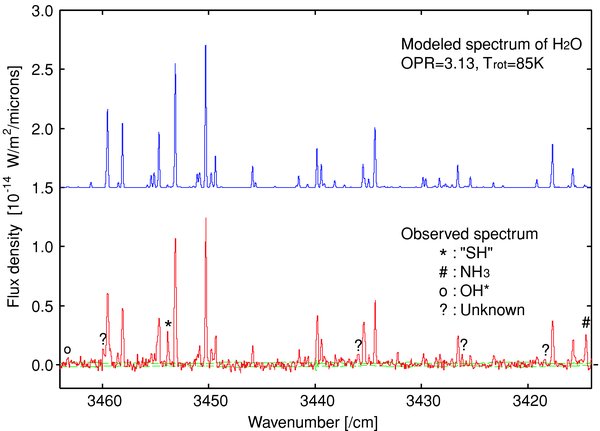
Figure 3. Comparison between modeled (upper) and observed (lower) spectra of H2O. For the observed spectrum, the dust component has already been subtracted. Error-levels for the observed spectrum shown as dashed-lines are ±1σ levels that were estimated based on stochastic noise. The line marked by "*" is the "SH" line identified by Barber et al. (2007; see the text) and some of the unidentified lines (marked by "?") may also be "SH" lines.
Download figure:
Standard image High-resolution imageThe best-fit values of Trot and OPR are 85 ± 5 K and 3.13+0.56−0.42, respectively. Errors are 1σ error-levels (corresponding to the reduced-χ2⩽ reduced-χ2min + 1). The obtained OPR is interpreted as the nuclear spin temperature (Mumma et al. 1987). The best OPR value could give a lower limit of the nuclear spin temperature, Tspin ⩾ 34 K. Note that the 95% confidence limit is 27 K, which is estimated based on the reduced-χ2⩽ reduced-χ2min + 4.
The OPR of water in C/Machholz had been also reported based on the near-infrared water hot-band emission spectrum, which was also taken by Keck II/NIRSPEC by Bonev et al. (2007). They reported OPR = 2.86 ± 0.17 (Tspin ⩾ 34 K) and their OPR is consistent with our measurements.
5.2. Nuclear Spin Temperature of CH4
In our spectra of C/Machholz, three emission lines of CH4 were detected, i.e., R0, R1, and R2 of the ν3 vibrational band. Methane has three nuclear spin modifications of A, E, and F. The emission of R0 belongs to A, and the emission of R1 belongs to F while the emission of R2 is a composite of E and F.
We reproduced the emission spectrum of CH4 using the fluorescence excitation model by the solar radiation. The vibrational ground state of CH4 was assumed to be thermalized (Gibb et al. 2003; Kawakita et al. 2005). In this case, the population distribution among the rotational levels in the vibrational ground state can be specified by both the rotational temperature (Trot) and the nuclear spin temperature (Tspin). These two parameters could be determined from our observations. The best-fit values of Trot and Tspin were determined based on the minimizing reduced-χ2 method as done for H2O. Errors in the measured line flux and in the telluric transmittance are considered in the model fitting. The best-fit rotational temperature is Trot = 90+10−8 K (±1σ error-levels) and the lower limit of nuclear spin temperature is derived as Tspin ⩾ 40 K corresponding to the ±1σ error-levels (the 95% confidence limit is Tspin ⩾ 36 K). Figure 4 shows the observed spectrum compared with the modeled spectrum of CH4 where Trot = 90 K and A:E:F ratios are 5:2:9 (equilibrium ratios in high-temperature limit).
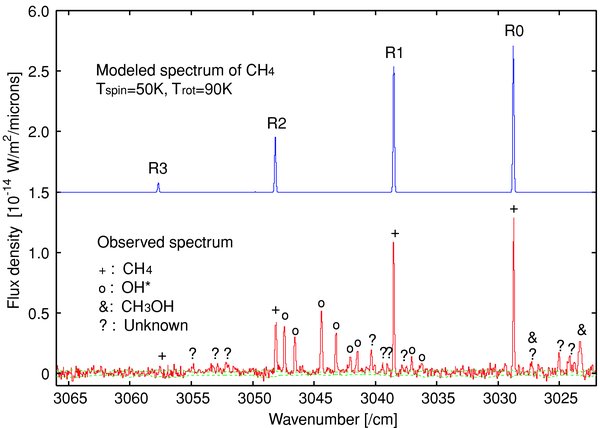
Figure 4. Same as in Figure 3 but for CH4. Prompt OH emission lines are also prominent.
Download figure:
Standard image High-resolution imageThe rotational temperature of CH4 is consistent with Trot of H2O listed in the previous subsection. The consistency in Trot between H2O and CH4 supports the validity of the assumption that molecules were thermalized well by intermolecular collisions in the inner coma. Regarding the nuclear spin temperature, the temperature range inferred from CH4 (⩾ 36 K, 95% c.l.) is consistent with that of H2O (⩾ 27 K, 95% c.l.). Consistency between the nuclear spin temperatures of H2O and CH4 was also found in comet C/2001 Q4 (NEAT) in which the nuclear spin temperatures of H2O, NH3 and CH4 were consistent with one another (about 32 K; Kawakita et al. 2006).
5.3. A Sensitive Search for CH3D
The strongest vibrational emission band of CH3D in comet is the ν4 vibrational band around 3000 cm−1, which is close to the ν3 vibrational band of CH4 (Kawakita & Watanabe 2003). Both CH4 and CH3D could be recorded simultaneously on the same echelle order by the NIRSPEC and it is easy to compare strengths of emission lines between CH4 and CH3D. We searched for emission lines of CH3D ν4 band in our spectrum of C/Machholz. Figure 5 shows a tentative detection of the RR(3, 3) emission line of CH3D ν4 band at 3053.84 cm−1 (rest). Although we had searched for other emission lines of CH3D in our spectra, we could not find any lines except the line shown in Figure 5. A modeled spectrum of CH3D is also plotted in Figure 5. Here we employed the fluorescence excitation model of CH3D (Kawakita & Watanabe 2003). The ground vibrational levels are assumed to be thermalized by intermolecular collisions in the inner coma. The rotational temperature of CH3D is assumed to be 90 K that is the same as Trot found in CH4. The modeled spectrum of CH3D (scaled to fit to the observation at 3053.84 cm−1) demonstrates that the emission lines of CH3D except RR(3, 3) were too weak to be detected, namely, the other emission lines are below 1σ error levels in Figure 5. If the emission line at 3053.84 cm−1 is assumed to be from CH3D, the D/H ratio in methane could be obtained. The measured line flux and the corresponding g-factor is listed in Table 3. We also assumed that the photodissociation lifetime of CH3D is similar to that of CH4 (this means that the lifetime of CH3D is much longer than the traveling time along the slit from the nucleus as in the case of CH4). Thus, the D/H ratio in methane was determined to be (3.8 ± 1.3) × 10−3 (±1σ error-levels).
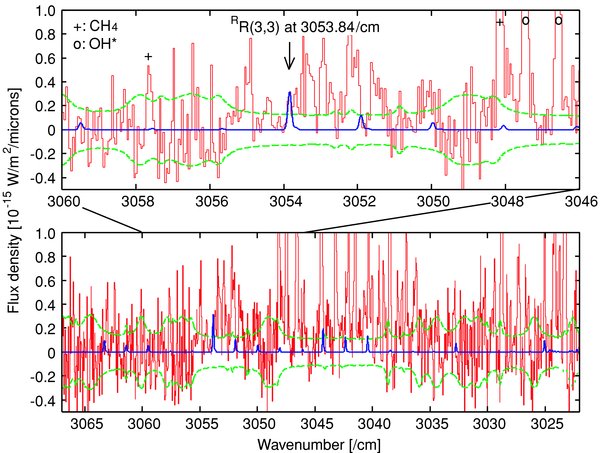
Figure 5. Tentative detection of cometary CH3D (the RR(3, 3) line in the ν4 band at 3053.84 cm−1). Dashed lines are ±1σ error levels. The observed spectrum is shown by a thin solid line and the modeled spectrum of CH3D is shown by a thick solid line. The ±1σ error levels are shown by dashed lines.
Download figure:
Standard image High-resolution imageTable 3. Measurements of CH3D Lines
| Wavenumber (rest) (cm−1) | Line Flux (W m−2) | g-factora (W molecule−1) | Assignment |
|---|---|---|---|
| 3032.740 | <1.68 × 10⁻²⁰ | 6.52 × 10⁻²⁶ | ν4 RR(1, 0) |
| 3049.967 | <1.36 × 10⁻²⁰ | 5.41 × 10⁻²⁶ | ν4 RR(3, 1) |
| 3051.908 | <9.98 × 10⁻²¹ | 1.10 × 10⁻²⁵ | ν4 RR(3, 2) |
| 3053.840 | (3.71 ± 1.28) × 10−20 | 2.92 × 10⁻²⁵ | ν4 RR(3, 3) |
| 3059.488 | <1.42 × 10⁻²⁰ | 5.24 × 10⁻²⁶ | ν4 RR(4, 2) |
| 3061.414 | <1.70 × 10⁻²⁰ | 5.35 × 10⁻²⁶ | ν4 RR(4, 3) |
| 3063.329 | <1.45 × 10⁻²⁰ | 8.16 × 10⁻²⁶ | ν4 RR(4, 4) |
Note. aCalculated at Trot = 90 K and OPR is unity. Telluric transmittances are included.
Download table as: ASCIITypeset image
However, we note that the emission line at 3053.84 cm−1 might be caused from other molecules, e.g., CH3OH. Since there are many ro-vibrational transitions of CH3OH around 3000 cm−1, we must be careful to identify a very weak emission line around 3000 cm−1. There is no detailed report about line assignments for CH3OH near 3000 cm−1 (the ro-vibrational spectrum of CH3OH is very complicated). Multiple detections of CH3D emission lines are necessary to confirm the existence of CH3D in cometary coma. Therefore, we may have to consider our result as an upper limit. The upper limit of the D/H ratio in methane is estimated to be 6.4 × 10⁻³ (95% c.l.).1
6. DISCUSSION
6.1. Implication from D/H Ratios in C/Machholz
The D/H ratio of a molecular species is a powerful diagnostic tool to reveal molecular formation conditions. In the case of comet Hale-Bopp, Meier et al. (1998b) demonstrated that the D/H ratios of water and hydrogen cyanide were consistent with the deuterium fractionation in a dense molecular cloud at about 30 K. Although this temperature was based on the ion–molecule chemistry in the gas phase (Millar et al. 1989), the gas-grain chemistry trends to produce similar D/H ratios under higher temperature conditions. Thus, Meier et al. (1998b) concluded that the formation temperature of the cometary molecules was higher than 30 ± 10 K. Note that the observed D/H ratios in comet Hale-Bopp could not be explained even by the recent physicochemical model of the solar nebula considering gas-grain chemistry (Willacy 2007). The gas phase chemistry might play an important role in forming simple molecules such as H2O and HCN, while more complex molecules such as CH3OH could not be produced efficiently by the gas phase chemistry only.
In the case of C/Machholz, we could estimate the formation temperature of methane based on a similar discussion as described above (Meier & Owen 1999; Meier et al. 1998b). Based on the ion–molecule chemistry in a dense molecular cloud (Millar et al. 1989), the upper limit of the D/H ratio in methane in C/Machholz could be interpreted as the temperatures higher than about 25 K. Since the gas-grain chemistry tends to produce similar D/H ratios under higher temperature conditions than ion–molecule chemistry, the lower limit of the formation temperature is considered to be about 25 K.
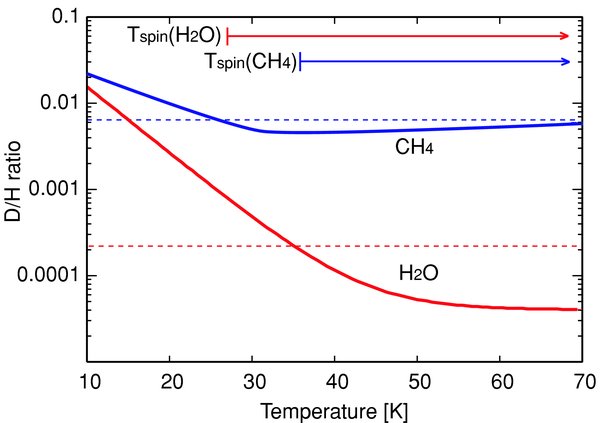
Furthermore, the D/H ratio of H2O in C/Machholz was also reported by Biver et al. (2005) based on their radio observations. They reported the upper limit for water: D/H <2.2 × 10⁻⁴. This upper limit is significantly lower than the typical D/H ratio in water (about 3 × 10⁻⁴) previously observed in the three Oort Cloud comets (1P/Halley, C/Hyakutake, and C/Hale-Bopp). As discussed above, temperatures determined based on the deuterium fractionation by ion–molecule chemistry in a dense molecular cloud (Millar et al. 1989) could be interpreted as the lower limit of the formation temperature of the molecules. Thus, the upper limit of the D/H ratio in water in C/Machholz corresponds to the lower limit of about 35 K for the temperature at molecular formation while the lower limit of about 25 K was inferred from our observations of methane in C/Machholz (Figure 6). The temperature ranges derived from the D/H ratios in both water and methane are consistent with each other.
Figure 6. D/H ratios and corresponding temperatures compared with nuclear spin temperatures of H2O and CH4 in C/Machholz. Lower limits of the nuclear spin temperatures of both H2O and CH4 in C/Machholz are shown by arrows. The dashed lines are the upper limit of the D/H ratios in methane and water in C/Machholz (6.4 × 10⁻³ and 2.2 × 10⁻⁴, respectively). Thick solid lines are calculated D/H ratios in water and methane referred from Table 2 in Millar et al. (1989). Based on this figure, at least, H2O and CH4 might be produced or processed at the temperatures higher than about 35 K. Usually, nuclear spin temperatures for the Oort Cloud comets clustered around 30 ± 5 K.
Download figure:
Standard image High-resolution image
Thus, icy materials in C/Machholz were probably produced at higher temperatures than the three Oort Cloud comets having D/H ∼3 × 10⁻⁴ in water. The icy materials in C/Machholz might form or be processed in the inner (i.e., warmer) region of the solar nebula than the three Oort Cloud comets. An alternative explanation is that the cometary materials formed (or were processed) in the same region of the solar nebula but at different epochs (physical conditions in the solar nebula, such as temperature, ionization degree, UV and X-ray radiations, mass accretion rate, and so on. varied with time even at the same distance from the proto-Sun; Villanueva et al. 2006).
We also note that the radial mixing of cometary materials in the solar nebula might play an important role in modifying the D/H ratios in cometary molecules (materials with different D/H ratios might be mixed together; Horner et al. 2007; Willacy 2007). In such cases, the observed D/H ratio in a molecular species represented an averaged value for the mixtures of ices that have different D/H ratios. If the radial mixing of materials occurred in the solar nebula, more sophisticated interpretation is necessary for our observations and we conclude that the molecules processed in the warm region (such molecules had lower D/H ratios) contributed to the cometary ices in addition to the materials formed or processed at lower temperatures. The fraction of materials processed in the warm region might be larger than typical Oort Cloud comets for C/Machholz.
It is usually considered that the radial transportation of refractory grains occurred from the hot inner region (where CAI-type minerals found in the STARDUST sample (Brownlee et al. 2006) formed and where amorphous silicate grains were annealed and crystallized (Wooden 2008)) to the outer region (comet-forming region) in the solar nebula. However, it is unclear whether gases processed in the hot or warm region was transported to the outer solar nebula. Although both the X-wind model (Shu et al. 1996) and the turbulent mixing model (Bockelée-Morvan et al. 2002; Ciesla 2007) can mix dust grains radially, Huebner (2008) argued that turbulent mixing can be ruled out because there is no evidence that the frozen gases in the comet nucleus have ever been exposed to the high-temperature chemical reactions expected in the inner solar nebula. Turbulent mixing might not be significant and it was not responsible for the long-distance transportation from a very inner, hot region (∼0.1 AU from the proto-Sun) to the comet formation regions in the outer solar nebula.
Radial mixing of planetesimals caused by the dynamical perturbation of giant planets might form a comet as an aggregate of multiple planetesimals that have different chemistry (i.e., heterogeneous nucleus). Chemical heterogeneity in comets is not clear. Although some comets show heterogeneity in chemistry (DiSanti & Mumma 2008), it is unclear whether the heterogeneity is nature or nurture (composition of icy materials near the surface might have been affected by solar heating at multiple passages around the Sun). Since there is no evidence for the chemical heterogeneity in C/Machholz, we assumed that the nucleus of the comet is homogeneous. Namely, the D/H ratios and other properties of ices reflect the formation (and/or condensation) conditions of ices in the comet.
6.2. Meaning of Nuclear Spin Temperatures
In the case of C/Machholz, the lower limits of nuclear spin temperatures were obtained for both H2O and CH4 and they are consistent with each other. The lower limit derived from H2O is consistent with the nuclear spin temperatures found in the Oort Cloud comets (∼30 K). However, the lower limit derived from CH4 seems to be higher than the typical nuclear spin temperature. In order to interpret our result, we should clarify what is indicated by nuclear spin temperature.
The real meaning of the nuclear spin temperature is still debated. Many authors (Mumma et al. 1993; Irvine et al. 2000; Kawakita et al. 2004; Dello Russo et al. 2005; Bockelée-Morvan et al. 2005; Crovisier 2007) discussed possible explanations for the abundance ratios of nuclear spin modifications such as OPR (or the nuclear spin temperature) in comets from various points of view:
- 1.equilibration of nuclear spin modifications within the coma through chemical reactions,
- 2.equilibration on (or near) the nucleus surface at sublimation,
- 3.equilibration in the interior of cometary nucleus during 4.6 Gyr,
- 4.equilibration before icy grains incorporated into cometary nucleus in the solar nebula.
The explanations of (1), (2), and (3) had been discussed and ruled out in previous studies (Irvine et al. 2000; Kawakita et al. 2004; Bonev et al. 2007; Crovisier 2007). However, readers may consider the explanation (3) to be valid. In previous studies, it is considered that the comet nucleus internal temperatures depend upon the comet orbital history and are expected to be different between short- and long-period comets, whereas the observed nuclear spin temperatures are almost the same (∼30 K) for both classes of comets. However, if the materials near the nucleus surface are porous and their thermal conductivity is extremely low, the temperature environment inside the nucleus since the comet formation may not have been so different for long- and short-period comets. Thus, the explanation of (3) may not be ruled out.
The most likely explanation is (4) and it means that the abundance ratios of nuclear spin modifications are cosmogonic indicators. If the abundance ratio of nuclear spin modifications of a molecular species last equilibrated in solid, the nuclear spin temperature analysis based on the rotational energy levels in the gas phase is meaningless because the rotational levels of the molecular species have different energies in the solid phase.
However, the nuclear spin temperatures of both H2O and NH3 were usually consistent with each other for a comet in the case that both nuclear spin temperatures were obtained. In particular, nuclear spin temperatures of H2O, NH3, and CH4 were consistent in comet C/2001 Q4 (NEAT; Kawakita et al. 2006). It is not likely that we can find such consistency in each comet if nuclear spin temperatures derived based on rotational energy levels in the gas phase are meaningless. The abundance ratios of nuclear spin modifications might equilibrate in the gas phase or on the surface of cold grains but very weakly bounded to the surface (namely, under the condition where the rotational energy levels are not so different from the gas phase). The mechanism(s) to equilibrate the nuclear spins of molecular species must be investigated in future, especially in the laboratory.
If nuclear spin temperatures reflect the temperature conditions where the molecules formed or had been processed, comparison between nuclear spin temperatures and the temperature range inferred from D/H ratios in the same molecular species is interesting. In Figure 6, the ranges of nuclear spin temperatures of H2O and CH4 are shown. The nuclear spin temperatures are consistent with the temperature ranges indicated by the D/H ratios. This fact also supports the hypothesis that the nuclear spin temperature reflects the physical temperatures where the molecules formed or had been processed in the solar nebula.
On the other hand, the mixing ratio of methane to water in C/Machholz is similar to the typical Oort Cloud comets as reported in Kobayashi & Kawakita (2008). From the viewpoint of organic chemistry, C/Machholz is normal except for C2H2 (which is depleted). If the temperature where cometary molecules formed and the temperature where they last condensed were different from each other, both the normal mixing ratios in C/Machholz and the higher temperatures indicated from the D/H ratios and the nuclear spin temperatures in the comet could be explained simultaneously.
For example, the icy grains that formed in the presolar molecular cloud (at ∼25–30 K) and fell onto the outer solar nebula (> ∼ 30 AU from the proto-Sun) might not experience such high-temperature conditions that the ices evaporated (Lunine et al. 1991). They accreted inward in the solar nebula and then they were finally incorporated into comets in the comet-forming region (from 5 to 30 AU from the proto-Sun according to the "Nice" model; Morbidelli et al. 2008). In contrast, part of the interstellar ices experienced higher temperature conditions and they evaporated once at their infall onto the solar nebula surfaces by accretion shock heating if they fell onto the region within ∼30 AU from the proto-Sun (Lunine et al. 1991). After that they condensed again and were incorporated into comets in the solar nebula. Mixing ratios of cometary volatiles might reflect temperatures at the molecular condensation and might not reflect their formation conditions.
Thus, icy materials in C/Machholz might be processed in the warm region of the solar nebula (D/H ratios and OPRs were modified by chemical reactions) before they were incorporated into comets. Although turbulent mixing might be too weak to transport the dust grains from the very hot inner region (∼0.1 AU) to the comet forming regions, they might be able to transport the processed materials from the warm region (∼several AU) to the colder region (a few tens of AU) in the solar nebula. Temporal variation of temperature in the solar nebula may also be important.
7. CONCLUSION
Near-infrared spectroscopic observations of comet C/2004 Q2 (Machholz) were carried out by the Keck II telescope with the NIRSPEC spectrograph on 2005 January 30. We derived the OPR of H2O to be 3.13+0.56−0.42. The A:E:F ratios of CH4 were consistent with the high-temperature limit. The lower limits of the nuclear spin temperature were 27 K and 36 K (95% c.l.) for H2O and CH4, respectively. As the result of our sensitive search for CH3D emission lines in our spectra, we found one candidate for the CH3D line (indicating the D/H ratio of (3.8 ± 1.3) × 10−3 in methane). However, since this emission line may be caused from other molecules such as CH3OH, we conclude that the D/H ratio in methane must be smaller than 6.4 × 10⁻³ (95% c.l.) in the comet. The temperature range inferred from the upper limit of the D/H ratio in methane is higher than about 25 K, which is consistent with the nuclear spin temperatures of both H2O and CH4.
Our results indicate that the cometary molecules (at least, water and methane) in C/Machholz might be processed under higher temperature conditions than typical Oort Cloud comets (∼30 K), probably in the region closer to the proto-Sun. Alternatively, the materials in C/Machholz might be processed at a different epoch from the other comets, as discussed by Villanueva et al. (2006) in the case of comet 73P/Schwassmann-Wachmann 3.
We need both more observations of comets and more extensive studies on chemical evolution from a molecular cloud to comets based on a realistic physical model of the solar nebula, in order to interpret observed quantities like OPRs (or A:E:F ratios) and D/H ratios in comets.
Data presented herein were obtained at the W. M. Keck Observatory. The authors thank M. Ishiguro, R. Furusho, and all the staff of the observatory for their support of the observations. This work was financially supported by the Ministry of Education, Science, and Culture of Japan under grants 17740107 (H. Kawakita).
Footnotes
- 1
If we consider the signal at 3053.84 cm−1 originated from another molecule (e.g., CH3OH), we could determine a more restricted upper limit for the D/H ratio in methane based on multiple nondetection of emission lines (listed in Table 3). The 95% c.l. upper limit is 2.3 × 10⁻³ (weighted mean), which is lower than the theoretical values as shown in Figure 5. A more realistic chemical model of the deuterium fractionation in cometary molecules may be needed.