


ABSTRACT
Radiation processing of the surface ices of outer solar system bodies may result in the production of new chemical species even at low temperatures. Many of the smaller, more volatile molecules that are likely produced by the photolysis of these ices have been well characterized by laboratory experiments. However, the more complex refractory material formed in these experiments remains largely uncharacterized. In this work, we present a series of laboratory experiments in which low-temperature (15–20 K) N2:CH4:CO ices in relative proportions 100:1:1 are subjected to UV irradiation, and the resulting materials are studied with a variety of analytical techniques including infrared spectroscopy, X-ray absorption near-edge structure spectroscopy, gas chromatography coupled with mass spectrometry, and high-resolution mass spectroscopy. Despite the simplicity of the reactants, these experiments result in the production of a highly complex mixture of molecules from relatively low-mass volatiles (tens of daltons) to high-mass refractory materials (hundreds of daltons). These products include various carboxylic acids, nitriles, and urea, which are also expected to be present on the surface of outer solar system bodies, including Pluto and other transneptunian objects. If these compounds occur in sufficient concentrations in the ices of outer solar system bodies, their characteristic bands may be detectable in the near-infrared spectra of these objects.
Export citation and abstract BibTeX RIS
1. INTRODUCTION
The outer solar system beyond ∼20 AU from the Sun is populated with a large number of cold planetary satellites and transneptunian objects (TNOs) including Pluto, many of which show spectroscopic or other evidence for the presence of ices on their surfaces (e.g., Cruikshank et al. 2007, 2014; Barucci et al. 2008; Hudson et al. 2008; de Bergh et al. 2013; Clark et al. 2013). The ices detected by spectroscopic observations include N2, CH4, CO, CO2, C2H6, H2O, and HCN, although no single object has yet been found to exhibit all of these ices together. While N2, CH4, H2O, CO, and perhaps CO2 are thought to be native ices inherited from the primordial solar nebula when planetesimals were forming, C2H6 and HCN are probably products of the photolysis of the other ices present. These, and many other molecules, can be produced by ultraviolet (UV) and ion irradiation of the ices (see review by Hudson et al. 2008), and in the tenuous atmospheres of those outer solar system bodies with volatile surface molecules, in particular N2, CO, and CH4. Other molecules with predicted photolysis products on Pluto and Triton include C2H2, C4H2, HC3N, C2H4, which are believed to precipitate onto the surface from the atmosphere (Krasnopolsky & Cruikshank 1995, 1999), though none of these molecules has yet been identified on an icy body of the outer solar system.
In addition to the stable molecules listed above, a wide range of radicals and ions are produced by the photolysis of N2, CH4, CO, CO2, and H2O (Bohn et al. 1994; Moore & Hudson 1998, 2003; Moore et al. 2003; Hudson et al. 2008; Hodyss et al. 2009; Kim & Kaiser 2012; Wu et al. 2012, 2013; Baragiola et al. 2013). In the laboratory setting, most of the irradiation chemistry occurs at very low temperature (∼10–20 K), and upon warming of the sample many of the radicals disappear largely through reaction with other species. At the temperature of Pluto's surface (∼33–55 K), Hodyss et al. (2011) demonstrated that C2−, CN, HCO, and CNN might be present in significant quantities. Many more distant icy transneptunian objects have lower temperatures, perhaps as low as ∼20 K, in which case other radicals might persist for extended periods.
Ices of the stable molecules detected or suspected on the surfaces of TNOs are colorless, particularly when they are in the form of fine particles (few tens of micrometers) and are seen in diffusely reflected sunlight. However, Triton, Pluto, and a large majority of the smaller TNOs exhibit color in the spectral interval 0.3–2.5 μm. The color is usually manifested as a lesser or greater degree of redness, that is, after correction for the intrinsic color of the illuminating sunlight, their spectral reflectances increase toward longer wavelengths. The color has been used as a means of classification of transneptunian objects (see Barucci et al. 2005; Dalle Ore et al. 2013; and review in Fulchignoni et al. 2008).
Complex organics molecules can produce colors and absorptions that extend to longer wavelengths. Starting from small, chemically simple colorless ices, residues of complex organic compounds, mostly refractory, have been produced in the laboratory through ion bombardment and UV photolysis. These residues, often referred to as tholins, typically exhibit color ranging from yellow to reddish brown (Thompson et al. 1987; Khare et al. 1993). Similar complex organic mixtures may exist on the surfaces of TNOs and may contribute to their reddening (Cruikshank et al. 2005). Tholins produced in a planetary surface setting may dissolve in liquids that result from internal melting events, as may have occurred on Triton (Croft et al. 1995), and thus become concentrated in regions of the surface. This mechanism of surface variegation could explain the rotational color and brightness changes observed on a number of TNOs, including Pluto.
In this paper we present results of our compositional analysis of a UV-irradiated mixture of ices relevant to the surface of Pluto and other TNOs, including the stable, refractory residue remaining after all the ice species have sublimed. The mixture consists of N2, CH4, and CO in relative proportions 100:1:1 deposited at low temperature, UV-irradiated, and analyzed as described in Section 2 and the Appendix. Laboratory UV-irradiation of N2:CH4:CO ice mixtures results in the formation of new compounds and reactive species such as ions and radicals. Many of the small, simple photoproducts can be identified using IR spectroscopy, however, more complex, refractory materials are also produced. Extensive work has been done characterizing UV- and ion-irradiated ices with similar compositions (Bohn et al. 1994; Moore & Hudson 2003; Hodyss et al. 2011; Kim and Kaiser 2012). Other work has already been carried out to study the refractory residues of similar ices subjected to ion bombardment using infrared (IR) spectroscopy (Strazzulla et al. 2001; Palumbo et al. 2004) but these residues remain largely uncharacterized. Here, we focus on the composition of these refractory residues using multiple analytical techniques including IR spectroscopy, X-ray absorption near-edge structure (XANES) spectroscopy, gas chromatography coupled with mass spectroscopy (GC-MS), and high-resolution mass spectroscopy (HRMS).
2. BASIC EXPERIMENTAL APPROACH
Complete details of the production and analysis of our irradiated ice samples are given in the Appendix, but here we summarize the main points. Ices were condensed from a pre-mixed container of N2, CH4, and CO in relative proportions 100:1:1 onto a substrate cooled to 15–20 K in a high-vacuum chamber. Three different kinds of substrate were used, depending on the intended analytical technique. For IR spectroscopy, a gallium arsenide (GaAs) window was used, allowing transmission spectra to be taken at several stages of the experiment. For residues to be analyzed with GC-MS and HRMS techniques, ices were deposited on ultra-clean aluminum foils. Finally, for analysis with XANES spectroscopy, ices were deposited on transmission electron microscopy (TEM) grids coated with SiO films.
During the slow condensation of the gas mixture on the substrate over several tens of hours (see Appendix A.1), the substrate was irradiated with a H2-discharge lamp producing primarily Lyα photons (121.6 nm), as well as a continuum centered around 160 nm. In the experiments with the GaAs window substrate, IR spectra were taken at various stages during the deposition/irradiation process, and later at several stages of the slow warm-up procedure to monitor the production, loss, and evolution of the ices and the refractory residues they contained.
The IR spectral analysis during and after deposition and warm-up was accomplished with the spectrometer attached to the vacuum chamber in which the sample was prepared. The XANES analysis was performed after warming the residues to room temperature and extracting them from the vacuum chamber, and directly exposing them to a synchrotron-based X-ray beam. For the GC-MS analysis, the room-temperature residues were harvested from the Al foil on which they were deposited, derivatized as described in Appendix A.4, and then injected into the instrument. Finally, for HRMS, the samples were extracted from their foil with a 1:1 mixture of acetonitrile and methanol.
3. RESULTS
UV photoprocessing of our N2:CH4:CO ice mixtures at 15–20 K results in the formation of a complex mixture of new compounds, ions, and radicals which were observed at low temperature with IR spectroscopy. As the samples warmed, the ice rearranged and sublimed allowing many of the remaining ions and radicals to become mobilized and react to form new species. After the ices completely sublimed, refractory materials remained on the substrate up to room temperature, and were analyzed in situ by IR spectroscopy and ex situ by XANES, GC-MS, and HRMS.
3.1. Infrared Spectroscopy
3.1.1. Ice at Low Temperature (15–20 K)
The IR spectrum of a typical unprocessed N2:CH4:CO ice mixture (Figure 1) only contains bands consistent with the expected starting materials with the exception of a feature consistent with H2O contamination (∼0.05% of the total ice). This band is not unexpected since a trace amount of H2O is known to be the main contaminant in our vacuum system (Nuevo et al. 2012; Materese et al. 2013). The IR spectrum of a typical UV-irradiated ice (Figure 1, middle) shows the presence of many new bands associated with product species in addition to the bands from the original ice components. Many of the bands present after UV irradiation of the starting ice mixture chosen in these experiments were previously seen in similar experiments using UV and ion radiation sources (Bohn et al. 1994; Moore & Hudson 2003; Jamieson et al 2009; Hodyss et al. 2011). Our results are consistent with these findings, and a list of the product molecules and radicals consistent with the IR spectra of our irradiated ices at low temperature is given in Table 1.

Figure 1. Top: baseline-corrected IR spectrum of a typical N2:CH4:CO (100:1:1) ice mixture at 17 K. * denotes water contamination (∼0.05% of the total ice). Note that all CH4 and CO fundamental bands are effectively saturated. Middle: baseline-corrected IR spectrum of UV-photoprocessed N2:CH4:CO (100:1:1) ice at 17 K showing the presence of a large number of product species. Note that the CO fundamental is saturated. Bottom: Baseline-corrected IR spectrum of the same UV-photoprocessed ice at 50 K showing the loss of many radicals and volatile species.
Download figure:
Standard image High-resolution imageTable 1. Bands Identified in the Infrared Spectra of Photoprocessed N2:CH4:CO (100:1:1) Ices
| Band Positions | Assignments | Literature value |
|---|---|---|
| 611 cm−1 (16.37 μm) | CH3 radicala | 611 cm−1† |
| 663 cm−1 (15.08 μm) | CO2a | 662 cm−1† |
| 748 cm−1 (13.37 μm) | HCNa | 747 cm−1† |
| 882 cm−1 (11.34 μm) | CH2N2a | 881 cm−1† |
| 1090 cm−1 (9.17 μm) | HCO radicala | 1089 cm−1† |
| 1377 cm−1 (7.26 μm) | C2H6b | 1376.8 cm−1 |
| 1407 cm−1 (7.11 μm) | CH2N2a | 1407 cm−1 |
| 1466 cm−1 (6.82 μm) | C2H6b | 1466 cm−1 |
| 1478 cm−1 (6.77 μm) | NCN radicalf | 1475 cm−1† |
| 1500 cm−1 (6.67 μm) | H2COc | 1499 cm−1 |
| 1657 cm−1 (6.04 μm) | N3 radicala | 1657 cm−1† |
| 1740 cm−1 (5.75 μm) | H2COc | 1742 cm−1 |
| 1798, 1800 cm−1 (5.56 μm) | HCN2 radicala | 1798 cm−1† |
| 1862 cm−1 (5.37 μm) | HCO radicala | 1861 cm−1† |
| 1875 cm−1 (5.33 μm) | NOa | 1874 cm−1† |
| 2044 cm−1 (4.89 μm) | CNg | 2046 cm−1† |
| 2096 cm−1 (4.77 μm) | HCNa, CH2N2a | 2096 cm−1† |
| 2236 cm−1 (4.47 μm) | N2Oa | 2235 cm−1† |
| 2250 cm−1 (4.44 μm) | C3O2a | 2253 cm−1† |
| 2268 cm−1 (4.41 μm) | HCNOa | 2266 cm−1† |
| 2349 cm−1 (4.26 μm) | CO2a | 2348 cm−1† |
| 2800 cm−1 (3.57 μm) | H2COc | 2798 cm−1 |
| 2892 cm−1 (3.46 μm) | C2H6b | 2892 cm−1 |
| 2922 cm−1 (3.42 μm) | C2H6b | 2922 cm−1 |
| 2949 cm−1 (3.39 μm) | C2H6b | 2951 cm−1 |
| 2986 cm−1 (3.35 μm) | C2H6b | 2987 cm−1 |
| 3271 cm−1 (3.06 μm) | C2H2a | 3270 cm−1 |
| 3287 cm−1 (3.04 μm) | HCNa | 3286 cm−1† |
| 3566 cm−1 (2.80 μm) | HNCa | 3565 cm−1† |
| 4166 cm−1 (2.44 μm) | HCNd | 4173 cm−1* |
| 4842 cm−1 (2.07 μm) | CO2e | 4830 cm−1* |
| 4975 cm−1 (2.01 μm) | CO2e | 4971 cm−1* |
| 5092 cm−1 (1.96 μm) | CO2e | 5087 cm−1* |
| 5385 cm−1 (1.86 μm) | HCNd | 5393 cm−1* |
Notes. †Denotes that the value is from a photolysis or ion radiation experiment. *Denotes lack of ice matrix. aMoore & Hudson (2003). bBohn et al. (1994). cVan der Zwet et al. (1989). dRank et. al. (1960). eQuirico et al. (1999). fMilligan & Jacox (1967). gMilligan et al. (1965).
Download table as: ASCIITypeset image
One of the photoproducts detected at low temperature is HCN. Although HCN has been previously detected in similar ice mixtures (Moore & Hudson 2003), it is important to note how readily nitrogen becomes incorporated into product molecules. Indeed, Lyα photons (10.2 eV) are energetic enough to break the N≡N bond (9.8 eV), but the absorption cross section at this wavelength is very small (Keller-Rudek & Moortgat 2010), so that a process involving another atom or molecule is usually needed to break the N≡N bond with UV photons. It has been proposed that the formation of atomic C or alternatively the formation of the CH radical and their subsequent reaction with N2 may drive much of the nitrogen chemistry in the ice (Hodyss et al. 2011). Other highly abundant photoproducts observed in the ice include CO2, C3O2, and CH3 radicals (Table 1). As samples warm up, the ice matrix rearranges, allowing radicals to react, as supported by the disappearance of the bands associated with both of these radicals from the spectra recorded at 50 K (Figure 1, bottom).
3.1.2. Infrared Spectra of the Refractory Residues
After each sample had been warmed to room temperature and the ice had sublimed away, spectra of the refractory residue remaining on the substrate were obtained (Figure 2). These spectra possess broad absorption features, quite dissimilar to the narrow well-defined bands of compounds suspended in the N2 ice matrix. While the quality of the spectrum is excellent in the 4000–600 cm−1 (2.50–16.67 μm) range, the broadness and weakness of the features do not result in high-quality spectra from 10,000 to 4000 cm−1 (1–2.5 μm) that consist of overtones and combination modes. The first feature observed in such a typical IR spectrum is a broad band between 3500 and 2400 cm−1 that is consistent with overlapping of O–H and N–H stretching modes. These bands may suggest the presence of alcohols, carboxylic acids, and amines. On top of this feature, C–H stretching modes appear between 3000 and 2750 cm−1. These bands fall at the expected values for CH3 symmetric (2966 cm−1), CH2 symmetric (2921 cm−1), CH3 asymmetric (2874 cm−1), and CH2 asymmetric (2851 cm−1) modes. We note that while we do not observe bands for aromatic or olefinic stretching modes, their strengths are often at least an order of magnitude weaker than aliphatic bands, so that they may also be present but undetectable. We are unable to report reliable CH2/CH3 ratios because of the weakness of the bands and large uncertainties associated with choosing an appropriate baseline due to the overlap with the strong band associated with O–H and N–H stretching modes. A strong feature consistent with C≡N or O–C≡N moieties and their associated isomers appears between 2300 and 2050 cm−1. This may indicate the presence of various nitriles, isonitriles, cyanates, and/or isocyanates. The final definitively identifiable feature appears between 1800 and 1480 cm−1 and is consistent with C=O or C=N stretching modes and NH2 bending modes. This feature could indicate the presence of aldehydes, ketones, or carboxylic acids, as well as amines. It should be noted that C=C bands also fall near this region, but these are often weak features. Other unidentified modes appear between 1480 and 600 cm−1, but their features are less well defined and tend to overlap, making any specific identification difficult. Based on the identification of other spectral features, we can assume that O–H and C–H bending modes contribute to the features between 1470 and 1350 cm−1.

Figure 2. Baseline-corrected IR spectrum of a typical 300 K refractory residue produced from the UV photolysis of an N2:CH4:CO (100:1:1) ice mixture.
Download figure:
Standard image High-resolution imageThe IR spectrum of our residue is remarkably similar to the spectra of ion-irradiated H2O:CH4:N2 (1:1:1) (Strazzulla et al. 2001) and N2:CH4:CO (1:1:1) ices (Palumbo et al. 2004), although notable differences exist in the relative intensities of the aliphatic C–H stretch modes, the C≡N/O–C≡N features, and the intensity of the broad feature consistent with O–H or N–H stretch modes. Despite these differences, the spectra suggest that the residues contain similar functional groups regardless of differences in the energy source, the composition of the exact starting ice components, and their respective relative abundances as long as they are made of the same starting elements N, C, O, and H. Although the IR data provide useful information about the functional groups present in our refractory residues, specific identifications of the compounds contained within are difficult using this technique alone, so other techniques were also employed.
3.2. XANES Spectra of Refractory Residues
XANES data can be used to elucidate some structural details that IR spectroscopy cannot. X-ray absorption spectra in the carbon, nitrogen, and oxygen edges provide information about the types of chemical bonds present in the sample for each respective element. This technique has a built-in consistency check since a bond type identified in one edge should also be present in its complimentary form in another edge. For example, a sample containing nitriles should show the presence of C≡N bonds in both the carbon-edge and nitrogen-edge spectra. An initial X-ray image of a section of the TEM grid was taken in order to locate portions of the residue suitable for XANES line scans. The X-ray microscope reveals that organic residues produced from the UV irradiation of N2:CH4:CO (100:1:1) ice mixtures consist of elongated script-like structures scattered all over the SiO films of the TEM grids, as shown on the X-ray absorption microscopy image (390 eV) of a representative residue in Figure 3. The lines on this image correspond to the locations where the various XANES line scans in the C-, O-, and N-edges were taken. The corresponding C-, N-, and O-edge spectra, in addition to a complete CNO spectrum, are shown in Figure 4. Bands in these spectra have been assigned to specific functional groups (Cody et al. 2008) that are listed in Table 2. The C-edge spectrum indicates the presence of aromatic and/or olefinic carbons (285.2 eV) in this residue. The C- and N-edge spectra both show strong bands indicative of the presence of nitrile (C≡N) moieties (286.7–286.9 eV and 399.9 eV, respectively). Additionally, the C- and O-edge spectra indicate the presence of carboxyl groups (288.4–288.7 eV and 532.0 eV, respectively). It should be noted that some of the weaker C-edge features falling at positions consistent with aryl/vinyl-keto (286.1–286.3 eV) and urea (289.7 eV), do not show matching features in the N- and O-edges.
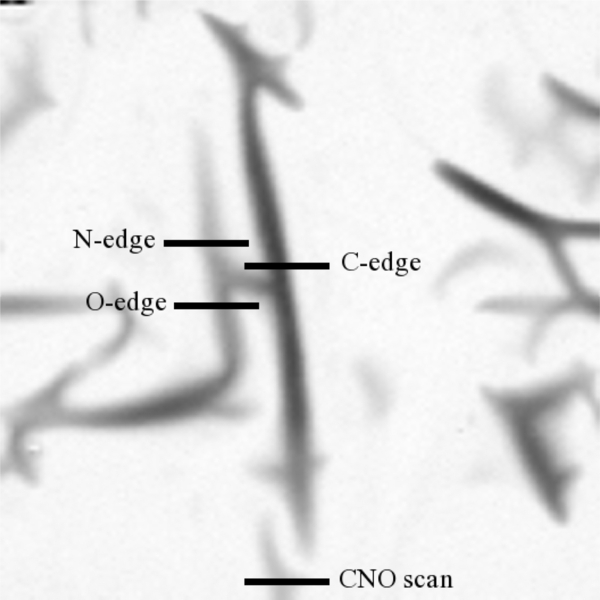
Figure 3. X-ray absorption microscopy image (390 eV) of a typical refractory residue with the positions of the C-edge, N-edge, O-edge, and full CNO line scans depicted. Each line scan is 10 μm in length.
Download figure:
Standard image High-resolution image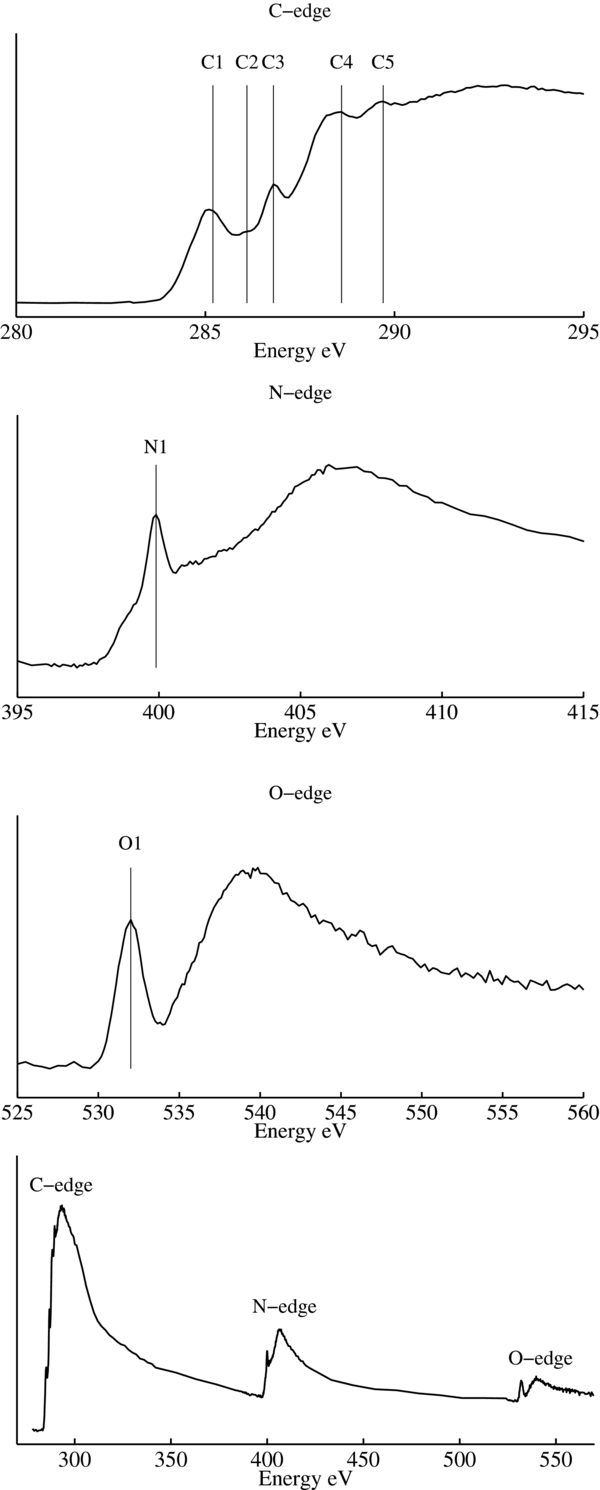
Figure 4. From top to bottom, carbon, nitrogen, oxygen edge, and full CNO spectra of the residue shown in Figure 3. Identified absorption features are listed in Table 2.
Download figure:
Standard image High-resolution imageTable 2. X-Ray Absorption Features Detected in a Typical Refractory Residue
| Band | Energy* | Associated Functional Group | Transition | |
|---|---|---|---|---|
| (eV) | ||||
| C-edge | C1 | 285.2 | aromatic/olefinic: C=C* | 1s–π* |
| C2 | 286.1–286.3 | aryl, vinyl-keto: C=C*–C=O | 1s–π* | |
| C3 | 286.7–286.9 | Nitrile: C*≡N | 1s–π* | |
| C4 | 288.4–288.7 | carboxyl: OR(C*=O)C | 1s–π* | |
| C5 | 289.7 | urea: NHx(C*=O)NHx | 1s–π* | |
| N-edge | N1 | 399.9 | Nitrile: C≡N* | 1s–π* |
| O-edge | O1 | 532.0 | carboxyl: O–C=O* | 1s–π* |
Note. *Energies from Cody et al. (2008).
Download table as: ASCIITypeset image
XANES data can be used to estimate the relative elemental abundances of C, N, and O in our samples by comparing the increase in absorption above the ionization edge to the absorption below the ionization edge (Cody et al. 2008; Nuevo et al. 2011). Estimated N/C and O/C ratios were obtained by fitting the full CNO spectra with atomic absorption coefficients (Henke et al. 1993), using the model described in Cody et al. (2008). Applying this method to the CNO spectrum shown in Figure 4 results in an estimated N/C ratio of approximately 0.5, and an estimated O/C ratio of approximately 0.3. These ratios suggest that this residue is rich in both N- and O-containing molecules. More accurate ratios could not be determined because our samples produced spectra with deviations from tabulated photoabsorption curves that are most likely the result of scattering effects.
XANES serves as a complimentary technique to IR spectroscopy and is able to confirm IR results in addition to providing new details about the functional groups contained in the residue. The detection of nitriles and carboxyl groups in the XANES data are consistent with the IR data and help to clarify which of the alternative identifications provide the dominant contribution to the spectrum. Specifically, the only large unambiguous feature in the N-edge corresponds to the nitrile moiety. Although this does not mean there are no other types of nitrogen-containing compounds in the residue, it does suggest that nitriles are relatively abundant, which is consistent with IR data (Figure 2). Similarly, carboxyl group-containing compounds are relatively abundant within the subset of oxygen-containing compounds. The XANES data also indicate that in addition to the aliphatic carbons in the residue detected in the IR spectrum, there are also aromatic or olefinic carbons whose presence could not be confirmed in the IR spectra. Finally, in agreement with the IR data, the C-edge spectrum indicates the presence of strong carboxyl and nitrile bands each of which are confirmed by the O- and N-edge data, respectively.
3.3. GC-MS and HRMS Analyses of Refractory Residues
The refractory residues made on Al foils were analyzed by GC-MS in an effort to identify some specific compounds contained within them. Solvated samples of the raw residues and tert-butyldimethylsilyl derivatives of the residues were injected into the GC-MS. Only the chromatograms obtained for the derivatized residues (Figure 5) yielded any identifiable compounds (Table 3). These were mostly dicarboxylic acids (oxalic acid), hydroxycarboxylic acids (lactic acid, 2-hydroxy-2-methylpropionic acid, 2-hydroxybutyric acid, 3-hydroxypropionic acid) or dihydroxycarboxylic acids (glyceric acid). The last compound identified was urea. The retention time for each compound was confirmed by comparison to the chromatograms of purchased standards prepared and injected under the same conditions as the residues, with the exception of 2-hydroxy-2-methylpropionic acid (for which no standard was available), which was only tentatively identified using the NIST database built in the GC-MS analysis software.
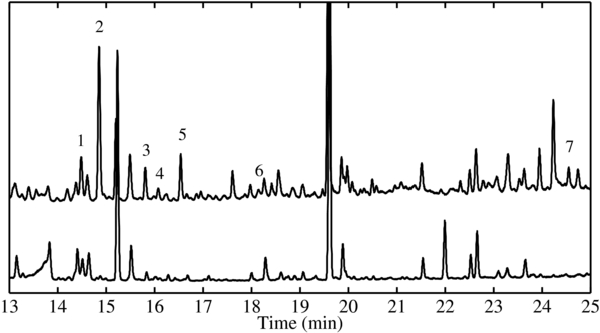
Figure 5. Top trace: GC-MS total-ion chromatogram (TIC) of a typical refractory residue produced from an N2:CH4:CO (100:1:1) ice mixture that was UV irradiated at 20 K. Bottom trace: GC-MS TIC of a control N2:CH4:CO (100:1:1) ice mixture that was not UV irradiated. Peaks have been numbered according to their identification in Table 3.
Download figure:
Standard image High-resolution imageTable 3. Compounds Detected in the GC-MS Chromatograms of the Refractory Residues
| Species | Formula | Molecular mass | Rt (GC-MS) | Parent peak | 13C parent peak |
|---|---|---|---|---|---|
| (Da) | (min) | (Da) | (Da) | ||
| 1. Lactic acid | C3H6O3 | 90 | 14.5 | 261 | 264 |
| 2. Glycolic acid | C2H4O3 | 76 | 14.9 | 247 | 249 |
| 3. Oxalic acid | C2H2O4 | 90 | 15.8 | 261 | 263 |
| 4. 2-Hydroxybutyric acid | C4H8O3 | 104 | 16.1 | 275 | 279 |
| 5. 3-Hydroxypropionic acid | C3H6O3 | 90 | 16.5 | 261 | 264 |
| 6. Urea | CH4N2O | 60 | 18.1 | 231 | 232 |
| 7. Glyceric acid | C3H6O4 | 106 | 24.6 | 391 | 394 |
Download table as: ASCIITypeset image
It should be noted that lactic acid, glycolic acid, and oxalic acid, which were observed in the GC-MS chromatograms of the residues, were also detected in blank chromatograms where no ice was deposited and no radiation was used, as well as in controls where an ice mixture was deposited but no radiation was used. However, the scale of these peaks in the control samples was much smaller than those found in the residues (Figure 5). Although the source of this background contamination was not identified, we were able to verify the experimental production of these compounds using isotopically labeled starting compounds. For this, we performed experiments in which we replaced our normal starting CH4 and CO with 13CH4 and 13CO, respectively. All of the previously identified compounds, including lactic, glycolic, and oxalic acids were detected as their 13C variant in the labeled residue (Table 3), confirming the production of these species during the ice photolysis and/or subsequent warm-up. Several additional unidentified peaks are also present in the chromatograms of the processed residues that do not appear in the chromatograms of the control experiments. The two largest unidentified peaks elute at 17.61 minutes (m/z = 246 Da) and 24.23 minutes (m/z = 272 Da).
The compounds detected in the GC-MS chromatograms are consistent with the presence of the strong C=O and O–H bands seen in the IR spectrum, and with the band associated with carboxyl groups observed in the C- and O-edge XANES spectra (Figure 4, Table 2). The detection of urea is also consistent with both the IR and C-edge XANES data.
No other compounds were unambiguously identified in the derivatized residues in the GC-MS chromatograms. Many of the compounds identified in the chromatograms, including glycolic acid, oxalic acid, lactic acid, 3-hydroxypropanoic acid, glyceric acid, and urea, have been previously detected in residues from the photolysis or radiolysis of different astrophysical ice analogs, typically containing H2O and/or CH3OH (McDonald et al. 1996; Schutte 2002; Nuevo et al. 2010, 2012; Materese et al. 2013).
Finally, HRMS detected over 10,000 peaks in the m/z range between 150 and 500 Da (Figure 6). Tentative chemical formulae were determined for approximately 7000 peaks using methods described in Imanaka and Smith (2010). Due to the high resolution of the data obtained, each peak could be associated with a unique chemical formula. From these data, we could determine the likely formulae of over 5000 of these unidentified compounds that contain C, H, O, and N atoms ("CHON" compounds). Most species observed have H/C ratios of approximately 1.5, which suggest that this material may be a mixture of aliphatic and olefinic or aromatic carbon chains, as suggested by the IR and XANES data (Section 3.1). The N/C and O/C ratios of those observed species range between 0.3–0.5 and 0.15–0.3, respectively, which is consistent with the values determined from the XANES data (Section 3.2). These data clearly indicate that the UV-irradiation of N2:CO:CH4 ice mixtures can generate a wide variety of complex, high-mass CHON compounds.

Figure 6. High-resolution mass spectrum of the positive ions of a typical refractory residue produced from an N2:CH4:CO (100:1:1) ice mixture that was UV irradiated at 20 K. The high resolution of these data allows us to assign one peak to only one chemical formula. Inset shows an expanded view of an arbitrarily chosen region of the mass spectrum with several peaks identified: (A) C11H19N4O2, (B) C13H23N2O2, (C) C12H23N4O, (D) C10H19N6O, (E) C9H15N6O2, (F) C12H19N2O3, (G) C10H15N4O3, (H) C14H27N2O.
Download figure:
Standard image High-resolution image
4. DISCUSSION
Our results indicate that the nitrogen atoms from N2 are readily incorporated into other complex molecules upon UV irradiation of N2:CH4:CO ice mixtures despite its weak absorption cross section at Lyα energies. Moore & Hudson (2003) previously demonstrated that the nitrogen from N2 could be incorporated via ice photolysis into smaller, more volatile compounds and radicals such as HCN, HNC, CH2N2, and HCN2. It is possible that some of these species, especially the radicals, react with their neighbors in the ice through subsequent photoprocessing at low temperatures, or that rearrangement and sublimation of the ice matrix upon warm-up brings reactive species together to form more complex refractory materials. As mentioned earlier, the incorporation of N atoms from N2 into other more complex species may occur via a mechanism involving C atoms and/or CH radicals formed from the photolysis of C- and H-containing species in the ices (Hodyss et al. 2011). Such mechanism could be activated via UV irradiation or ion bombardment, and would not be affected by the low absorption cross section of N2 for UV photons.
Our results also demonstrate that carboxylic acids and urea readily form through the photoprocessing and warm-up of N2-dominated, H2O-poor ices relevant to some outer solar system bodies. Some of these compounds are oxygen-rich, water-soluble, and some like urea are of astrobiological interest. Though we are nowhere near to having completely identified all of the compounds in these residues, it should be noted that there are significant qualitative differences in the solubility of these refractory ice residues and the "tholins" produced from gas discharge experiments. Indeed, the former are readily soluble in water, methanol, acetonitrile, and other solvents, while the latter remain significantly insoluble in most solvents, including dimethylsulfoxide (DMSO). This last point may be relevant for solar system objects, which experience warming and cooling events that could lead to the solvation and mobilization of the newly formed materials.
Overall, the refractory materials that remain on the substrate at room temperature produced weak broad spectral features relative to the bands associated with more volatile material present in the original ice at low temperature (Figure 1). Unfortunately, the weakness of these features prevents us from obtaining near-infrared (NIR) spectra of the residues, which would have been interesting to compare to with the data that are expected to return from the flyby of Pluto by the New Horizons spacecraft. However, based on some of our identifications, we can suggest some features that could be sought in the NIR spectra of astronomical objects. In the NIR range, the O–H stretch of carboxylic acids typically produces a broad shift in the baseline from ∼5900 to 4550 cm−1 (1.7–2.2 μm) with no discernable peak (Workman & Weyer 2012). Carboxylic acids, of which a few compounds are the only products formally identified in our residues together with urea, produce second overtones with nominal positions between ∼5263 and 5075 cm−1 (1.90–1.97 μm). However, these positions are highly variable (up to 100 cm−1), depending on the nature of the other bonds in the molecule (Workman & Weyer 2012). Finally, the C≡N bond, associated with the presence of nitriles or isonitriles, produces an overtone with a position peak near 4550 cm−1 (2.2 μm; Cruikshank et al. 1991).
Although the detection of these complex materials may be difficult, especially if the instrument used has poor detection limits, or if there are large overlapping spectral features from other materials, it may still be possible to detect these materials with IR spectroscopy on an actual astronomical object because of accumulation of the material over time. For example, objects whose atmospheres undergo seasonal collapse may produce such a repetitive accumulation. During the cold season, the atmosphere would condense to ice that may be subjected UV and other forms of radiation, such as energetic ions and electrons. As the atmosphere re-emerges, the volatile ices may sublime, presumably leaving behind the refractory material produced in the solid phase, in addition to any precipitates from gas-phase chemistry produced in the atmosphere. Cycling of the seasons will cause the process to repeat itself as long as there are volatile reactant ices present.
5. CONCLUSIONS
The surfaces of icy outer solar system objects are likely covered with organic materials that have either precipitated from gas-phase reactions, or have formed in the surface ice from ion bombardment or UV-irradiation. Many of the small simple compounds that likely exist on these objects have been well characterized in previous experimental studies, but the complex materials formed from ice photoprocessing were still largely uncharacterized. In this work we performed experiments in which we irradiated outer solar system ice analogs with UV photons and utilized several analytical techniques to characterize the complex organics that may form on the surfaces of N2-rich, H2O-poor icy bodies. The UV photolysis of several mixtures of N2:CH4:CO (100:1:1) ice mixtures at very low temperature (15–20 K) results in the formation of a refractory residue that survives sublimation of the surrounding ice matrix when the temperature increases. Despite the simplicity of the composition of the initial ice mixtures, we demonstrated that our photoprocessing experiments result in the formation of a mixture of large complex molecules. IR spectra of the refractory materials provided useful information about the composition of the residue, but questions remained for some of the identifications. XANES spectroscopy provided an alternative means to probe the structural details of the compounds contained in the residue and was useful in solidifying the identification of nitriles and carboxyl groups seen in the IR data. Additionally, XANES data provided an estimate of the relative atomic abundances of C, N, and O in the residues (N/C ∼ 0.5 and O/C ∼ 0.3), which shows that these materials are rich in both N and O, and demonstrates that each of the initial simple reactant ices contribute significantly to the composition of the final residues. The GC-MS results permitted the identification of specific compounds in the residues, including several carboxylic acids and urea, some of which are of astrobiological interest. Finally, HRMS data showed that a wide range of complex, high-mass (m/z = 100–500 Da) CHON compounds are formed from the photoprocessing of these simple N2:CH4:CO ice mixtures.
Although the IR absorption bands produced by these residues are weak relative to the ices from which they formed, they may still be detectable on outer solar system objects. Periodic or random warming events may concentrate these residues through sublimation of more volatile ices, or by solvation and pooling. These residues may also contribute to the visible redness observed of the surface of some outer solar system bodies.
C.K.M. acknowledges R. L. Walker (NASA Ames) for technical support, the NASA Postdoctoral Program (NPP) administered by ORAU, and D. Kilcoyne for assistance with ALS beamline 5.3.2.2. C.K.M. also acknowledges the reviewer for helpful comments and suggestions. D.P.C. acknowledges support from NASA's New Horizons mission program. S.A.S. acknowledges support from NASA's Origins of solar systems and Exobiology programs. H.I. acknowledges support from NASA's Cassini Data Analysis and Exobiology programs. H.I. also acknowledges Dr. Arpad Somogyi for assistance with HRMS measurements.
APPENDIX: EXPERIMENTAL AND ANALYTICAL DETAILS
Although many of the experimental methods remain consistent for all experiments discussed in this paper, three major analysis techniques were utilized in this work, and each required slight variations in experimental set-up, sample preparation and sample collection. These techniques include IR spectroscopy, XANES spectroscopy, GC-MS and HRMS. It should be assumed that the same protocol and set-up was used for the production of the samples analyzed by all four techniques unless otherwise noted.
IR spectroscopy allowed us to observe specific species in the ices in situ, and track radiation or thermally induced changes as they occurred. IR spectroscopy provided some generic information about functional groups present in refractory materials left behind after the samples were warmed and the volatile ices sublimed. XANES spectroscopy provided additional information about functional groups present in the refractory residues, and could be used to estimate atomic abundance ratios between carbon, nitrogen, and oxygen. GC-MS can provide data about specific compounds present in the refractory residues. Finally, HRMS can provide highly precise atomic mass measurements which allow exact chemical formulae to be unambiguously assigned to each peak. As previously stated, IR spectroscopy was performed in situ, while both XANES and GC-MS analyses required extraction of the samples from the vacuum chamber at room temperature, either as solids on TEM grids (XANES) or in solvents (GC-MS, HRMS).
A.1. Sample Preparation and Irradiation
Ices are condensed from pre-mixed room-temperature gases. All gas mixtures were prepared in a glass line evacuated by a diffusion pump (Edwards BRV 10, background pressure ∼5 × 10⁻⁶ mbar). N2 (gas, Matheson Tri-Gas, Matheson grade, 99.9995%), CH4 (gas, Matheson Tri-Gas, Research purity, 99.999%), and CO (gas, Scott Specialty Gasses, CP grade, 99.99% purity) were mixed in ∼2 L glass bulbs in a 100:1:1 ratio, to a total pressure of 102 mbar. The ratios between the components were determined from their partial pressures in the bulb with a precision of 0.05 mbar. Additional experiments were run using 13CH4 (gas, Cambridge Isotope Laboratories, 99% 13C) and 13CO (gas, Cambridge Isotope Laboratories, 99% 13C, 2% 18O) in the same ratios as previously described.
All sample deposition and irradiation was carried out inside a vacuum cryogenic chamber evacuated by a diffusion pump (Edwards BRV 25) to pressures in the low 10−8 mbar range. Gas mixtures were deposited onto a substrate cooled to 15–20 K by a closed-cycle helium cryo-cooler (APD Cryogenics; Allamandola et al. 1988; Bernstein et al. 1995). This substrate varied depending on the type of experiment being performed: a GaAs window for IR transmission experiments, transmission electronic microscopy (TEM) grids coated with SiO films (SPI Supplies) for experiments whose residues were analyzed with XANES spectroscopy, and pre-baked (500°C) aluminum foil for experiments whose residues were analyzed with GC-MS or HRMS. As each gas mixture condensed as an ice when deposited onto the cryo-cooled substrate, it was simultaneously photo-irradiated with a microwave-powered H2-discharge UV lamp (Opthos). This lamp primarily emits photons at 121.6 nm (Lyα) and also produces a continuum centered around 160 nm, with an estimated total flux of ∼2 × 10¹⁵ photons cm−2 s−1 (Warnek 1962). For experiments whose residues were analyzed with IR spectroscopy, GC-MS, and HRMS the deposition time varied from 70 to 90 hr, for a total of ∼70–90 mbar of the initial gas mixtures used. The thicknesses of the ices were estimated during IR spectroscopy experiments by using interference fringes in the spectra. The thicknesses of the ices were found to grow linearly with the gas deposition rate up to a final thickness between 12 and 15 μm. The deposition time for the experiments whose residues were analyzed with XANES spectroscopy was 44 hr and consumed 20 mbar of the initial gas mixture, to ensure that the resulting residues were not too thick, so that the X-ray spectra of the samples would not be saturated.
For all samples, once simultaneous deposition and irradiation had concluded, the substrate was warmed using a resistive heater to control the temperature. Since the ices were largely dominated by N2, the substrate was initially heated at 1 K min−1 to 30 K. Between 30 and 50 K, the ices were gently heated at 0.2 K min−1 to avoid any loss of material due to rapid sublimation. Each sample was then heated from 50 to 150 K at 1 K min−1. For experiments only monitored with IR spectroscopy, at 150 K the cryo-cooler was shut off and the samples were allowed to naturally warm to 300 K. For the other experiments, upon reaching 150 K, the cryo-cooler was shut off and the sample chamber was flooded with argon (gas, Airgas 99.6%) to restore atmospheric pressure in an effort to retain semi-volatile species in the residue that would not survive vacuum conditions at higher temperatures. The samples were then allowed to warm to 300 K naturally.
We note that in an effort to determine what effect exposure to air would have on our samples, we exposed one of our residues with a known IR spectrum to air for over 24 hr and then repeated the measurement and observed no significant differences.
A.2. Infrared Spectroscopy
Detailed descriptions of our experimental set-up have been previously published, and the configuration of the vacuum chamber remains unchanged (Hudgins et al. 1993; Mastrapa et al. 2008). Briefly, the vacuum chamber has been configured so that the cryo-cooled substrate sat in the sample compartment of a Bio-Rad Excalibur FTS 3000 Fourier-transform infrared (FTIR) spectrometer. This substrate was positioned so that the IR beam could pass though the sample window and exterior windows of the vacuum chamber without obstruction, allowing the collection of transmission spectra. It should be noted that the substrate must be rotated between two different positions to deposit and irradiate or alternatively to take an IR spectrum. Mid-IR (MIR) spectra (6000–600 cm−1) were collected at a resolution of 1 cm−1 using a liquid nitrogen-cooled mercury–cadmium–telluride (MCT) detector and a KBr beamsplitter. NIR spectra (10000–4000 cm−1) were collected using the same detector and a quartz beamsplitter. All the final spectra in both MIR and NIR ranges were obtained by averaging 1000 scans with a resolution of 1 cm−1. These spectra were ratioed against a background scan of the clean substrate at or near the temperature where the sample scan was taken.
A.3. XANES
Samples were analyzed with a scanning transmission X-ray microscope (STXM) on beamline 5.3.2.2 at the Advanced Light Source (ALS) of the Lawrence Berkeley Laboratory, California, USA (Warwick et al. 2002; Kilcoyne et al. 2003). This beamline provides photons in the 250–700 eV range with a flux of ∼107 photons s−1 (Cody et al. 2008). XANES spectra are produced from the absorption of X-ray photons by the electrons in the sample around a chosen atomic core energy level. The carbon- (278–338 eV), nitrogen (385–419.5 eV), and oxygen (520–569.5 eV) edges, in addition to the full CNO scan range (278–581 eV) were probed using the line scan mode with 10 μm lines divided into 100 points. Spectra spanning the full CNO range allow us to determine the relative contributions of each element from mass absorption coefficient curves (Henke et al. 1993). Since X-rays could potentially alter the chemical composition of the residues (Nuevo et al. 2011), line scans were initially run with a 1 ms dwell time to minimize exposure. These scans were followed up with additional scans performed using a 5 ms dwell time over the same lines (for a total of 6 ms effective dwell time). No chemical changes were observed between the 1 and 5 ms scans so the latter are shown in this paper because of their improved signal to noise. All XANES data were reduced and analyzed with the aXis 2000 software.
A.4. GC-MS
The mass of a typical residue recovered from the vacuum chamber at room temperature was approximately 0.1 mg. This represents a lower limit of the amount of residue produced since some may be lost during the warm-up. Foils holding samples reserved for GC-MS analysis were transferred to pre-baked (500°C) glass vials containing one of the following: 0.25 mL CH3OH (liquid, Aldrich HPLC grade 99.9% purity), 0.25 mL H2O (liquid, purified to 18.2 MΩ cm by a Millipore Direct-Q UV 3 device), 0.25 mL of a 1:1 mixture of CH3CN (liquid, Aldrich HPLC grade 99.9%) and CH3OH, or no solvent at all. For samples dissolved in a solvent, 100 μL of each were extracted and dried in a vacuum desiccator for 1 hr and then derivatized by adding 50 μL of a 3:1:1 mixture of N-(tert-butyldimethylsilyl)-N-methyltrifluoroacetamide (MTBSTFA) with 1% of tert-butyldimethylchlorosilane (tBDMCS) (Restek), dimethylformamide (Pierce, silylation grade solvent), and pyrene (Sigma–Aldrich, analytical standard, 100 ng μL−1 in cyclohexane) in each dried sample vial. Samples that were kept with no solvent were directly dissolved in 50 μL of the derivatization mixture. For all samples, the vials were then heated to 100°C for 1 hr to convert hydrogen-containing functional groups such as OH and NH2 to their tert-butyldimethylsilyl (tBDMS) derivatives (MacKenzie et al. 1987; Casal et al. 2004; Schummer et al. 2009). Blanks were simultaneously prepared under the same conditions as the samples to identify any background contamination. It should be noted that no significant differences in the GC-MS results were observed as a result of the choice of solvent or lack thereof.
Chromatographic separation was conducted with a Thermo Trace gas chromatograph coupled to a DSQ II mass spectrometer. Approximately 1 μL of each derivatized sample was introduced to the GC-MS device with a syringe, using a splitless injection configuration with an injector temperature of 250°C. A Restek Rxi-5ms column (length: 30 m, inner diameter: 0.25 mm, film thickness: 0.50 μm) was used as the stationary phase and helium (carrier gas, Airgas, ultra pure) flow of 1.3 mL min−1 was used as the mobile phase. The method (temperature gradient) used for the separation is described in detail in Nuevo et al. (2009). Mass spectrometry data were recorded from m/z = 50 to 550 Da, and data analysis was performed using the Xcalibur™ software (Thermo Finnigan). Peaks in the GC-MS chromatograms were compared with the NIST database of mass spectra and our in-house database of retention times and mass spectra for commercial standards. These standards include: glycolic acid (Sigma–Aldrich, 99% purity), oxalic acid (Sigma–Aldrich, ⩾99.0% purity), L-(+)-lactic acid (Sigma–Aldrich, ⩾98% purity), 3-hydroxypropanoic acid (Tokyo Chemical Industry Co., ca. 30% in H2O, ca. 3.6 mol L−1), glycerol (Sigma-Aldrich, ⩾99% purity), and DL-glyceric acid (Tokyo Chemical Industry Co., 20% in H2O, ca. 2 mol L−1).
It should be noted that underivatized samples dissolved in 100 μL of various solvents (water, methanol, acetonitrile, or acetonitrile:methanol = 1:1) were also examined using both Restek Rxi-5ms and Restek Rtx-200ms columns. Neither column revealed compounds that were not identified using the derivatization technique.
A.5. HRMS
HRMS analysis is a powerful method to analyze complex organic molecules and to determine molecular formulae unambiguously (Marshall & Rodgers 2008; Imanaka & Smith 2010; Schmitt-Kopplin et al. 2010). Samples for HRMS are prepared using the same procedure as samples prepared for GC-MS until they are extracted from the vacuum system. For these samples, the aluminum foil is removed from the vacuum system then the residue was extracted with a methanol:acetonitrile (1:1) mixture. The soluble components were analyzed with a Fourier-transform ion cyclotron resonance mass spectrometer (FT-ICR-MS; Bruker Daltonics, apex ultra 9 Tesla) equipped with an electron spray ionization (ESI).