


ABSTRACT
We explore requirements for a solar particle event (SPE) and flare capable of producing the cosmogenic nuclide event of 775 a.d., and review solar circumstances at that time. A solar source for 775 would require a >1 GV spectrum ∼45 times stronger than that of the intense high-energy SPE of 1956 February 23. This implies a >30 MeV proton fluence (F30) of ∼8 × 10¹⁰ proton cm−2, ∼10 times larger than that of the strongest 3 month interval of SPE activity in the modern era. This inferred F30 value for the 775 SPE is inconsistent with the occurrence probability distribution for >30 MeV solar proton events. The best guess value for the soft X-ray classification (total energy) of an associated flare is ∼X230 (∼9 × 1033 erg). For comparison, the flares on 2003 November 4 and 1859 September 1 had observed/inferred values of ∼X35 (∼1033 erg) and ∼X45 (∼2 × 1033 erg), respectively. The estimated size of the source active region for a ∼1034 erg flare is ∼2.5 times that of the largest region yet recorded. The 775 event occurred during a period of relatively low solar activity, with a peak smoothed amplitude about half that of the second half of the 20th century. The ∼1945–1995 interval, the most active of the last ∼2000 yr, failed to witness a SPE comparable to that required for the proposed solar event in 775. These considerations challenge a recent suggestion that the 775 event is likely of solar origin.
Export citation and abstract BibTeX RIS
1. INTRODUCTION
Knowledge of the largest flares and solar proton events (SPEs) that the Sun can produce is important for both practical and theoretical reasons (Cliver & Svalgaard 2004; Riley 2012; Schrijver et al. 2012; Aulanier et al. 2013). Here we consider a recent report of what is possibly the largest SPE during the last ∼104 yr.
From high-time-resolution (1–2 yr) measurements of 14C in Japanese cedar trees from 750–820 a.d., Miyake et al. (2012) reported a 12‰ increase of carbon content from 774–775. Miyake et al. argued that both a nearby supernova and the Sun were improbable sources for the 775 event: a historical report (and/or remnant) would have been expected for a nearby supernova, while a solar origin would require a SPE much more intense than any observed so far. Subsequently, several sources, both solar and non-solar, have been suggested for the 775 event. The non-solar sources include a supernova hidden behind a dust cloud (Allen 2012) and galactic short-duration (Hambaryan & Neuhäuser 2013) and long-duration gamma-ray bursts (Pavlov et al. 2013). Melott & Thomas (2012) and Usoskin et al. (2013) favor a standard (eruptive flare; Reames 2013) solar source, and Eichler & Mordecai (2012) proposed a non-traditional solar source—a superflare caused by a large comet colliding with the Sun. Recently, Miyake et al. (2013) have reported a second rapid 14C increase from 992–993 a.d. that was ∼0.6 times as intense as the 775 event with a similar time profile and spectrum.
Usoskin & Kovaltsov (2012) modeled the 775 event in terms of a ∼25–50 multiple of the hard proton spectrum of the 23 February 1956 SPE. Usoskin et al. (2013) proposed a 45 times multiple and argued that "the Sun is to blame" for the 775 event. Given the current interest in determining the limits of extreme solar activity and the range of proposed origins for the 775 event, we examine the spectrum of the 1956 ground level event (GLE; requiring >500 MeV protons) used to model the 775 cosmogenic nuclide event and review the solar circumstances that gave rise to the 1956 SPE. In addition we consider the production of large >30 MeV (F30) events by the Sun during the modern era and the flare and active region sizes required to produce the 775 event. Our analysis is presented in Section 2 and results are summarized and discussed in Section 3.
2. ANALYSIS
2.1. Spectrum of the 1956 February 23 GLE
2.1.1. High-energy Branch
Seventy-one GLEs have been observed since 1956 (Cliver et al. 1982; Smart & Shea 1991; Cliver 2006; Gopalswamy et al. 2013). The standard measure of GLE intensity is the percentage increase above background for a favorably located neutron monitor with a geomagnetic cut-off rigidity of ∼1 GV. Figure 1 is a histogram of GLE intensities. The 1956 February 23 GLE was the largest ever observed with a reported increase of 4554% versus 563% for the next biggest event.
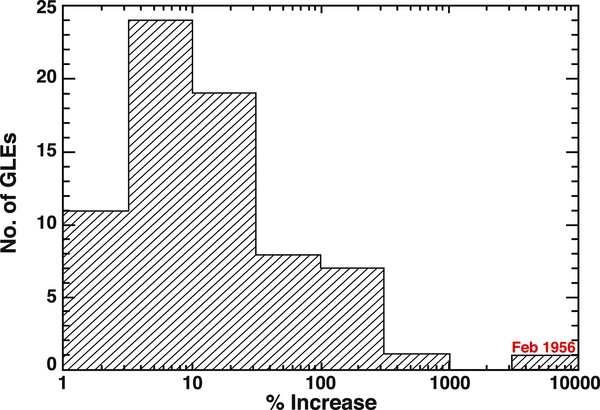
Figure 1. Histogram of the intensity of GLEs from 1942–2012.
Download figure:
Standard image High-resolution imageFigure 2 shows energy spectra obtained by Tylka & Dietrich (2009) for the nine GLEs from 1956 to the present with >1 GV proton (pr) fluence ⩾106 pr cm−2. The spectral form is a Band et al. (1993) function: a double-power-law form in energy that smoothly rolls one power-law into another. A proton energy of ∼430 MeV (1 GV) is the approximate minimum energy required for a primary proton to produce 10Be and 14C at Earth (Beer et al. 2012). The >1 GV fluence of the 1956 event (4.9 × 10⁷ pr cm−2; solid black line in Figure 2) is ∼6 times that of the next largest event (1960 November 12; 8.0 × 10⁶ pr cm−2) for which neutron monitor observations are available. The calculated 14C production of 2.9 × 10⁶ atoms cm−2 (Usoskin & Kovaltsov 2012) for the 1956 GLE and the revised production of 1.3 × 10⁸ atoms cm−2 obtained by Usoskin et al. (2013) for 775 a.d., implies that a ∼45 times multiple of the 1956 SPE spectrum (dashed black line in Figure 2) is required for the 775 event.

Figure 2. Spectra of the nine GLEs from 1956–2012 with >1 GV fluences ⩾106 pr cm−2. For the events of 1956–1960, the Band fits reflect the increased >10, >30, and >100 MeV fluence estimates from Webber et al. (2007). The Band fit for 1989 October 19 includes only the first 19 hr of the event.
Download figure:
Standard image High-resolution image2.1.2. Low-energy Branch
Because the 1956 SPE occurred before satellite observations of solar protons, the low-energy branch (<430 MeV) of the spectrum is uncertain. As noted by Reedy (1977), the primary source of low-energy data points for events prior to 1963 is Webber et al. (1963). The list therein of SPE fluences during cycle 19 (1954–1964)—based on an amalgamation of ground-based ionospheric data and rocket and balloon observations—is largely used by all subsequent researchers. Of the biggest events there is a significant difference only for 1960 November 12 event for which Feynman et al. (1990) and Shea & Smart (1990) list a >30 MeV fluence (F30; >240 MV) value of 9.0 × 10⁹ pr cm−2 (see Masley & Goedeke 1963), well above the 1.3 × 10⁹ pr cm−2 value from Webber et al.
Usoskin et al. (2013) used their 45 times multiple of the 1956 February 23 spectrum and the Webber et al. (1963) value of 1.0 × 10⁹ pr cm−2 at >30 MeV for this event to infer F30 = 4.5 × 10¹⁰ pr cm−2 for 775.
Reedy (1977) analyzed the concentration of the cosmogenic nuclides 22Na and 55Fe (both with a half-lives of ∼2.5 yr) in lunar rocks and determined that the Webber et al. (1963) F30 estimate of 9.4 × 10⁹ pr cm−2 (adjusted upward from 8.9 × 10¹⁰ pr cm−2 by inclusion of small events by others) for cycle 19 was too low by a factor of ∼5. Subsequent additions of events (and a few changed F30 values) common to the lists of Feynman et al. (1990) and Shea & Smart (1990) increase the Webber et al. F30 value to 1.0 × 10¹⁰ pr cm−2. The most recent lunar-rock-based estimate of F30 for cycle 19 is 2.3 × 10¹⁰ pr cm−2 (Reedy 2012). Comparison of a list of riometer-based >10 MeV SPE peak fluxes for cycle 19 from Bailey (1964) with those for common events in Webber et al. indicates a similar result; the median value of the ratios of the >10 MeV peak fluxes from Bailey to those of Webber et al. (1963) is ∼2.4 (cf. Reedy 1977).
Recently, Webber et al. (2007) revised the Webber et al. (1963) estimates of the three largest F30 events of cycle 19, after considering a number of studies that had been published in the interim. The F30 fluences for the three events were adjusted upward by factors of ∼1.3–3.0 as follows: 1956 February 23, 1.0 ⇒ 1.8 × 10⁹ pr cm−2, 1959 July 10–17, 3.2 ⇒ 4.0 × 10⁹ pr cm−2, and 1960 November 12–15, 2.0 ⇒ 6.0 × 10⁹ pr cm−2.
Of primary interest here is the revised F30 value for 1956 February 23. It increases the F30 estimate for the 775 event from ∼4.5 × 10¹⁰ to ∼8 × 10¹⁰ pr cm−2. We regard this as a conservative estimate because the 1.8 multiplier used by Webber et al. falls below both the ∼2.0 ratio of the Bailey (1964) to Webber et al. (1963) peak >10 MeV fluxes for this event and the 2.3 ratio of the solar cycle 19 F30 value from Reedy (2012) to that of Webber et al. (1963). As can be seen in Figure 3, the red point corresponding to the revised F30 value of ∼8 × 10¹⁰ pr cm−2 for 775 falls outside the 90% confidence interval (Gehrels 1986) of the occurrence probability distribution function (OPDF) recently constructed by Kovaltsov & Usoskin (2014) for >30 MeV SPEs. This OPDF is based on direct satellite measurements of SPEs during the space age, measurements of sharp increases of 14C and 10Be concentration in tree rings and ice cores during the last 11,400 yr, and cosmogenic nuclides in lunar rocks during the last half-million years.

Figure 3. OPDF for >30 MeV SEP events with the red point for the revised estimate of the 775 event added (adapted from Kovaltsov & Usoskin 2014, with permission of Solar Physics).
Download figure:
Standard image High-resolution image2.2. Solar Circumstances for the 1956 February 23 GLE-associated Flare
Figure 4 shows the sunspot drawing from Sacramento Peak Observatory for 1956 February 17, when Greenwich active region 17351 was near disk center (N22W02) with a corrected (for foreshortening) spot area of 1393 millionths of a solar hemisphere (msh). It was part of a noteworthy string of six active regions spanning ∼60º of heliolatitude at ∼N20 with a combined area of 3809 msh. The GLE-associated flare from region 17351 on February 23 (N23W80) had its Hα maximum (class 3) at 03:42 UT. The sunspot number (SSN) for February 23 was 177. The 1956 SPE occurred during solar cycle 19, the largest cycle (peak 13 month smoothed SSN of 201.3) since sunspot recording began in 1610. Cycle 19 occurred during the strongest ∼50 yr interval of solar activity (∼1945–1995) in the last ∼2000 yr (Usoskin et al. 2007).
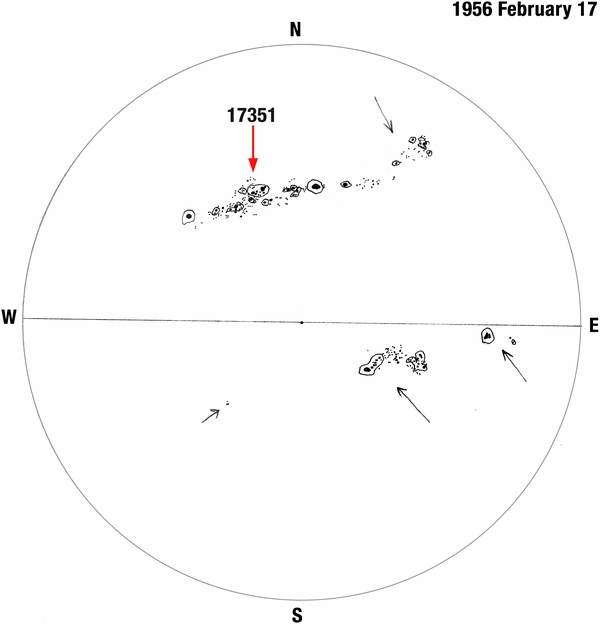
Figure 4. Sunspot drawing for 1956 February 17 showing the source region (Greenwich 17351; red arrow) of the 1956 February GLE.
Download figure:
Standard image High-resolution imageIn contrast to the 1956 SPE, the cosmogenic nuclide event of 775 occurred during a period of inferred low solar activity. Figure 5, adapted from Usoskin et al. (2007), contains a smoothed decadal record of solar activity based on 14C concentration in tree rings for the last 6000 yr. The interval, indicated by a black oval, in which the 775 event occurred has a peak 14C-based-SSN of only about 25 compared to ∼70 for the epoch in which the 1956 SPE occurred (red oval). While recent re-analysis of the SSN (Cliver et al. 2013) indicates that the reconstructed SSN in this figure is understated by ∼50% before ∼1885, the relatively quiet characterization of the period ca. 775 still applies. It has been suggested (McCracken et al. 2004) that large SPEs might occur preferentially during periods of low solar activity but the nitrate-in-ice-cores proxy for SPEs on which this picture was based has recently been invalidated by Wolff et al. (2012).
Usoskin et al. (2013) noted that the 775 event was accompanied by a cluster of low-latitude aurora reported from Shanxi Province, China, in 770 (twice), 773, and 775 based on the compilations of Keimatsu (1973) and Yau et al. (1995). Of these four events, Yau et al. (1995), who expunged many unreliable records of aurora given in the Keimatsu catalog, only list the two 770 events. From a recent re-examination of Keimatsu (1973), F. R. Stephenson (2013, private communication) notes that for the two 770 events, there is no mention that the phenomenon occurred at night, making it doubtful whether aurora are being referred to. He suggests, however, that a report of "more than 10 bands of white vapor" on January 12 776 may be auroral in nature. In either case, the evidence for a grouping of strong auroral activity ca. 775 is weakened.
2.3. Historical Cases of Large >30 MeV Fluence SPEs
During the satellite era, the largest F30 events have been produced by sequences of eruptive flares originating near solar central meridian (Smart et al. 2006; Cliver & Dietrich 2013). Prominent examples of such sequences occurred in 1972 August (5.0 × 10⁹ pr cm−2; Shea & Smart 1990) and 1989 October (4.3 × 10⁹). Both of these episodes exhibited a strong shock spike in their F30 time–intensity profile. Table 1 gives various F30 values for similar composite events in cycle 19: 1959 July and 1960 November. In addition to the initial Webber et al. (1963) F30 value, there are values that were: (1) obtained by scaling up the Webber et al. values by the ratios of the peak >10 MeV proton fluxes reported by Bailey (1964) and Webber et al. (1963), (2) scaled up from the Webber et al. (1963) values by the factor of 2.3 based on the analysis of cosmogenic nuclides in lunar rocks (Reedy 2012), and (3) determined by Webber et al. (2007). From (1)–(3) we take average values of ∼7 × 10⁹ pr cm−2 and ∼5 × 10⁹ pr cm−2 for 1959 July and 1960 November, respectively. Since the time resolution of tree ring records is 1 yr, we considered the strong activity from 1989 August–October, including five GLEs, as a single event to obtain a worst case scenario in modern times. The F30 for the 3 month interval from 1989 August 12 to November 10 was 7.2 × 10⁹ pr cm−2. Thus a F30 = ∼8 × 10¹⁰ pr cm−2 event for 775 a.d., based on a 45 times multiple of the updated (Webber et al. 2007) F30 value for the 1956 event, would be ∼10 times larger than any event of the modern era.
Table 1. Estimates of F30 for Large Composite Events During Cycle 19
| Date | Webber et al. (1963) | Riometer (Scaled) | Lunar Rock (Scaled) | Webber et al. (2007) | Average Value |
|---|---|---|---|---|---|
| 1959 Jul | 3.2a | 9.0 | 7.4 | 4.0 | ∼7 |
| 1960 Nov | 2.1 | 4.3 | 4.8 | 6.0 | ∼5 |
Note. aUnits for all values are 109 pr cm−2.
Download table as: ASCIITypeset image
2.4. Energy Requirements for a Solar Flare and Active Region in 775 a.d.
Cliver & Dietrich (2013) obtained relationships, with broad scatter, between (1) F30 and 1–8 Å soft X-ray (SXR) fluence and (2) flare bolometric energy and SXR fluence, that give a best guess estimate of total energy of ∼9 × 1033 erg for a 775 flare versus ∼2 × 1033 erg for the Carrington event. This estimate is based on the F30 value of ∼8 × 10¹⁰ pr cm−2 for the 775 event and the flare energy-partition work of Emslie et al. (2012) who found that, on average, mass ejection kinetic energy = ∼3 times flare bolometric energy. From Figure 5 in Veronig et al. (2002) which relates SXR fluence to intensity, we infer a flare classification of ∼X230 (versus ∼X45 for the 1859 event). Corresponding values for the 2003 November 4 flare are ∼1033 erg and ∼X35 (Emslie et al. 2012; Cliver & Dietrich 2013). Emslie et al. (2012) estimated a free magnetic energy of 2.9 × 1033 erg for NOAA region 486 (2610 msh on 2003 October 29). Scaling linearly by sunspot area (assuming an energy conversion efficiency of ∼0.5; Emslie et al. 2012) implies an active region for the 775 event with area of ∼16,000 msh, ∼2.5 times the size of the largest region yet recorded (6132 msh on 1947 April 8).
3. SUMMARY AND DISCUSSION
The inferred specifications for a 775 SPE, associated eruptive flare, and source active region are: (1) a multiple of ∼45 times the intense hard spectrum of the 1956 February 23 SPE (Usoskin et al. 2013); (2) a >30 MeV proton fluence of ∼8 × 10¹⁰ pr cm−2 (∼10 times larger than that for the strongest 3 month interval of activity during the modern era (1989 August–October)); (3) a best guess SXR class of ∼X230 with total energy ∼9 × 1033 erg (∼4–5 times the energy estimate for the Carrington event and ∼9 times 2003 November 4); and (4) an active region with sunspot area of ∼16,000 msh, ∼2.5 times that of 1947 April). The 14C-based smoothed SSN ca. 775 had a peak amplitude about half that of the ∼1945–1995 interval.
The high multiple of the 1956 February spectrum required to produce the 775 14C event presents a challenge for the attribution of 775 to a solar source. The 1956 February GLE is the strongest yet recorded. It occurred during the most active period of the last ∼2000 yr while 775 fell during a period of relatively low solar activity. Given the revised F30 value for 1956 (Webber et al. 2007), the point for 775 falls outside the >30 MeV OPDF of Kovaltsov & Usoskin (2014). The 775 F30 value might be reduced by a streaming limit (Reames 2013), but such a reduction can be offset/negated by contributions from delayed shock spikes and/or closely spaced SPEs (Cliver & Dietrich 2013). The recent discovery of a second large 14C event in 993 makes a solar source for 775 more attractive—and prospects for a more exotic source such as a short-duration gamma-ray burst (Hambaryan & Neuhäuser 2013) less likely (Miyake et al. 2013). That said, solar conditions in 993 a.d., on the cusp of a grand minimum (Figure 5), were less promising than those of 775. On balance, it seems pre-mature to rule out a non-solar source for 775. As pointed out by Miyake et al. (2013), analysis of more high-time-resolution cosmogenic nuclide data is needed.

Figure 5. 14C-based decadal-smoothed SSN for the last 6000 yr (adapted from Usoskin et al. 2007, with permission of Astronomy & Astrophysics). Intervals of low solar activity ca. 775 and high activity ca. 1956 are indicated by black and red ovals, respectively. The solid blue (red) line delineates grand minima (maxima).
Download figure:
Standard image High-resolution image
E.W.C. thanks Karel Schrijver and Jürg Beer for organizing three ISSI workshops on Extreme Solar Events and acknowledges support from AFOSR. We thank Ilya Usoskin for helpful comments.