


ABSTRACT
The rising luminosity of the recent, nearby supernova 2011fe shows a quadratic dependence with time during the first ≈0.5–4 days. In addition, studies of the composite light curves formed from stacking together many Type Ia supernovae (SNe Ia) have found similar power-law indices for the rise, but may also show some dispersion that may indicate diversity. I explore what range of power-law rises are possible due to the presence of radioactive material near the surface of the exploding white dwarf (WD). I summarize what constraints such a model places on the structure of the progenitor and the distribution and velocity of ejecta. My main conclusion is that for the inferred explosion time for SN 2011fe, its rise requires an increasing mass fraction X56 ≈ (4–6) × 10−2 of 56Ni distributed between a depth of ≈10−2 and 0.3 M☉ below the WD's surface. Radioactive elements this shallow are not found in simulations of a single C/O detonation. Scenarios that may produce this material include helium-shell burning during a double-detonation ignition, a gravitationally confined detonation, and a subset of deflagration to detonation transition models. In general, the power-law rise can differ from quadratic depending on the details of the velocity, density, and radioactive deposition gradients in a given event. Therefore, comparisons of this work with observed bolometric rises of SNe Ia would place strong constraints on the properties of the shallow outer layers, providing important clues for identifying the elusive progenitors of SNe Ia.
Export citation and abstract BibTeX RIS
1. INTRODUCTION
The use of Type Ia supernovae (SNe Ia) as cosmological distance indicators (Riess et al. 1998; Perlmutter et al. 1999) has brought attention to the theoretical uncertainties that remain about these events. It is generally accepted that these SNe result from unstable thermonuclear ignition of degenerate matter (Hoyle & Fowler 1960) in a C/O white dwarf (WD), but frustratingly the specific progenitor systems have not yet been identified. The main three candidates are (1) stable accretion from a non-degenerate binary companion until the Chandrasekhar limit is reached (Whelan & Iben 1973), (2) the merging of two C/O WDs (Iben & Tutukov 1984; Webbink 1984), or (3) accreting and detonating a helium shell on a C/O WD that leads to a prompt detonation of the core (Woosley & Weaver 1994a; Livne & Arnett 1995). A variation on the latter case is ignition triggered by a detonation in an accretion stream (Guillochon et al. 2010; Dan et al. 2012). In addition, it is not known whether the incineration itself proceeds as a sub-sonic deflagration (Nomoto et al. 1976; Nomoto et al. 1984) or deflagration-detonation transition (DDT; Khokhlov 1991; Woosley & Weaver 1994b). Single detonations of a sub-Chandrasekhar WD have been shown to reproduce many features of SNe Ia (Sim et al. 2010), but it is not clear how to ignite these cores without first detonating a helium shell. Each combination of situations has different implications for the velocity and density structure of the exploding WD, as well as the distribution of ashes.
A potentially powerful method for constraining between these models are comparisons with the early-time behavior of SNe Ia, since this is when the surface layers of the WD are being probed by the observed emission. The recent, nearby SN 2011fe is especially useful in this regard, since it was detected just ≈11 hr post-explosion when the luminosity was merely ∼10−3 of that at peak (Nugent et al. 2011). Furthermore, upper limits on the luminosity were placed ≈4 hr post-explosion (Bloom et al. 2012). An interesting feature of the rise is a t2 dependence for the luminosity up to ≈5 days post-explosion. Furthermore, there was no sign of the cooling of shock-heated surface layers (Piro et al. 2010; Rabinak et al. 2012) nor interaction with a companion (Kasen 2010). This puts tight constraints on the progenitor radius of ≲ 0.02 R☉ (Bloom et al. 2012), demonstrating that it was very compact and consistent with a WD. Other individual SNe Ia have not been studied in the same detail as SN 2011fe, but studies of the composite light curves formed from stacking many supernovae show power-law indices of 1.8 ± 0.2 (Conley et al. 2006), 1.8+0.23− 0.18 (Hayden et al. 2010), and 2.20+0.27− 0.19 (Ganeshalingam et al. 2011). Although these are all roughly quadratic, they may instead indicate some diversity in the rise.
A t2 dependence is consistent with a model in which the effective temperature remains fixed while the radius increases with time at constant velocity (Riess et al. 1999). This seems unlikely to hold for a real supernova, since the effective temperature and photospheric radius can potentially change as the ejecta expands and its density drops. In the Supplementary Information of Nugent et al. (2011), a single-zone model is described (using arguments similar to that in Arnett 1982), estimating the luminosity from expanding ejecta that is heated by 56Ni decay. For a explosion energy Esn and total stellar mass M*, one can define a characteristic velocity of V = (2 Esn/M*)1/2. Using a constant opacity κ, this gives a luminosity of
where c is the speed of light, X56 is the 56Ni mass fraction, and  56 = 3.9 × 10¹⁰ erg g−1 s−1 is the radioactive heating rate per unit mass. This result demonstrates that radioactive heating can in principle also provide a t2 dependence. What this single-zone model cannot answer is what is the required depth of the radioactive material. In addition, the power-law dependence on time may change depending on gradients in density, velocity, and distribution of radioactive isotopes.
In the following work, I generalize this single-zone model to a one-dimensional calculation that includes the above-mentioned complications. In Section 2, I summarize the main equations used to describe the dynamics and thermodynamics of the heated, expanding ejecta. In Section 3, I discuss the time-evolving energy density of the expanding layers, and show when heating from radioactive decay dominates over the shock heating that has been the focus of previous work (Piro et al. 2010; Rabinak et al. 2012). I also explore the depth of the thermal diffusion wave as the surface layers expand, which shows the depth in the WD that the early light curve is probing as a function of time. In Section 4, I calculate the time-dependent luminosity, and explore what range of power-law scalings are expected for the rise. In Section 5, I compare these calculations with the observations of SN 2011fe to constrain the distribution and amount of radioactive material. Finally, in Section 6, I summarize my results and discuss what detailed modeling can do for the understanding of the outer ejecta of SNe Ia.
2. DYNAMICS AND THERMODYNAMICS OF THE EXPANDING STAR
For this study I concentrate on the plane-parallel surface layers of the exploding progenitor star. This does not mean the expansion itself is plane-parallel, but merely that all the ejecta originates from roughly the same radius. This simplification is an accurate representation of the outer material on a WD. In the Appendix, I summarize the scalings for a non-plane-parallel treatment.
Variables of the pre-expanded progenitor star are denoted with the subscript 0. The profile is assumed to be a polytrope, with

where in the case of non-relativistic electrons n = 3/2 and K = 9.91 × 10¹²μ−5/3e, and for relativistic electrons n = 3 and K = 1.23 × 10¹⁵μ−4/3e, where μe is the molecular weight per electron and K is in cgs units. For a constant flux, ideal-gas-dominated, plane-parallel atmosphere n = 3 and K = 6.1 × 10¹³ g−1/39Teff, 54/3, where g = 109g9 cm s−2 is the surface gravity and Teff = 105 Teff, 5 K is the effective temperature of the photosphere (Piro et al. 2010). Depending on the progenitor model, or heating from sub-sonic burning during the explosion, a higher Teff may be a more realistic choice (Rabinak et al. 2012). Throughout my derivations K is kept as a free variable so that the impact of changes in this parameter can be seen explicitly.
For a typical Chandrasekhar-mass progenitor, n = 3/2 is most relevant since at ≈0.5 day post-explosion (when SN 2011fe was first observed), the diffusion wave is at a depth where the progenitor star equation of state is set by non-relativistic electrons. Nevertheless, I keep the polytropic index as a free variable since it can vary in other situations. For example, if the WD was ignited from a detonating helium shell, the layer may have a convective profile instead (Bildsten et al. 2007; Shen & Bildsten 2009; Woosley & Kasen 2011; Shen et al. 2011).
The velocity of the shock has a gradient with density, which rises toward the surface according to (Matzner & McKee 1999),
where R* is the WD radius and β = 0.19 for a radiation-pressure-dominated shock (Sakurai 1960). I keep β as a free parameter, so that my results are general with respect to velocity gradients that are from non-shock sources. In addition, β may vary due to energy deposition or the arrival of the thermal wave, which can accelerate the layers (Pinto & Eastman 2000b). Typical values for Equation (3) are Esn ≈ 1051 erg and the mass and radius of a WD near the Chandrasekhar limit, but it may also be worth considering a lower mass WD in light of the pure detonation simulations of sub-Chandrasekhar explosion models (Sim et al. 2010). In Piro et al. (2010), we focused on the shock from a DDT, and wrote the velocity gradient as

where V' and ρ' are set by where the detonation fails and a shock runs away, heating the surface of the star. Throughout this work I quote analytic results in terms of ρ' and V' since it gives the cleanest solutions (as was done in Piro et al. 2010). But, for the numerical factors, I substitute ρ' = M*/R3* and V' = 0.79 (Esn/M*)1/2, since using Esn and M* makes it easier to compare with other theoretical work and observations.
In this framework, one can think of the surface layers as a series of shells, each labeled with an initial density ρ0 and moving with a final velocity of V(ρ0) ≈ 2 Vs(ρ0) (this factor of two is the effect of pressure gradients causing acceleration; Matzner & McKee 1999). For a plane-parallel configuration, mass conservation as the shell expands gives
where H0 = P0/ρ0g = Kρ1/n0/g is the thickness of the layer, which I set to be the pressure scale height, and the velocity gradient of the layer is
This expression is found by using the equation of hydrostatic balance, dP0/dr0 = −ρ0g, and Equation (2). Thus, ΔV(ρ0) is smaller than V(ρ0) by a constant factor of β/(1 + 1/n) ≈ 0.11 (for n = 3/2 and β = 0.19).
The thermal evolution of the expanding layer is set by the first law of thermodynamics,
where s is the specific entropy, U is the energy density, and the right-hand side comes from assuming a radiation-dominated energy density, so that P = U/3. Changes in entropy come from nuclear heating and radiative losses, so this can be rewritten as
where t56 = 8.764 days is the lifetime of 56Ni, and the partial derivatives in time are evaluated at a fixed mass shell, labeled by ρ0. I assume that the 56Ni can potentially vary with depth, which is modeled with a characteristic density ρ56 and a power-law index χ. Such a power-law choice is not physically motivated, but is made simply to allow the deposition to vary, while still resulting in self-similar solutions. In future studies I will consider a more general distribution of 56Ni, which will require solving this equation numerically instead.
It is also possible that other radioactive isotopes could be present and be powering the early-time light curve. In particular, 48Cr has a 31.11 hr lifetime with nearly 100% electron captures to the 1+ excited state of 48V, which is followed by a cascade that emits an energy of 0.42 MeV. The 48V has a 23.045 day lifetime, and an effective energy deposition of 2.874 MeV. Therefore, the first step deposits ≈7.5 × 10¹⁰ erg g−1 s−1, and the second step deposits ≈2.9 × 10¹⁰ erg g−1 s−1. These are not too different than 56, but may introduce some qualitative changes. The radioactive isotope 52Fe may also be present, but its short lifetime of 11.939 hr means that it is only important at the earliest times. For the main analysis of the paper, I concentrate on 56Ni since it is typically the most important radioactive isotope for SNe Ia. But one should keep in mind that the radioactive heating factor can in principle be due to a more complicated mixture of isotopes.
The derivative ∂L/∂Mr is the radiative cooling rate per unit mass, where
Throughout my main analysis I assume that κ is independent of density and temperature, such as for an electron scattering opacity. This is roughly accurate for the hot surface layers, but in the Appendix I summarize the self-similar scalings that result from a more general opacity law.
3. ENERGY DENSITY AND DIFFUSION DEPTH
Using the framework summarized in the previous section, one can in principle solve Equation (8) for U(ρ0, t). This provides the entire dynamic and thermodynamic evolution of each mass shell (labeled by ρ0) as a function of time. For the present work I am focused on the early light curve (≈0.5–4 days post-explosion) in the limit where heating from 56Ni decay dominates. The strategy is then to ignore the term ∂L/∂Mr in Equation (8), which is a reasonable assumption when the light curve is still rising (also see Arnett 1982; Pinto & Eastman 2000a). Once this approximation is made, Equation (5) can be substituted for ρ and the left-hand side of Equation (8) can be further simplified using the equality
Integration of Equation (8) then yields
where there is a factor of 1/8 from V ≈ 2 Vs.
This solution for U implicitly assumes that the energy density deposited by the passing shock wave, which was the main source of heating considered by Piro et al. (2010) and Rabinak et al. (2012), is negligible. To show that this is a reasonable approximation, consider a shock traversing a density ρ0. The energy density deposited by that shock is
This energy density then adiabatically decreases as the layer expands, giving
where γ = 4/3 is the adiabatic exponent for radiation-dominated material and ρsh = ρ0(γ + 1)/(γ − 1) = 7 ρ0 is the compressed, shocked density. Since Ush∝t−4 (from Equation (13)) while U∝t−2 (from Equation (11), after approximating t/t56 ≪ 1 as discussed in Section 4), the shock energy density falls off much faster and is quickly negligible in comparison to the radioactive heating. I compare the two energy densities in Figure 1 at three different snap-shots in time. This shows that the radioactive heating dominates at ≈1 day unless X56 ≲ 10−3.
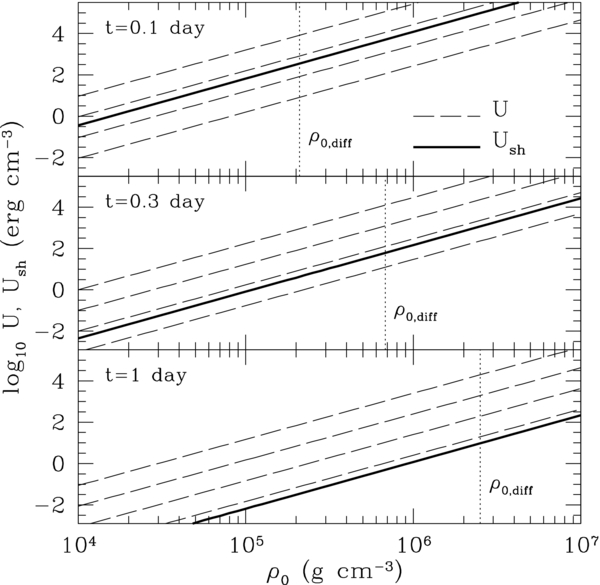
Figure 1. Comparison of the energy density due to radioactive decay given by Equation (11) (dashed lines) for X56 = 10−3, 10−2, 10−1, and 1.0 (from bottom to top in each panel) with the energy density from shock passage given by Equation (13) (thick, solid lines). The supernova parameters are Esn = 1051 erg, M* = 1.4 M☉, and R* = 3 × 108 cm. The vertical dotted lines show the depth of the thermal diffusion wave at each time (Equation (16)). Radioactive decay dominates the energy budget for X56 ≳ 10−1 at 2.4 hr after shock breakout and for X56 ≳ 10−2 at 7.2 hr.
Download figure:
Standard image High-resolution imageAlso plotted in Figure 1 is the depth of the thermal diffusion wave as the surface layers expand and cool (vertical dotted lines). The timescale for a given layer to cool is
By substituting Equation (5) into Equation (14) and setting tdiff = t, I solve for the diffusion depth as a function of time,
For n = 3/2, β = 0.19, and using the equation of state for non-relativistic electrons, this gives
where κ0.2 = κ/0.2 cm2 g−1, E51 = Esn/1051 erg, M1.4 = M*/1.4 M☉, R8.5 = R*/3 × 108 cm, and tday = t/1 day. This density is roughly consistent with what one would expect for material dominated by non-relativistic electrons. To highlight the depth in the WD this corresponds to, I estimate the diffusion mass as Mdiff ≈ 4 πR2*ρ0, diffH0(ρ0, diff), so that

The most striking feature of these results is that 56Ni must be present very close to the surface at ≈1 day post-explosion. The earliest detection of SN 2011fe is at ≈11 hr (assuming a t2 rise), which would require 56Ni at a depth of merely ≈10−2 M☉. Although the dependence of Mdiff on the equation of state prefactor K is not shown explicitly, it merely has a power-law scaling of β/(1 + 1/n + β) ≈ 0.1. This is a much weaker dependence than any of the other scalings in Equation (17), so although a larger K can in principle increase the inferred diffusion depth at a given time, this change is not expected to be large.
In Figure 2, I plot the depth of the diffusion wave below the WD surface as a function of time using Equation (17). The filled circles indicate the time of the PTF observations (Nugent et al. 2011). Since the time of the explosion of SN 2011fe is not exactly known, I assume it is 55796.687 MJD, which was derived assuming a t2 rise (Bloom et al. 2012). The time of the upper limit reported by Bloom et al. (2012) is plotted as an open circle.
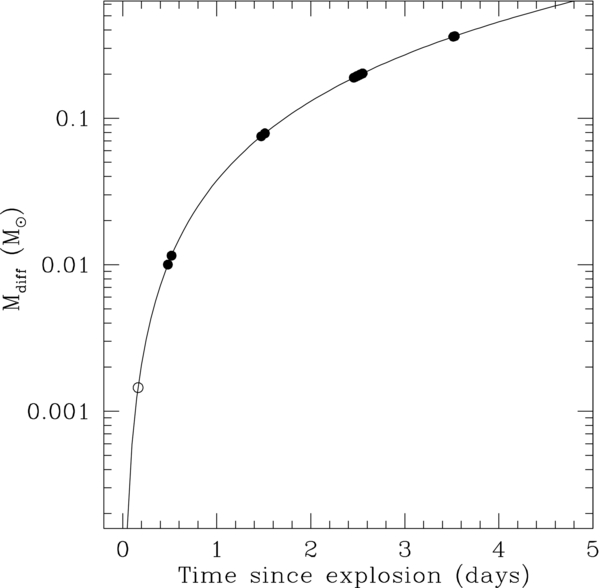
Figure 2. Solid line marks the position of the thermal diffusion wave as a the surface layers expand using Equation (17). This shows the depth in the WD from which the luminosity is originating as a function of time. Along the solid line I have plotted filled circles at the time of the PTF observations (Nugent et al. 2011) and an open circle showing the time of an upper limit constraint (Bloom et al. 2012).
Download figure:
Standard image High-resolution imageThe minimum helium shell masses needed for a surface detonation are in the range of ≈3.5 × 10⁻³–0.13 M☉ (Shen & Bildsten 2009; Fink et al. 2010), similar to the range of diffusion depths shown in Figure 2. Such surface helium burning can ignite the core and create a double-detonation ignition. This comparison between the shell masses and the depth of the diffusion wave in SN 2011fe indicates that a double-detonation ignition may provide radioactive ashes at the correct depth needed for powering the early-time rise. I further discuss the double-detonation scenario along with other SNe Ia progenitor models in Section 6.
4. RISING LUMINOSITY
I next estimate the luminosity expected from a radioactively dominated rising supernova, which will allow constraints to be placed on the amount and gradient of 56N near the WD surface. Combining Equations (9) and (11), the luminosity from a given shell is
From this result, a number of important features can be identified. For t/t56 ≲ 1 the bracketed term can be approximated,
In the limit that χ and β are small, all dependencies on ρ0 are negligible, so that L ∼ cV't256/κ. This is the same scaling as found for the single-zone result given by Equation (1).
To derive the luminosity as a function of time I substitute ρ0, diff(t) from Equation (15) in for ρ0 in Equation (18),
Using Equation (19) to simplify the exponential, the power-law scaling for the luminosity is

which in the limit β ≈ χ ≈ 0, again results in L∝t2. As the gradient in Vs becomes larger and β increases, the power law decreases below 2. Conversely, a larger deposition index χ can increase the power law, since this means that more 56Ni is being probed as the diffusion wave moves deeper.
For the case of n = 3/2, β = 0.19, χ = 0, and t ≲ t56, the rising luminosity is
For SN 2011fe, a luminosity of ≈1040 erg s−1 is seen at ≈11 hr (Nugent et al. 2011). From the estimates given here, this requires a mass fraction of X56 ∼ 2 × 10⁻² (although in the next section I make a more quantitative comparison to the observations). Such an amount of 56Ni is consistent with the energy density of the plasma being dominated by radioactive decay as discussed in Figure 1. Increasing the equation of state prefactor K would increase the diffusion mass, but only by a small amount since L∝MdiffX56 and Mdiff∝Kβ/(1 + 1/n + β).
For the fiducial model given by Equation (22), the rising luminosity scales like t1.8 and not t2. This is inconsistent with the power-law index of 2.01 ± 0.01 found by (Nugent et al. 2011), but within the measurements of a broader range of SNe Ia (Conley et al. 2006). This then begs the question, is an index of 2 universal across all SNe Ia, or can the power law vary around 2 depending on the gradients in velocity and radioactive heating for a given particular event? The work here argues via Equation (21) that a range of power laws are possible depending on the particular properties of the outermost layers of a given event. The study by Tanaka et al. (2008) finds a wide range of 56Ni abundances in the outer ejecta, which support the fact that there should be some diversity. The fact that the best studied SN Ia shows an index very close to 2 may be evidence that it is universal, but remember that the PTF data is in g band. A detailed comparison with the bolometric rises of SNe Ia is necessary to understand how diverse the power laws can actually be.
If the bolometric luminosity does indeed follow a simple t2 scaling, then the 56Ni deposition must obey χ ≈ β. This cancels out the dependencies due to the position of the thermal diffusion wave (essentially the first bracketed term in Equation (20) is set to 1), giving the simple dependencies that can be derived from a single-zone analysis,

where it is now understood that  is the mass fraction of 56Ni at ρ0 = 106 g cm−3, which corresponds to the depth of the diffusion wave at ≈10 hr (Equation (16)).
5. COMPARISONS TO SN 2011fe
The effective temperature of the supernova during early times may be complicated due to an opacity that depends on a mix of heavy elements. With this caveat in mind, I estimate the effective temperature assuming a constant, electron-scattering opacity. The effective temperature is

where T = (U/a)1/4 is the local temperature and τ ≈ κρΔr is the optical depth, resulting in
Evaluating this at the diffusion depth provides an estimate for the time evolution of the effective temperature. For n = 3/2, β = 0.19, and χ = 0,

This shows that the radioactive heating balances the expansion to give an effective temperature that is nearly constant with time.
The photospheric radius rph of the expanding ejecta can be estimated with the relationship L = 4 πr2phσSBT4eff, where σSB is the Stefan–Boltzmann constant. When the diffusion wave is at ρ0, the photospheric radius is therefore
which for n = 3/2, β = 0.19, and χ = 0, and using Equation (16), results in

Another important property of these models is the photospheric velocity as a function of time Vph = rph/t, which has a power-law dependence of

The photospheric velocity decreases with time as the photosphere backs its way through the expanding ejecta (for example, for β = 0.19 and n = 3/2, Vph∝t−0.20). A direct comparison of Vph with observations is difficult because specific spectral lines may have an opacity that differs from the constant value I use here. Nevertheless, this shows that qualitative, time-dependent changes in the measured velocities can be used to constrain the velocity gradient of the ejecta.
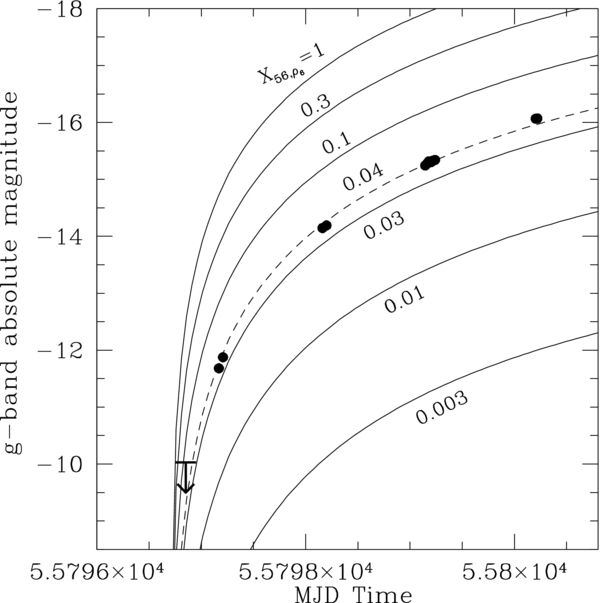
Using the photospheric radius and assuming blackbody emission with effective temperature given by Equation (25), I calculate the g-band absolute magnitude. In Figure 3, I plot the specific example of no 56Ni deposition gradient (χ = 0). The solid circles are the observations summarized by Nugent et al. (2011), along with an arrow indicating the upper limit from Bloom et al. (2012). For this comparison, a choice of explosion time is necessary, for which I use 55796.6 MJD. This is not meant to maximize the fit between theory and data, but merely to provide a useful comparison. Although X56 ≈ 3 × 10⁻² appears closest to the data, this model overpredicts the early light curve and underpredicts the late light curve, indicating that a gradient in 56Ni deposition is needed to make a better match.
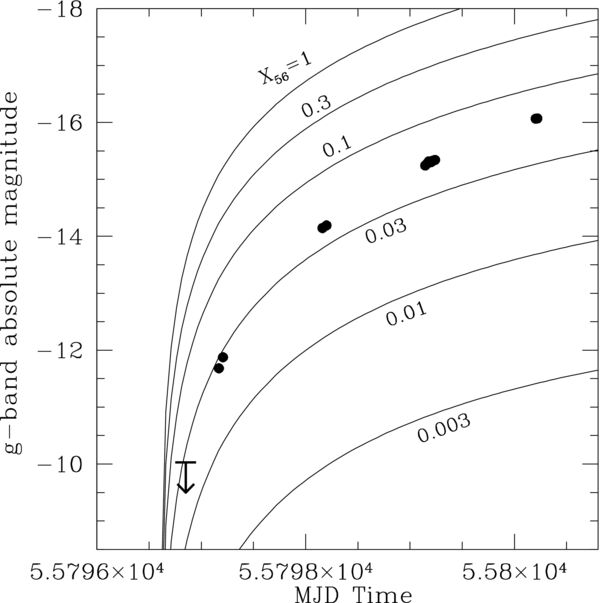
Figure 3. Rising light curve for a model with β = 0.19, n = 3/2, χ = 0, Esn = 1051 erg, M* = 1.4 M☉, and R* = 3 × 108 cm. The 56Ni is varied from X56 = 3 × 10⁻³ to 1, as labeled on each curve. Although X56 ≈ 3 × 10⁻² is favored, this model with a constant distribution of 56Ni overpredicts the early light curve and underpredicts the late light curve. This indicates that a gradient in 56Ni deposition is needed.
Download figure:
Standard image High-resolution imageMotivated by this discrepancy between the observed light curve and that predicted for a constant distribution of 56Ni, I instead consider the case χ = β = 0.19, which was found to give a t2 bolometric luminosity (Equation (23)). The corresponding effective temperature is
where again I emphasize that  is the mass fraction of 56Ni at a depth of ρ0 = 106 g cm−3. The difference between Equations (26) and (30) may not seem appreciable, but remember that L∝T4eff, so small changes in exponents can make important differences. The photospheric radius is essentially unchanged from Equation (28), with only a small difference in the prefactor.
The resulting light curves for the χ = 0.19 model are plotted in Figure 4, which demonstrates a better fit to the data. The gradient in 56Ni implies that X56 ≈ 4 × 10⁻² at a depth of Mdiff ≈ 10−2 M☉ and this varies up to X56 ≈ 6 × 10⁻² at a depth of Mdiff ≈ 0.3 M☉. The total integrated mass of radioactive material needed to produce the light curve over ≈4 days is roughly ≈2 × 10⁻² M☉.
Figure 4. Same as Figure 3, but with a 56Ni gradient set to χ = β = 0.19 instead. This value of χ was not chosen to maximize the fit, but merely to show that a rising 56Ni deposition is favored by the data. The model with  (denoted with a dashed line) provides a reasonable fit to the observed light curve.
Download figure:
Standard image High-resolution image
6. CONCLUSIONS AND DISCUSSION
I investigated the impact of radioactive heating on the early-time rise of SN Ia light curves. A mass fraction X56 ≈ (4–6) × 10−2 of 56Ni at a depth ≈10−2–0.3 M☉ from the progenitor surface is needed to produce the luminosity seen from SN 2011fe during its first ≈4 days. This conclusion is based on using an explosion time that is not too far from that estimated in the observations, an assumption that will be further explored in future work. A model in which there is a velocity gradient set by the passage of a shock, but with a constant deposition of radioactive material, gives a t1.8 power law. This appears to be inconsistent with SN 2011fe, but is not ruled out by other studies of the rise of SNe Ia (Conley et al. 2006; Hayden et al. 2010; Ganeshalingam et al. 2011). The shape of the SN 2011fe light curve is better fit when the gradients in velocity and radioactive material are similar, with χ ≈ β, as is shown in Figure 4. In the future, a comparison between the bolometric rising luminosity of SN 2011fe and this work using Equation (20) would provide important constraints on the distribution of radioactive material near the WD surface.
A crucial question for future observations is whether the rise of SNe Ia obey a universal power-law or if they vary from event to event. My work shows that the rise should depend on the particular gradients in velocity, density, and deposition of radioactive elements, which, although it may be close to t2, should not necessarily always be the same. If the power law is indeed found to be universal, this would argue that different physics than what I am exploring here is determining the rise. For example, an opacity effect that I have not included could enforce a fixed Teff and constant expansion velocity, or perhaps the heating it coming from much deeper in the ejecta but the explosion time is further in the past from that inferred.
The total integrated mass of radioactive material needed to produce the SN 2011fe light curve over ≈4 days is ≈2 × 10⁻² M☉. Single detonation models of Chandrasekhar and even sub-Chandrasekhar-mass WDs find distributions of ashes that are fairly well-stratified, and do not show 56Ni or 48Cr near the surface. This is perhaps not that limiting of a constraint; Chandrasekhar-mass single detonations are disfavored because they cannot produce the observed intermediate mass elements (Filippenko 1997), and although sub-Chandrasekhar single detonations match the nucleosynthesis generally seen from SNe Ia (Sim et al. 2010), it is not known how to ignite such an object without a helium shell.
Conversely, the explosive ignition of a helium shell in the double-detonation scenario can produce shallow radioactive material. The diffusion depths in Figure 2 are similar to the minimum helium shell masses needed for detonation (Shen & Bildsten 2009; Fink et al. 2010). The total amount of radioactive material needed is also qualitatively similar to the nucleosynthesis of such events (Fink et al. 2010). DDT models can produce 56Ni near the WD surface, for example in the DDT models of Iwamoto et al. (1999), but to get radioactive material at a depth of ≈10−2 M☉ from the surface may require a strongly mixed, off-center deflagration (Maeda et al. 2010). In DDT models with many ignition points that have fairly stratified ashes, radioactive elements are not present near the surface. A gravitationally confined detonation is in a sense just a more extreme, off-center version of the DDT models, and it too produces iron-peak elements near the surface when a bubble unstably rises and breaks at the top (Meakin et al. 2009). Finally, a more speculative idea is that some radioactive elements are synthesized near the surface by g-mode heating during the pre-explosive convective phase (Piro 2011). Nugent et al. (2011) report the presence of O, Mg, Si, S, Ca, and Fe in the spectra of SN 2011fe at early times. Many of these elements are potential ashes from the scenarios described above, and a detailed comparison may help discriminate between them.
Even though this work explores the presence of radioactive material near the surface of the WD, a potential problem is that if the abundance of iron-peak elements is too high, they tend to produce colors that are too red and spectra that are inconsistent with normal SNe Ia (Kromer et al. 2010; Sim et al. 2012). Although it should be noted that this difficulty may be partially alleviated for larger mass WDs that have smaller helium shells, and may also depend on careful consideration of the burning in the helium shell (Woosley & Kasen 2011). Another important constraint comes from the identification of SN 2011fe as being a member of the blue group of SNe Ia, which show enhanced carbon abundances and low iron in the outer layers of the ejecta (Milne & Brown 2012; Silverman & Filippenko 2012). Combining detailed modeling of the early light curve rise with comparisons to the peak colors and spectra provides competing limits on the mass fraction of iron-peak elements, and therefore together should result in tight constraints on the composition of the outer layers and the associated progenitors of these explosions.
I thank the referee for detailed comments and suggestions. I also thank Lars Bildsten, Luc Dessart, Dan Kasen, Peter Goldreich, Christian Ott, Ken Shen, and Stan Woosley for helpful comments and discussions. This work was supported through NSF grant AST-0855535 and by the Sherman Fairchild Foundation.
APPENDIX: GENERAL SELF-SIMILAR RISING LUMINOSITY SOLUTIONS
Here I consider a wider range of self-similar solutions for the rising luminosity. This highlights possible changes in the time dependence from various physical effects. In all cases, the exponential from radioactive heating is simplified using Equation (19).
A.1. General Opacity Law
For the majority of this work I have assumed a constant opacity, consistent with electron scattering. To make better comparisons with observations will require complete calculation with detailed opacities. If helium is present near the WD surface (such as in the double-detonation scenario), it may recombine in expanded, cooled layers. Metals lines would provide a strong opacity in the UV. In light of this, I consider a more general opacity law

The self-similar solution for such a case results in L∝tλ (analogous to Equation (21)), where
For example, for a pure C/O composition Rabinak & Waxman (2011) use κ = 0.66(T/105 K)1.27 cm2 g−1. Combining such an opacity law with n = 3/2, β = 0.19, and χ = 0 results in λ = 1.71 for the power-law exponent. When instead χ = β = 0.19, then λ = 1.98, which shows that a roughly quadratic luminosity increase is fairly robust as long as the nickel deposition is increasing.
A.2. Non-plane-parallel Solution
In the continuity relation, Equation (5), I made the plane-parallel assumption that essentially all the exploding material came from roughly the same radius of R*. This is a reasonable approximation for a compact progenitor like a WD. Conversely, for a more extended progenitor continuity becomes
where r0 is the initial radius for a given shell of material. For a polytrope, this scales r0∝ρ−1/n0 at depths well below the surface of the star. Completing the self-similar analysis with a constant opacity, the diffusion wave has a time-dependent position of

This generally gives a larger exponent than the plane-parallel case in Equation (15), showing that the diffusion wave traverses through the star more rapidly in this case. The time dependence of the luminosity is

For n = 3/2, β = 0.19 and χ = 0, this results in an exponent of 1.27, which is much below 2. This means that as non-plane-parallel effects become more important, the luminosity will begin to flatten. Also note that this new exponent is much more sensitive to χ, since setting χ = β increases the exponent all the way up to 2. These non-plane-parallel solution may also have use in investigating Type Ib/c supernovae at early enough times that the light curve is still rising (perhaps for an event like in Corsi et al. 2012), but not so early that the emission if dominated by the shock heating of the surface layers (as studied by Nakar & Sari 2010).