


ABSTRACT
Using archival as well as freshly acquired data, we assess the X-ray behavior of the Fermi/Large Area Telescope γ-ray pulsars listed in the First Fermi source catalog. After revisiting the relationships between the pulsars' rotational energy losses and their X-ray and γ-ray luminosities, we focus on the distance-independent γ-to-X-ray flux ratios. When plotting our Fγ/FX values as a function of the pulsars' rotational energy losses, one immediately sees that pulsars with similar energetics have Fγ/FX spanning three decades. Such spread, most probably stemming from vastly different geometrical configurations of the X-ray and γ-ray emitting regions, defies any straightforward interpretation of the plot. Indeed, while energetic pulsars do have low Fγ/FX values, little can be said for the bulk of the Fermi neutron stars. Dividing our pulsar sample into radio-loud and radio-quiet subsamples, we find that, on average, radio-quiet pulsars do have higher values of Fγ/FX, implying an intrinsic faintness of their X-ray emission and/or a different geometrical configuration. Moreover, despite the large spread mentioned above, statistical tests show a lower scatter in the radio-quiet data set with respect to the radio-loud one, pointing to a somewhat more constrained geometry for the radio-quiet objects with respect to the radio-loud ones.
Export citation and abstract BibTeX RIS
1. INTRODUCTION
The vast majority of the 1800 rotation-powered pulsars known to date (Manchester et al. 2005) were discovered by radio telescopes. While only few pulsars have also been seen in the optical band (see, e.g., Mignani 2009, 2010), the contribution of Chandra and XMM-Newton telescopes increased the number of X-ray counterparts of radio pulsars bringing the grand total to ∼100 (see, e.g., Becker 2009). Such high-energy emission can yield crucial information on the pulsar physics, disentangling thermal components from non-thermal ones, and tracing the presence of pulsar wind nebulae (PWNe).
Chandra's exceptional spatial resolution made it possible to discriminate clearly the PWN and the pulsar (PSR) contributions while XMM-Newton's high spectral resolution and throughput unveiled the multiple spectral components which characterize pulsars (see, e.g., Possenti et al. 2002). Although the X-ray non-thermal power-law index seems somehow related to the gamma-ray spectrum (see, e.g., Kaspi et al. 2004), extrapolating the X-ray data underpredicts the γ-ray flux by at least one order of magnitude (see, e.g., Abdo et al. 2010c).
Until the launch of Fermi, only seven pulsars were seen in high-energy gamma rays (Thompson 2008), and only one of them, Geminga, was not detected by radio telescopes. The Fermi/Large Area Telescope (LAT) dramatically changed such scenario establishing radio-quiet pulsars as a major family of γ-ray emitting neutron stars. After one year of all-sky monitoring Fermi/LAT has detected 54 gamma-ray pulsars, 22 of which are radio quiet (Abdo et al. 2010a; Saz Parkinson et al. 2010; Camilo et al. 2009). Throughout this paper, we shall classify as radio quiet all the pulsars detected by Fermi through blind searches (Abdo et al. 2010a; Saz Parkinson et al. 2010) but not seen in radio in spite of dedicated deep searches. Containing a sizable fraction of radio-quiet pulsars, the Fermi sample provides, for the first time, the possibility to compare the phenomenology of radio-loud and radio-quiet neutron stars assessing their similarities and their differences (if any).
While our work rests on the Fermi data analysis and results (Abdo et al. 2010a; Saz Parkinson et al. 2010) for the X-ray side we had to first build an homogeneous data set relying both on archival sources and on fresh observations.
In the following, we will address the relationship between the classical pulsar parameters, such as age and overall energetics  , and their X-ray and γ-ray yields. While the evolution of the X-ray and γ-ray luminosities as a function of
  and the characteristic age τc have been already discussed, we will concentrate on the ratio between the X-ray and γ-ray luminosities, thus overcoming the distance conundrum which has hampered the studies discussed so far in the literature. We note that Fγ/FX parameter probes both pulsar efficiencies at different wavelengths and distribution of the emitting regions in the pulsar magnetosphere. Thus, such a distance-independent approach does magnify the role of both geometry and geography in determining the high-energy emission from pulsars.
2. DATA ANALYSIS
2.1. γ-Ray Analysis
We consider all the pulsars listed in the First Year Catalog of Fermi γ-ray sources (Abdo et al. 2010b) which contains the γ-ray pulsars listed in the First Fermi pulsar catalog (Abdo et al. 2010a) as well as the new blind-search pulsars found by Saz Parkinson et al. (2010). Our sample comprises 54 pulsars:
- 1.twenty-nine detected using radio ephemerides and
- 2.twenty-five found through blind searches; of these three were later found to have also a radio emission and, as such, they were added to the radio emitting ones.
Thus, our sample of γ-ray emitting neutron stars consists of 32 radio pulsars and 22 radio-quiet pulsars. Here, we summarize the main characteristics of the analysis performed in the two articles.
The pulsar spectra were fitted with an exponential cutoff power-law model of the form
1 GeV has been chosen to define the normalization factor because it is the energy at which the relative uncertainty on the differential flux is minimal.
The spectral analysis was performed taking into account the contribution of all the neighboring sources (up to 17°) and the diffuse emission. Sources at more than 3° from any pulsars were assigned fixed spectra, taken from the all-sky analysis. γ-rays with E > 100 MeV have been used and the contamination produced by cosmic-ray interactions in the Earth's atmosphere was avoided by selecting a zenith angle >105°.
At first, all events have been used in order to obtain a phase-averaged spectrum for each pulsar. Next the data have been split into on-pulse and off-pulse samples. The off-pulse sample has been described with a simple power law while, for the on-pulse emission, an exponentially cutoff power law has been used, with the off-pulse emission (scaled to the on-pulse phase interval) added to the model. Such an approach is adopted in order to avoid a possible PWN contamination to the pulsar spectrum.
For completeness, we included in our sample also the four radio pulsars listed in the fourth IBIS/ISGRI catalog (Bird et al. 2010) but, so far, not seen by Fermi. Searching in the one year Fermi catalog (Abdo et al. 2010b), we found a potential counterpart for PSR J0540−6919 but the lack of a pulsation prevents us to associate the IBIS/ISGRI pulsar with the Fermi source. We therefore used the 1FGL flux as an upper limit. The three remaining IBIS pulsars happen to be located near the galactic center, where the intense radiation from the disk of our Galaxy hampers the detection of γ-ray sources. We used the sensitivity map taken from Abdo et al. (2010b) to evaluate the Fermi flux upper limit.
2.2. X-Ray Data
The X-ray coverage of the Fermi/LAT pulsars is uneven since the majority of the newly discovered radio-quiet PSRs have never been the target of a deep X-ray observation, while for other well-known γ-ray pulsars—such as Crab, Vela, and Geminga—one can rely on a lot of observations. To account for such an uneven coverage, we classify the X-ray spectra on the basis of the public X-ray data available, thus assigning
- 1.label "0" to pulsars with no confirmed X-ray counterparts (or without a non-thermal spectral component);
- 2.label "1" to pulsars with a confirmed counterpart but too few photons to assess its spectral shape; and
- 3.label "2" to pulsars with a confirmed counterpart for which the data quality allows for the analysis of both the pulsar and the nebula (if present).
An "ad hoc" analysis was performed for seven pulsars for which the standard analysis could not be applied (e.g., owing to the very high thermal component of Vela or to the closeness of J1418−6058 to an active galactic nucleus, AGN). Table 2 provides details on such pulsars.
We consider an X-ray counterpart to be confirmed if
- 1.X-ray pulsation has been detected;
- 2.X-ray and radio coordinates coincide; and
- 3.
If none of these conditions apply, γ-ray pulsar is labeled as "0."
According to our classification scheme, we have 14 type-0, 7 type-1, and 37 type-2 pulsars. In total 44 γ-ray neutron stars, 31 radio-loud, and 13 radio-quiet have an X-ray counterpart.
Since the X-ray observation database is continuously growing, the results available in literature encompass only fractions of the X-ray data now available. Moreover, they have been obtained with different versions of the standard analysis softwares or using different techniques to account for the PWN contribution. Thus, with the exception of the well-known and bright X-ray pulsars, such as Crab or Vela, we reanalyzed all the X-ray data publicly available following an homogeneous procedure. If only a small fraction of the data are publicly available, we quoted results from a literature search.
In order to assess the X-ray spectra of Fermi pulsars, we used photons with energy 0.3 keV < E < 10 keV collected by Chandra/ACIS (Garmire et al. 2003), XMM-Newton (Struder et al. 2001; Turner et al. 2001), and SWIFT/XRT (Burrows et al. 2005). We selected all the public observations (as of 2010 April) that overlap the error box of Fermi pulsars or the radio coordinates.
We neglected all Chandra/HRC observations owing to the lack of energy resolution of the instrument. To analyze Chandra data, we used the Chandra Interactive Analysis of Observation software (CIAO ver. 4.1.2). The Chandra point-spread function (PSF) depends on the off-axis angle: we used for all the point sources an extraction area around the pulsar that contains 90% of the events. For instance, for on-axis sources we selected all the photons inside a 2'' radius circle, while we extracted photons from the inner part of PWNs (excluding the 2'' radius circle of the point source) in order to assess the nebular spectra: such extended regions vary from pulsar to pulsar as a function of the nebula dimension and flux.
We analyzed all the XMM-Newton data (both from PN and MOS1/2 detectors) with the XMM-Newton Science Analysis Software (SASv8.0). The raw observation data files (ODFs) were processed using standard pipeline tasks (epproc for PN, emproc for MOS data); we used only photons with event pattern 0–4 for the PN detector and 0–12 for the MOS1/2 detectors. When necessary, an accurate screening for soft proton flare events was done, following the prescription by De Luca & Molendi (2004).
If, in addition to XMM-Newton data, deep Chandra data were also available, we made an XMM-Newton spectrum of the entire PSR+PWN and used the Chandra higher resolution to disentangle the two contributions. When only XMM-Newton data were available, the point source was analyzed by selecting all the photons inside a 20'' radius circle while the whole PWN (with the exception of the 20'' radius circle of the point source) was used in order to assess the nebular spectrum.
We analyzed all the SWIFT/XRT data with HEASOFT version 6.5 selecting all the photons inside a 20'' radius circle. If multiple data sets collected by the same instruments were found, spectra, response, and effective area files for each data set were added by using the mathpha, addarf, and addrmf HEASOFT tools.
All the spectra have been studied with XSPEC v.12 (Arnaud 1996) choosing, whenever possible, the same background regions for all the different observations of each pulsar. All the data were rebinned in order to have at least 25 counts per channel, as requested for the validity of χ2 statistic.
The XMM–Chandra cross-calibration studies (Stuhlinger et al. 2008) report only minor changes in flux (<10%) between the two instruments. When both XMM and Chandra data were available, a constant has been introduced to account for such uncertainty. Conversely, when the data were collected only by one instrument, a systematic error was introduced. All the PSRs and PWNs have been fitted with absorbed power laws; when statistically needed, a blackbody component has been added to the pulsar spectrum. Since PWNs typically show a power-law spectrum with a photon index which steepens moderately as a function of the distance from the PSR (Gaensler & Slane 2006), we used only the inner part of each PWN. Absorption along the line of sight has been obtained through the fitting procedure but for the cases with very low statistic for which we used information derived from observations taken in different bands.
2.3. X-Ray Analysis
For pulsars with a good X-ray coverage, we carried out the following steps.
If only XMM-Newton public observations were available, we tried to take into account the PWN contribution. First, we searched the literature for any evidence of the presence of a PWN and, if nothing was found, we analyzed the data to search for extended emission. If no evidence for the presence of a PWN was found, we used PN and MOS1/2 data in a simultaneous spectral fit. On the other hand, if a PWN was present, its contribution was evaluated on a case by case basis. If the statistic was good enough, we studied simultaneously the inner region, containing both PSR and PWN, and the extended source region surrounding it. The inner region data were described by two absorbed (PWN and PSR) power laws, while the outer one by a single (PWN) power law. The NH and the PWN photon index values were the same in the two (inner and outer) data sets.
When public Chandra data were available, we evaluated separately PSR and PWN (if any) in a similar way.
If both Chandra and XMM public data were available, we exploited Chandra space resolution to evaluate the PWN contribution by
- 1.obtaining two different spectra of the inner region (a), encompassing both PSR and PWN and of the outer region (b) encompassing only the PWN;
- 2.extracting a total XMM spectrum (c) containing both PSR and PWN: this is the only way to take into account the XMM's larger PSF;
- 3.fitting simultaneously (a)–(c) with two absorbed power laws and eventually (if statistically significant) an absorbed blackbody, using the same NH; a constant multiplicative was also introduced in order to account for a possible discrepancy between Chandra and XMM calibrations; and
- 4.forcing to zero the normalization(s) of the PSR model(s) in the Chandra outer region and freeing the other normalizations in the Chandra data sets; fixing the XMM PSR normalization(s) at the inner Chandra data set one and the XMM PWN normalization at the inner+outer normalizations of the Chandra PWN.
Only for few well-known pulsars, or pulsars for which the data set is not yet entirely public, we used results taken from the literature (see Table 2). Where necessary, we used XSPEC in order to obtain the flux in the 0.3–10 keV energy range and to evaluate the unabsorbed flux.
For pulsars with a confirmed counterpart but too few photons to discriminate the spectral shape, we evaluated a hypothetical unabsorbed flux by assuming a single power-law spectrum with a photon index of 2 to describe PSR+PWN. We also assumed that the PWN and PSR thermal contributions are 30% of the entire source flux (a sort of mean value of all the considered type-2 pulsars). To evaluate the absorbing column, we need a distance value which can come either from the radio dispersion or—for radio-quiet pulsars—from the following pseudo-distance reported in Saz Parkinson et al. (2010):  kpc, where
  and Fγ = Fγ, 10 × 10−10 erg cm−2 s−1 and the beam correction factor fγ is assumed to be 1 (Watters et al. 2009) for all pulsars.
Then, the HEASARC WebTools (http://heasarc.gsfc.nasa.gov/docs/tools.html) was used to find the galactic column density (NH) in the direction of the pulsar; with the distance information, we could rescale the column density value of the pulsar. We found the source count rate by using the XIMAGE task (Giommi et al. 1992). Then, we used the WebPimms tool inside the WebTools package to evaluate the source unabsorbed flux. Such a value has to be then corrected to account for the PWN and PSR thermal contributions. We are aware that each pulsar can have a different photon index, as well as thermal and PWN contributions, so we used these mean values only as a first approximation. All the low-quality pulsars (type 1) will be treated separately and all the considerations in this paper will be based only on high-quality objects (type 2).
For pulsars without a confirmed counterpart, we evaluated the X-ray unabsorbed flux upper limit assuming a single power-law spectrum with a photon index of 2 to describe PSR+PWN and using a signal-to-noise ratio of 3.
The column density has been evaluated as above. Under the previous hypotheses, we used the signal-to-noise definition in order to compute the upper limit to the absorbed flux of the X-ray counterpart. Next we used XSPEC to find the unabsorbed upper limit flux.
On the basis of our X-ray analysis, we define a subsample of Fermi γ-ray pulsars for which we have, at once, reliable X-ray data (type-2 pulsars) and satisfactory distance estimates such as parallax, radio dispersion measurement, column density estimate, supernova remnant (SNR) association. Such a subsample contains 24 radio emitting neutron stars and 5 radio-quiet ones. The low number of radio quiet is to be ascribed to lack of high-quality X-ray data. Only one of the IBIS pulsars has a clear distance estimate. Moreover, we have four additional radio-quiet pulsars with reliable X-ray data but without a satisfactory distance estimate.
In Tables 2 and 3, we reported the gamma-ray and X-ray parameters of the 54 Fermi first year pulsars. We also included the four hard X-ray pulsars taken from the "Fourth IBIS/ISGRI soft gamma-ray survey catalog" (Bird et al. 2010). We use  ,
,  and
and  , where Rlc = cP/2π, P is the pulsar spin period,
  its derivative, and the standard value for moment of inertia of the neutron star I = 1045 g cm−2 (see e.g., Steiner et al. 2010). Using the P and
  values taken from Abdo et al. (2010a) and Saz Parkinson et al. (2010), we computed the values reported in Table 1. Most of the distance values are taken from Abdo et al. (2010a) and Saz Parkinson et al. (2010); see Table 1.
Table 1. General Characteristics of Fermi Pulsars
| PSR Name | Pa |  |
τc | τsnr b | Blc | da |  |
Typee | PWNf |
|---|---|---|---|---|---|---|---|---|---|
| (ms) | (10−15) | (kyr) | (kyr) | (kG) | (kpc) | (1034 erg s−1) | |||
| J0007+7303 | 316 | 361 | 14 | 13 | 3.1 | 1.4 ± 0.3 | 45.2 | g | Y |
| J0030+0451 | 4.9 | 10−5 | 7.7 × 10⁶ | ... | 17.8 | 0.30 ± 0.09 | 0.3 | m | N |
| J0205+6449 | 65.7 | 194 | 5 | 4.25 ± 0.85 | 115.9 | 2.9 ± 0.3 | 2700 | r | Y |
| J0218+4232 | 2.3 | 7.7 × 10⁻⁵ | 5 × 10⁵ | ... | 313.1 | 3.25 ± 0.75 | 24 | m | N |
| J0248+6021 | 217 | 55.1 | 63 | ... | 3.1 | 5.5 ± 3.5 | 21 | r | ? |
| J0357+32 | 444 | 12 | 590 | ... | 0.2 | 0.5c | 0.5 | g | Y |
| J0437−4715 | 5.8 | 1.4 × 10⁻⁵ | 6.6 × 10⁶ | ... | 13.7 | 0.1563 ± 0.0013 | 0.3 | m | N |
| J0534+2200 | 33.1 | 423 | 1.0 | 0.955 | 950 | 2.0 ± 0.5 | 46100 | r | Y |
| J0540−6919 | 50.5 | 480 | 1.67 | 0.9 ± 0.1 | 364 | 50d | 15000 | i | Y |
| J0613−0200 | 3.1 | 9 × 10⁻⁶ | 5.3 × 10⁶ | ... | 54.3 | 0.48+0.19 − 0.11 | 1.3 | m | N |
| J0631+1036 | 288 | 105 | 44 | ... | 2.1 | 2.185 ± 1.440 | 17.3 | r | ? |
| J0633+0632 | 297 | 79.5 | 59 | ... | 1.7 | 1.1c | 11.9 | g | ? |
| J0633+1746 | 237 | 11 | 340 | ... | 1.1 | 0.250+0.12 − 0.062 | 3.3 | g | N |
| J0659+1414 | 385 | 55 | 110 | 86 ± 8 | 0.7 | 0.288+0.033 − 0.027 | 3.8 | r | N |
| J0742−2822 | 167 | 16.8 | 160 | ... | 3.3 | 2.07+1.38 − 1.07 | 14.3 | r | ? |
| J0751+1807 | 3.5 | 6.2 × 10⁻⁶ | 8 × 10⁶ | ... | 32.3 | 0.6+0.6 − 0.2 | 0.6 | m | N |
| J0835−4510 | 89.3 | 124 | 11 | 13 ± 1 | 43.4 | 0.287+0.019 − 0.017 | 688 | r | Y |
| J1023−5746 | 111 | 384 | 4.6 | ... | 44 | 2.4c | 1095 | g | ? |
| J1028−5819 | 91.4 | 16.1 | 90 | ... | 14.6 | 2.33 ± 0.70 | 83.2 | r | Y |
| J1044−5737 | 139 | 54.6 | 40.3 | ... | 9.5 | 1.5c | 80.3 | g | ? |
| J1048−5832 | 124 | 96.3 | 20 | ... | 16.8 | 2.71 ± 0.81 | 201 | r | Y |
| J1057−5226 | 197 | 5.8 | 540 | ... | 1.3 | 0.72 ± 0.20 | 3.0 | r | N |
| J1124−5916 | 135 | 747 | 3 | 2.99 ± 0.06 | 37.3 | 4.8+0.7 − 1.2 | 1190 | r | Y |
| J1413−6205 | 110 | 27.7 | 62.9 | ... | 12.3 | 1.4c | 82.7 | g | ? |
| J1418−6058 | 111 | 170 | 10 | ... | 29.4 | 3.5 ± 1.5 | 495 | g | Y |
| J1420−6048 | 68.2 | 83.2 | 13 | ... | 69.1 | 5.6 ± 1.7 | 1000 | r | N |
| J1429−5911 | 116 | 30.5 | 60.2 | ... | 11.3 | 1.6c | 77.5 | g | ? |
| J1459−60 | 103 | 25.5 | 64 | ... | 13.6 | 1.5c | 91.9 | g | ? |
| J1509−5850 | 88.9 | 9.2 | 150 | ... | 11.8 | 2.6 ± 0.8 | 51.5 | r | N |
| J1614−2230 | 3.2 | 4 × 10⁻⁶ | 1.2 × 10⁶ | ... | 33.7 | 1.27 ± 0.39 | 0.5 | m | N |
| J1617−5055 | 69 | 135 | 8.13 | ... | 86.6 | 6.5 ± 0.4d | 1600 | i | Y |
| J1709−4429 | 102 | 93 | 18 | 5.5 ± 0.5 | 26.4 | 2.5 ± 1.1 | 341 | r | Y |
| J1718−3825 | 74.7 | 13.2 | 90 | ... | 21.9 | 3.82 ± 1.15 | 125 | r | Y |
| J1732−31 | 197 | 26.1 | 120 | ... | 2.7 | 0.6c | 13.6 | g | ? |
| J1741−2054 | 414 | 16.9 | 390 | ... | 0.3 | 0.38 ± 0.11 | 0.9 | r | ? |
| J1744−1134 | 4.1 | 7 × 10⁻⁶ | 9 × 10⁶ | ... | 24 | 0.357+0.043 − 0.035 | 0.4 | m | N |
| J1747−2958 | 98.8 | 61.3 | 26 | 163+60 − 39 | 23.5 | 2.0 ± 0.6 | 251 | r | Y |
| J1809−2332 | 147 | 34.4 | 68 | 50 ± 5 | 6.5 | 1.7 ± 1.0 | 43 | g | Y |
| J1811−1926 | 62 | 41 | 24 | 2.18 ± 1.22 | 64 | 7 ± 2d | 678 | i | Y |
| J1813−1246 | 48.1 | 17.6 | 43 | ... | 76.2 | 2.0c | 626 | g | ? |
| J1813−1749 | 44.7 | 150 | 5.4 | 1.3925 ± 1.1075 | 272 | 4.70 ± 0.47d | 680 | i | Y |
| J1826−1256 | 110 | 121 | 14 | ... | 25.2 | 1.2c | 358 | g | Y |
| J1833−1034 | 61.9 | 202 | 5 | 0.87+0.20 − 0.15 | 137.3 | 4.7 ± 0.4 | 3370 | r | Y |
| J1836+5925 | 173 | 1.5 | 1800 | ... | 0.9 | 0.4+0.4d − 0.15 | 1.2 | g | N |
| J1846+0919 | 226 | 9.93 | 360 | ... | 1.2 | 1.2c | 3.4 | g | ? |
| J1907+06 | 107 | 87.3 | 19 | ... | 23.2 | 1.3c | 284 | r | ? |
| J1952+3252 | 39.5 | 5.8 | 110 | 64.0 ± 18 | 71.6 | 2.0 ± 0.5 | 374 | r | Y |
| J1954+2836 | 92.7 | 21.2 | 69.5 | ... | 16.4 | 1.7c | 105 | g | ? |
| J1957+5036 | 375 | 7.08 | 838 | ... | 0.3 | 0.9c | 0.5 | g | ? |
| J1958+2841 | 290 | 222 | 21 | ... | 3.0 | 1.4c | 35.8 | g | ? |
| J2021+3651 | 104 | 95.6 | 17 | ... | 26 | 2.1+2.1 − 1.0 | 338 | r | Y |
| J2021+4026 | 265 | 54.8 | 77 | ... | 1.9 | 1.5 ± 0.45 | 11.6 | g | ? |
| J2032+4127 | 143 | 19.6 | 120 | ... | 5.3 | 3.60 ± 1.08 | 26.3 | r | ? |
| J2043+2740 | 96.1 | 1.3 | 1200 | ... | 3.6 | 1.80 ± 0.54 | 5.6 | r | N |
| J2055+25 | 320 | 4.08 | 1227 | ... | 0.3 | 0.4c | 0.5 | g | ? |
| J2124−3358 | 4.9 | 1.2 × 10⁻⁵ | 6 × 10⁵ | ... | 18.8 | 0.25+0.25 − 0.08 | 0.4 | m | N |
| J2229+6114 | 51.6 | 78.3 | 11 | 3.90 ± 0.39 | 134.5 | 3.65 ± 2.85 | 2250 | r | Y |
| J2238+59 | 163 | 98.6 | 26 | ... | 8.6 | 2.1c | 90.3 | g | ? |
Notes.
aP,  , and most of the values of the distance are taken from Abdo et al. (2010a) and Saz Parkinson et al. (2010).
bAge derived from the associated SNR. Respectively, taken from Slane et al. (2004), Gotthelf et al. (2007), Rudie et al. (2008), Hwang et al. (2001), Thorsett et al. (2003), Gorenstein et al. (1974), Winkler et al. (2009), Bock & Gvaramadze (2002), Hales et al. (2009), Roberts & Brogan (2008), Tam & Roberts (2003), Brogan et al. (2005), Bietenholz & Bartel (2008), and Migliazzo et al. (2002), Kothes et al. (2006).
cThese distances are taken from Saz Parkinson et al. (2010) and are obtained under the assumption of a beam correction factor fγ = 1 for the gamma-ray emission cone of all pulsars. In this way one obtains
, and most of the values of the distance are taken from Abdo et al. (2010a) and Saz Parkinson et al. (2010).
bAge derived from the associated SNR. Respectively, taken from Slane et al. (2004), Gotthelf et al. (2007), Rudie et al. (2008), Hwang et al. (2001), Thorsett et al. (2003), Gorenstein et al. (1974), Winkler et al. (2009), Bock & Gvaramadze (2002), Hales et al. (2009), Roberts & Brogan (2008), Tam & Roberts (2003), Brogan et al. (2005), Bietenholz & Bartel (2008), and Migliazzo et al. (2002), Kothes et al. (2006).
cThese distances are taken from Saz Parkinson et al. (2010) and are obtained under the assumption of a beam correction factor fγ = 1 for the gamma-ray emission cone of all pulsars. In this way one obtains  kpc, where
  and Fγ = Fγ, 10 × 10−10 erg cm−2 s−1. See also Saz Parkinson et al. (2010).
dRespectively, taken from Campana et al. (2008), Kaspi et al. (1998), Kaspi et al. (2001), Gotthelf & Halpern (2009), and Halpern et al. (2007).
eg: radio-quiet pulsars; r: radio-loud pulsars; m: millisecond pulsars; i: pulsars detected by INTEGRAL/IBIS but not yet by Fermi (see Bird et al. 2010).
fOnly bright PWNs have been considered (with Fpwnx > 1/5 Fpsrx). The presence or the absence of a bright PWN has been valued by reanalyzing the X-ray data (except for the X-ray analyses taken from literature, see Table 2).
and Fγ = Fγ, 10 × 10−10 erg cm−2 s−1. See also Saz Parkinson et al. (2010).
dRespectively, taken from Campana et al. (2008), Kaspi et al. (1998), Kaspi et al. (2001), Gotthelf & Halpern (2009), and Halpern et al. (2007).
eg: radio-quiet pulsars; r: radio-loud pulsars; m: millisecond pulsars; i: pulsars detected by INTEGRAL/IBIS but not yet by Fermi (see Bird et al. 2010).
fOnly bright PWNs have been considered (with Fpwnx > 1/5 Fpsrx). The presence or the absence of a bright PWN has been valued by reanalyzing the X-ray data (except for the X-ray analyses taken from literature, see Table 2).
Download table as: ASCIITypeset image
Table 2. X-ray Spectra of the Pulsars
| PSR Name | Xa | Instb | FntX | FtotX | NH | γX | kT | RBB | EffX d |
|---|---|---|---|---|---|---|---|---|---|
| (10−13 erg cm−2 s−1) | (10−13 erg cm−2 s−1) | (1020 cm−3) | (keV) | (km) | |||||
| J0007+7303 | 2 | X/C | 0.686 ± 0.100 | 0.841 ± 0.098 | 16.6+8.9 − 7.6 | 1.30 ± 0.18 | 0.102+0.032 − 0.018 | 0.64+0.88 − 0.20 | 2.84 × 10⁻⁵ |
| J0030+0451 | 2 | X | 1.16 ± 0.02 | 2.8 ± 0.1 | 0.244+7.470 − 0.244 | 2.8+0.5 − 0.4 | 0.194+0.015 − 0.021 | 0.6+0.225 − 0.1 | 3.32 × 10⁻⁴ |
| J0205+6449 | 2 | C | 19.9 ± 0.5 | 19.9 ± 0.5 | 40.2 ± 0.11 | 1.82 ± 0.03 | ... | ... | 5.92 × 10⁻⁵ |
| J0218+4232 | 2 | Lf | 4.87+0.57 − 1.28 | 4.87+0.57 − 1.28 | 7.6 ± 4.3 | 1.19 ± 0.12 | ... | ... | 2.05 × 10⁻³ |
| J0248+6021 | 0 | S | <9.00 | <9.00 | 80c | 2 | ... | ... | ... |
| J0357+32 | 2 | C | 0.64+0.09 − 0.06 | 0.64+0.09 − 0.06 | 8.0 ± 4.0 | 2.53 ± 0.25 | ... | ... | ... |
| J0437−4715 | 2 | X/C | 10.10.8 − 0.6 | 14.30.9 − 0.7 | 4.4 ± 1.7 | 3.17 ± 0.13 | 0.228+0.006 − 0.003 | 0.060+0.009 − 0.008 | 8.23 × 10⁻⁵ |
| J0534+2200 | 2 | Lf | 44300 ± 1000 | 44300 ± 1000 | 34.5 ± 0.2 | 1.63 ± 0.09 | ... | ... | 3.67 × 10⁻³ |
| J0540−6919 | 2 | Lf | 568 ± 6 | 568 ± 6 | 37 ± 1 | 1.98 ± 0.02 | ... | ... | 1.13 × 10⁻¹ |
| J0613−0200 | 2* | X | 0.221+0.297 − 0.158 | 0.221+0.297 − 0.158 | 1e | 2.7 ± 0.4 | ... | ... | 3.74 × 10⁻⁵ |
| J0631+1036 | 0 | X | <0.225 | <0.225 | 20c | 2 | ... | ... | ... |
| J0633+0632 | 1 | S | 1.53 ± 0.51 | 1.53 ± 0.51 | 20c | 2 | ... | ... | ... |
| J0633+1746 | 2 | Lf | 4.97+0.09 − 0.27 | 12.6+0.2 − 0.7 | 1.07e | 1.7 ± 0.1 | 0.190 ± 0.030 | 0.04 ± 0.01 | 8.99 × 10⁻⁵ |
| J0659+1414 | 2 | Lf | 4.06+0.03 − 0.59 | 168+1 − 24 | 4.3 ± 0.2 | 2.1 ± 0.3 | 0.125 ± 0.003 | 1.80 ± 0.15 | 8.46 × 10⁻⁵ |
| J0742−2822 | 0 | X | <0.225 | <0.225 | 20c | 2 | ... | ... | ... |
| J0751+1807 | 2 | Lf | 0.44+0.18 − 0.13 | 0.44+0.18 − 0.13 | 4e | 1.59 ± 0.30 | ... | ... | 2.52 × 10⁻⁴ |
| J0835−4510 | 2* | Lf | 65.1 ± 15.7 | 281 ± 67 | 2.2 ± 0.5 | 2.7 ± 0.6 | 0.129 ± 0.007 | 2.5 ± 0.3 | 9.78 × 10⁻⁶ |
| J1023−5746 | 2* | C | 1.61 ± 0.27 | 1.61 ± 0.27 | 115+47 − 41 | 1.15+0.24 − 0.22 | ... | ... | ... |
| J1028−5819 | 1 | S | 1.5 ± 0.5 | 1.5 ± 0.5 | 50c | 2 | ... | ... | ... |
| J1044−5737 | 0 | S | <3.93 | <3.93 | 50c | 2 | ... | ... | ... |
| J1048−5832 | 2* | C+X | 0.50+0.35 − 0.10 | 0.50+0.35 − 0.10 | 90+40 − 20 | 2.4 ± 0.5 | ... | ... | 1.74 × 10⁻⁵ |
| J1057−5226 | 2 | C+X | 1.51+0.02 − 0.13 | 24.5+0.3 − 2.5 | 2.7 ± 0.2 | 1.7 ± 0.1 | 0.179 ± 0.006 | 0.46 ± 0.06 | 2.49 × 10⁻⁴ |
| J1124−5916 | 2 | C | 9.78+1.18 − 1.03 | 10.90+1.32 − 1.26 | 30.0+2.8 − 4.8 | 1.54+0.09 − 0.17 | 0.426+0.034 − 0.018 | 0.274+0.089 − 0.077 | 2.27 × 10⁻⁴ |
| J1413−6205 | 0 | S | <4.9 | <4.9 | 40c | 2 | ... | ... | ... |
| J1418−6058 | 2 | C+X | 0.353 ± 0.154 | 0.353 ± 0.154 | 233+134 − 106 | 1.85+0.83 − 0.56 | ... | ... | 1.05 × 10⁻⁵ |
| J1420−6048 | 2* | X | 1.6 ± 0.7 | 1.6 ± 0.7 | 202+161 − 106 | 0.84+0.55 − 0.37 | ... | ... | 1.11 × 10⁻⁴ |
| J1429−5911 | 0 | S | <16.9 | <16.9 | 80c | 2 | ... | ... | ... |
| J1459−60 | 0 | S | <3.93 | <3.93 | 100c | 2 | ... | ... | ... |
| J1509−5850 | 2 | C+X | 0.891+0.132 − 0.186 | 0.891+0.132 − 0.186 | 80e | 1.31 ± 0.15 | ... | ... | 1.12 × 10⁻⁴ |
| J1614−2230 | 0 | C+X | <0.286 | 0.286+0.015 − 0.086 | 2.9+4.3 − 2.9 | 2 | 0.236 ± 0.024 | 0.92+0.73 − 0.35 | ... |
| J1617−5055 | 2 | Lf | 64.2 ± 0.3 | 64.2 ± 0.3 | 345 ± 14 | 1.14 ± 0.06 | ... | ... | 2.03 × 10⁻³ |
| J1709−4429 | 2 | C+X | 3.78+0.37 − 0.94 | 9.04+0.87 − 2.25 | 45.6+4.4 − 2.9 | 1.88 ± 0.21 | 0.166 ± 0.012 | 4.3+1.72 − 0.86 | 6.62 × 10⁻⁵ |
| J1718−3825 | 2 | X | 2.80 ± 0.67 | 2.80 ± 0.67 | 70e | 1.4 ± 0.2 | ... | ... | 3.12 × 10⁻⁴ |
| J1732−31 | 0 | S | <2.42 | <2.42 | 50c | 2 | ... | ... | ... |
| J1741−2054g | 1 | S | 4.64+1.84 − 1.63 | 4.64+1.84 − 1.63 | 0e | 2.10+0.50 − 0.28 | ... | ... | 9.93 × 10⁻⁴ |
| J1744−1134 | 0 | C | <0.272 | 0.272 ± 0.020 | 12+42 − 12 | 2 | 0.272+0.094 − 0.098 | 0.132+1.600 − 0.120 | ... |
| J1747−2958 | 2* | C+X | 48.7+21.3 − 6.0 | 48.7+21.3 − 6.0 | 256+9 − 6 | 1.51+0.12 − 0.44 | ... | ... | 7.41 × 10⁻⁴ |
| J1809−2332 | 2 | C+X | 1.40+0.25 − 0.23 | 3.14+0.57 − 0.53 | 61+9 − 8 | 1.85+1.89 − 0.36 | 0.190 ± 0.025 | 1.54+1.26 − 0.44 | 8.98 × 10⁻⁵ |
| J1811−1926 | 2 | C | 26.6+2.3 − 3.7 | 26.6+2.3 − 3.7 | 175+11 − 12 | 0.91+0.09 − 0.08 | ... | ... | 1.18 × 10⁻³ |
| J1813−1246 | 1 | S | 9.675 ± 3.225 | 9.675 ± 3.225 | 100c | 2 | ... | ... | 1.13 × 10⁻³ |
| J1813−1749 | 2 | C | 24.4 ± 11.5 | 24.4 ± 11.5 | 840+433 − 373 | 1.3 ± 0.3 | ... | ... | ... |
| J1826−1256 | 2 | C | 1.18 ± 0.58 | 1.18 ± 0.58 | 100e | 0.63+0.90 − 0.63 | ... | ... | ... |
| J1833−1034 | 2 | X+C | 66.3 ± 2.0 | 66.3 ± 2.0 | 230e | 1.51 ± 0.07 | ... | ... | 4.15 × 10⁻⁴ |
| J1836+5925 | 2 | X+C | 0.459+0.403 − 0.174 | 0.570+0.500 − 0.216 | 0+0.792 − 0 | 1.56+0.51 − 0.73 | 0.056+0.012 − 0.009 | 4.47+3.03 − 1.31 | 5.84 × 10⁻⁵ |
| J1846+0919 | 0 | S | <2.92 | <2.92 | 20c | 2 | ... | ... | ... |
| J1907+06 | 1 | C | 3.93 ± 1.45 | 3.93 ± 1.45 | 398+468 − 375 | 3.16+2.76 − 2.28 | ... | ... | ... |
| J1952+3252 | 2 | Lf | 35.0 ± 4.4 | 38.0 ± 3.0 | 30 ± 1 | 1.63+0.03 − 0.05 | 0.13 ± 0.02 | 2.2+1.4 − 0.8 | 3.57 × 10⁻⁴ |
| J1954+2836 | 0 | S | <3.65 | <3.65 | 50c | 2 | ... | ... | ... |
| J1957+5036 | 0 | S | <2.98 | <2.98 | 10c | 2 | ... | ... | ... |
| J1958+2841 | 1 | S | 1.57 ± 0.53 | 1.57 ± 0.53 | 40c | 2 | ... | ... | ... |
| J2021+3651 | 2 | C+X | 2.21+0.35 − 1.27 | 6.01+0.96 − 3.44 | 65.5 ± 6.0 | 2 ± 0.5 | 0.140+0.023 − 0.018 | 4.94 ± 1.40 | 2.75 × 10⁻⁵ |
| J2021+4026 | 1 | C | 0.443 ± 0.148 | 0.443 ± 0.148 | 40c | 2 | ... | ... | 1.03 × 10⁻⁴ |
| J2032+4127 | 2* | C+X | 0.423 ± 0.118 | 0.423 ± 0.118 | 38.7+75.6 − 38.7 | 1.87+0.96 − 0.76 | ... | ... | 1.99 × 10⁻⁴ |
| J2043+2740 | 2 | X | 0.208+0.480 − 0.208 | 0.208+0.48 − 1.08 | 0+20 − 0 | 3.1 ± 0.4 | ... | ... | 1.44 × 10⁻⁴ |
| J2055+25 | 2 | X | 0.382+0.197 − 0.148 | 0.382+0.197 − 0.148 | 7.3+10.4 − 7.3 | 2.2+0.5 − 0.6 | ... | ... | 1.79 × 10⁻³ |
| J2124−3358 | 2 | X | 0.668+0.150 − 0.344 | 0.959+0.216 − 0.494 | 2.76+4.87 − 2.76 | 2.89+0.45 − 0.35 | 0.268+0.034 − 0.032 | 0.019+0.012 − 0.009 | 1.25 × 10⁻⁴ |
| J2229+6114 | 2 | C+X | 51.3+9.3 − 5.8 | 51.3+9.3 − 5.8 | 30+9 − 4 | 1.01+0.06 − 0.12 | ... | ... | 2.90 × 10⁻⁴ |
| J2238+59 | 0 | S | <4.49 | <4.49 | 70c | 2 | ... | ... | ... |
Notes. The fluxes are unabsorbed and here the non-thermal and total fluxes are shown. The model used is an absorbed power law plus blackbody, where statistically necessary. The only exceptions are PSR J0437−4715 (double PC plus power law), J0633+1746 and J0659+1414 (double BB plus power law): here only the most relevant thermal component is reported. All the errors are at a 90% confidence level. aThis parameter shows the confidence of the X-ray spectrum of each pulsar, based on the available X-ray data. An asterisk marks the pulsars for which an ad hoc analysis was necessary. See Section 2.2. bC: Chandra/ACIS; X: XMM/PN+MOS; S: SWIFT/XRT; L: literature. Only public data have been used (at 2010 December). cHere, the column density has been fixed by using the galactic value in the pulsar direction obtained by WebTools (http://heasarc.gsfc.nasa.gov/docs/tools.html) and scaling it for the distance (see Table 1). dThe beam correction factor fX is assumed to be 1, which can result in an efficiency >1. See Watters et al. (2009). Here, the errors are not reported. eThe statistic is very low, so it was necessary to freeze the column density parameter; the values have been evaluated by using WebTools (http://heasarc.gsfc.nasa.gov/docs/tools.html). fRespectively, taken from Webb et al. (2004a), Kargaltsev & Pavlov (2008), Campana et al. (2008), De Luca et al. (2005), De Luca et al. (2005), Webb et al. (2004b), Mori et al. (2004), Kargaltsev et al. (2009), and Li et al. (2005). gThe spectrum is fitted well also by a single blackbody.
3. DISCUSSION
3.1. Study of the X-Ray Luminosity
The X-ray luminosity, LX, is correlated with the pulsar spin-down luminosity  . The scaling was first noted by Seward & Wang (1988) who used Einstein data of 22 pulsars—most of them just upper limits—to derive a linear relation between logFX0.2–4 keV and log
 . Later, Becker & Trumper (1997) investigated a sample of 27 pulsars using ROSAT, yielding the simple scaling
  . The uncertainty due to soft X-ray absorption translates into very high flux errors; moreover it was very hard to discriminate between the thermal and power-law spectral components. A reanalysis was performed by Possenti et al. (2002), who studied in the 2–10 keV band a sample of 39 pulsars observed by several X-ray telescopes. However, they could not separate the PWN from the pulsar contribution. Moreover, they conservatively adopted, for most of the pulsars, an uncertainty of 40% on the distance values. A better comparison with our data can be done with the results by Kargaltsev & Pavlov (2008), who recently used high-resolution Chandra data in order to disentangle the PWN and pulsar fluxes. Focusing just on Chandra data, and rejecting XMM observations, they obtain a poor spectral characterization which translates in high errors on fluxes. They also adopted an uncertainty of 40% on the distance values for most pulsars. Despite the big uncertainties, mainly due to poor distance estimates, all these data sets show that the LX versus
  relation is quite scattered. The high values of the χ2red seem to exclude a simple statistical effect.
We are now facing a different panorama, since our ability to evaluate pulsars' distances has improved (Abdo et al. 2010a; Saz Parkinson et al. 2010) and we are now much better in discriminating pulsar emission from its nebula. The use of XMM data makes it possible to build good quality spectra allowing to disentangle the non-thermal from the thermal contribution, when present. In particular, we can study the newly discovered radio-quiet pulsar population and compare them with the "classical" radio-loud pulsars. We investigate the relations between the X-ray and γ-ray luminosities and pulsar parameters, making use of the data collected in Tables 1–3.
Table 3. γ-ray Spectra of the Pulsars
| PSR Name | FR | Fγ | γγ | CutoffG | Effγ a | Fγ/FXnt | Fγ/FXtot |
|---|---|---|---|---|---|---|---|
| (mJy) | (10−10 erg cm−2 s−1) | (GeV) | |||||
| J0007+7303 | <0.006c | 3.82 ± 0.11 | 1.38 ± 0.04 | 4.6 ± 0.4 | 0.2 | 5570 ± 827 | 4544 ± 546 |
| J0030+0451 | 0.6 | 0.527 ± 0.035 | 1.22 ± 0.16 | 1.8 ± 0.4 | 0.17 | 454 ± 31 | 188 ± 14 |
| J0205+6449 | 0.04 | 0.665 ± 0.054 | 2.09 ± 0.14 | 3.5 ± 1.4 | 0.0025 | 33.4 ± 2.9 | 33.4 ± 2.9 |
| J0218+4232 | 0.9 | 0.362 ± 0.053 | 2.02 ± 0.23 | 5.1 ± 4.2 | 0.2 | 74.3+13.9 − 22.4 | 74.3+13.9 − 22.4 |
| J0248+6021 | 9 | 0.308 ± 0.058 | 1.15 ± 0.49 | 1.4 ± 0.6 | 0.735 | >34.2 | >34.2 |
| J0357+32 | <0.043c | 0.639 ± 0.037 | 1.29 ± 0.18 | 0.9 ± 0.2 | 5.23 | 1000+200 − 150 | 1000+200 − 150 |
| J0437−4715 | 140 | 0.186 ± 0.022 | 1.74 ± 0.32 | 1.3 ± 0.7 | 0.02 | 18.4 ± 2.5 | 13.0 ± 1.7 |
| J0534+2200 | 14 | 13.07 ± 1.12 | 1.97 ± 0.06 | 5.8 ± 1.2 | 0.001 | 0.295 ± 0.026 | 0.295 ± 0.026 |
| J0540−6919 | 0.024 | <0.833 | 2 | ... | ... | <1.47 | <1.47 |
| J0613−0200 | 1.4 | 0.324 ± 0.035 | 1.38 ± 0.24 | 2.7 ± 1.0 | 0.07 | 1464+1974 − 1059 | 1464+1974 − 1059 |
| J0631+1036 | 0.8 | 0.304 ± 0.051 | 1.38 ± 0.35 | 3.6 ± 1.8 | 0.14 | >1350 | >1350 |
| J0633+0632 | <0.003c | 0.801 ± 0.064 | 1.29 ± 0.18 | 2.2 ± 0.6 | 1.4 | 524 ± 179 | 524 ± 179 |
| J0633+1746 | <1 | 33.85 ± 0.29 | 1.08 ± 0.02 | 1.90 ± 0.05 | 0.78 | 6812+136 − 375 | 2687+48 − 151 |
| J0659+1414 | 3.7 | 0.317 ± 0.030 | 2.37 ± 0.42 | 0.7 ± 0.5 | 0.01 | 78.1+7.5 − 13.6 | 1.89+0.18 − 0.32 |
| J0742−2822 | 15 | 0.183 ± 0.035 | 1.76 ± 0.40 | 2.0 ± 1.4 | 0.07 | >812 | >812 |
| J0751+1807 | 3.2 | 0.109 ± 0.032 | 1.56 ± 0.58 | 3.0 ± 4.3 | 0.08 | 248+125 − 103 | 248+125 − 103 |
| J0835−4510 | 1100 | 88.06 ± 0.45 | 1.57 ± 0.01 | 3.2 ± 0.06 | 0.01 | 1353 ± 326 | 313 ± 75 |
| J1023−5746 | <0.031 | 1.55 ± 0.10 | 1.47 ± 0.14 | 1.6 ± 0.3 | 0.12 | 963 ± 173 | 963 ± 173 |
| J1028−5819 | 0.36 | 1.77 ± 0.12 | 1.25 ± 0.17 | 1.9 ± 0.5 | 0.14 | 1182 ± 403 | 1182 ± 403 |
| J1044−5737 | <0.021 | 1.03 ± 0.07 | 1.60 ± 0.12 | 2.5 ± 0.5 | 0.45 | >262 | >262 |
| J1048−5832 | 6.5 | 1.73 ± 0.11 | 1.31 ± 0.15 | 2.0 ± 0.4 | 0.08 | 3451+2426 − 725 | 3451+2426 − 725 |
| J1057−5226 | 11 | 2.72 ± 0.08 | 1.06 ± 0.08 | 1.3 ± 0.1 | 0.56 | 1804+59 − 164 | 111+4 − 12 |
| J1124−5916 | 0.08 | 0.380 ± 0.058 | 1.43 ± 0.33 | 1.7 ± 0.7 | 0.01 | 38.9 ± 7.4 | 34.9 ± 6.7 |
| J1413−6205 | <0.025 | 1.29 ± 0.10 | 1.32. ± 0.16 | 2.6 ± 0.6 | 0.43 | >287 | >287 |
| J1418−6058 | <0.03c | 2.36 ± 0.32 | 1.32 ± 0.20 | 1.9 ± 0.4 | 0.08 | 6672 ± 3049 | 6672 ± 3049 |
| J1420−6048 | 0.9 | 1.59 ± 0.29 | 1.73 ± 0.20 | 2.7 ± 1.0 | 0.06 | 426 ± 112 | 426 ± 112 |
| J1429−5911 | <0.022 | 0.926 ± 0.081 | 1.93 ± 0.14 | 3.3 ± 1.0 | 0.45 | >55.0 | >55.0 |
| J1459−60 | <0.038c | 1.06 ± 0.10 | 1.83 ± 0.20 | 2.7 ± 1.1 | 0.52 | >269 | >269 |
| J1509−5850 | 0.15 | 0.969 ± 0.101 | 1.36 ± 0.23 | 3.5 ± 1.1 | 0.15 | 1088+197 − 254 | 1088+197 − 254 |
| J1614−2230 | ... | 0.274 ± 0.042 | 1.34 ± 0.36 | 2.4 ± 1.0 | 1.03 | >958 | 958+196 − 434 |
| J1617−5055 | ... | <0.3 | 2 | ... | ... | <4.5 | <4.5 |
| J1709−4429 | 7.3 | 12.42 ± 0.22 | 1.70 ± 0.03 | 4.9 ± 0.4 | 0.33 | 3285+327 − 819 | 1374+134 − 343 |
| J1718−3825 | 1.3 | 0.673 ± 0.160 | 1.26 ± 0.62 | 1.3 ± 0.6 | 0.09 | 240 ± 81 | 240 ± 81 |
| J1732−31 | <0.008c | 2.42 ± 0.12 | 1.27 ± 0.12 | 2.2 ± 0.3 | 1.33 | >1000 | >1000 |
| J1741−2054 | 0.156c | 1.28 ± 0.07 | 1.39 ± 0.14 | 1.2 ± 0.2 | 0.24 | 277+111 − 98 | 277+111 − 98 |
| J1744−1134 | 3 | 0.280 ± 0.046 | 1.02 ± 0.59 | 0.7 ± 0.4 | 0.1 | >1030 | 1030 ± 187 |
| J1747−2958 | 0.25 | 1.31 ± 0.14 | 1.11 ± 0.28 | 1.0 ± 0.2 | 0.02 | 26.9+12.1 − 4.3 | 26.9+12.1 − 4.3 |
| J1809−2332 | <0.026c | 4.13 ± 0.13 | 1.52 ± 0.06 | 2.9 ± 0.3 | 0.33 | 2951+535 − 494 | 1316+242 − 226 |
| J1811−1926 | ... | <0.3 | 2 | ... | ... | <11.25 | <11.25 |
| J1813−1246 | <0.028c | 1.69 ± 0.11 | 1.83 ± 0.12 | 2.9 ± 0.8 | 0.20 | 175 ± 59 | 175 ± 59 |
| J1813−1749 | ... | <0.3 | 2 | ... | ... | <11.25 | <11.25 |
| J1826−1256 | <0.044c | 3.34 ± 0.15 | 1.49 ± 0.09 | 2.4 ± 0.3 | 20.7 | 2834 ± 1398 | 2834 ± 1398 |
| J1833−1034 | 0.07 | 1.02 ± 0.12 | 2.24 ± 0.15 | 7.7 ± 4.8 | 0.01 | 15.3 ± 1.9 | 15.3 ± 1.9 |
| J1836+5925 | <0.01c | 6.00 ± 0.11 | 1.35 ± 0.03 | 2.3 ± 0.1 | 2 | 13065+11474 − 4958 | 10520+9231 − 3991 |
| J1846+0919 | <0.004 | 0.358 ± 0.035 | 1.60 ± 0.19 | 4.1 ± 1.5 | 2.1 | >123 | >123 |
| J1907+06 | 0.0034b | 2.75 ± 0.13 | 1.84 ± 0.08 | 4.6 ± 1.0 | 0.30 | 700 ± 260 | 700 ± 260 |
| J1952+3252 | 1 | 1.34 ± 0.07 | 1.75 ± 0.10 | 4.5 ± 1.2 | 0.02 | 38.3 ± 5.3 | 35.2 ± 3.4 |
| J1954+2836 | <0.004 | 0.975 ± 0.068 | 1.55 ± 0.14 | 2.9 ± 0.7 | 0.39 | >267 | >267 |
| J1957+5036 | <0.025 | 0.227 ± 0.020 | 1.12 ± 0.28 | 0.9 ± 0.2 | 5.6 | >76.2 | >76.2 |
| J1958+2841 | <0.005c | 0.846 ± 0.069 | 0.77 ± 0.26 | 1.2 ± 0.2 | 1.6 | 539 ± 187 | 539 ± 187 |
| J2021+3651 | 0.1 | 4.70 ± 0.15 | 1.65 ± 0.06 | 2.6 ± 0.3 | 0.07 | 2129+343 − 1225 | 783+127 − 449 |
| J2021+4026 | <0.011c | 9.77 ± 0.18 | 1.79 ± 0.03 | 3.0 ± 0.2 | 2.2 | 22061 ± 7381 | 22061 ± 7381 |
| J2032+4127 | 0.05c | 1.12 ± 0.12 | 0.68 ± 0.38 | 2.1 ± 0.6 | 0.64 | 2636 ± 790 | 2636 ± 790 |
| J2043+2740 | 7 | 0.155 ± 0.027 | 1.07 ± 0.55 | 0.8 ± 0.3 | 0.09 | 747+217 − 409 | 747+217 − 409 |
| J2055+25 | <0.106 | 1.15 ± 0.07 | 0.71 ± 0.19 | 1.0 ± 0.2 | 5.4 | 3010+1563 − 1181 | 3010+1563 − 1181 |
| J2124−3358 | 1.6 | 0.276 ± 0.035 | 1.05 ± 0.28 | 2.7 ± 1.0 | 0.05 | 413+107 − 219 | 288+74 − 153 |
| J2229+6114 | 0.25 | 2.20 ± 0.08 | 1.74 ± 0.07 | 3.0 ± 0.5 | 0.025 | 42.9+7.9 − 5.1 | 42.9+7.9 − 5.1 |
| J2238+59 | <0.007c | 0.545 ± 0.059 | 1.00 ± 0.36 | 1.0 ± 0.3 | 0.52 | >121 | >121 |
Notes. A broken power-law spectral shape is assumed for all the pulsars and the values are taken from Abdo et al. (2010a) and Saz Parkinson et al. (2010). The gamma-ray flux is above 100 GeV. The four sources with an upper limit flux are taken from Bird et al. (2010; see Section 2.1). The radio flux densities (at 1400 MHz) are taken from Abdo et al. (2010a) and Saz Parkinson et al. (2010). All the errors are at a 90% confidence level. afγ is assumed to be 1, which can result in an efficiency >1. See Watters et al. (2009). Here the errors are not reported. bTaken from Ray et al. (2010). c Taken from Abdo et al. (2010d).
Download table as: ASCIITypeset image
Using the 29 Fermi type-2 pulsars with a clear distance estimate and with a well-constrained X-ray spectrum, the weighted least-square fit yields

where  and LX = LX29 × 1029 erg s−1. All the uncertainties are at 90% confidence level. We can evaluate the goodness of this fit using the reduced χ2 value χ2red = 3.7; a double-linear fit does not significantly change the value of χ2red. A more precise way to evaluate the dispersion of the data set around the fitted curve is the parameter
where yioss is the actual ith value of the data set (in our case log10LX29) and yifit the expected one. A lesser spread in the data set translates into a lower value of W2. We obtain W2 = 0.436 for the  relationship. Such high values of both W2 and χ2red are an indication of an important scattering of the LX values around the fitted relation.
Our results are in agreement with Possenti et al. (2002) and Kargaltsev & Pavlov (2008).
3.2. Study of the γ-Ray Luminosity
The gamma-ray luminosity, Lγ, is correlated with the pulsar spin-down luminosity  . Such a trend is expected in many theoretical models (see, e.g., Zhang et al. 2004; Muslimov & Harding 2003) and it is briefly discussed in the Fermi/LAT catalog of gamma-ray pulsars (Abdo et al. 2010a).
Selecting the same subsample of Fermi pulsars used in the previous chapter to assess the relation between Lγ and  , we found that a linear fit

yields a high value of χ2red = 4.2.
Inspection of the distribution of residuals leads us to try a double-linear relationship, which yields
with Ecrit = 3.72+3.55 − 3.44 × 1035 erg s−1 and χ2red = 2.2. An f-test shows that the probability for a chance χ2 improvement is 0.00011. Such a result is in agreement with the data reported in Abdo et al. (2010a) for the entire data set of Fermi γ-ray pulsars. Indeed, the χ2red obtained for the double-linear fit is better than that obtained for the LX– relationship. We obtain W2 = 0.344 for the double-linear
  relationship. Both the χ2red and W2 are in agreement with a little higher scatter in the
  graph. A difference between the X-ray and γ-ray emission geometries—that translates in different values of fγ and fX—could explain such a behavior.
The existence of an  has been posited from the theoretical point for different pulsar emission models. Revisiting the outer-gap model for pulsars with τ < 107 yr and assuming initial conditions as well as pulsars' birth rates, Zhang et al. (2004) found a sharp boundary, due to the saturation of the gap size, for
  . They obtain the following distribution of pulsars' γ-ray luminosities:


By assuming the fractional gap size from Zhang & Cheng (1997), they obtain  . While Equation (4) is similar to our double-linear fit (Equation (3)), the
  they obtain seems to be lower than our best-fit value.
On the other hand, in slot-gap models (Muslimov & Harding 2003), the break occurs at about 1035 erg s−1, when the gap is limited by screening of the acceleration field by pairs.
We can see from Figure 2 that radio-quiet pulsars have higher luminosities than the radio-loud ones, for similar values of  . As in the
  fit, we cannot however discriminate between the two population due to the big errors stemming from distance estimate.
3.3. Study of the γ-to-X-Ray Luminosity Ratio
At variance with the X-ray and gamma-ray luminosities, the ratio between the X-ray and gamma-ray luminosities is independent from pulsars' distances. This makes it possible to significatively reduce the error bars leading to more precise indications on the pulsars' emission mechanisms.
Figure 3 reports the histogram of the Fγ/FX values using only type-2 (high-quality X-ray data) pulsars. The radio-loud pulsars have 〈 Fγ/FX〉 ∼ 800 while the radio-quiet population has 〈 Fγ/FX〉 ∼ 4800. Applying the Kolmogorov–Smirnov (K-S) test to type-2 pulsars' Fγ/FX values, we obtained that the probability for the two data sets to belong to the same population is 0.0016. By using all the pulsars with a confirmed X-ray counterpart (i.e., including also type-1 objects), this probability increases to 0.00757. We can conclude, with a 3σ confidence level, that the radio-quiet and radio-loud data sets we used are somewhat different.
3.3.1. A Distance-independent Spread in Fγ/FX
Figure 4 shows Fγ/FX as a function of  for our entire sample of γ-ray-emitting neutron stars while in Figure 5 only the pulsars with "high-quality" X-ray data have been selected. Even neglecting the upper and lower limits (shown as triangles) as well as the low-quality points (see Figure 5), one immediately notices the scatter on the Fγ/FX parameter values for a given value of
  . Such an apparent spread cannot obviously be ascribed to a low statistic. An inspection of Figure 4 makes it clear that a linear fit cannot satisfactorily describe the data. In a sense, this finding should not come as a surprise since Figure 4 is a combination of Figures 1 and 2, and we have seen that Figure 2 requires a double-linear fit. However, combining the results of our previous fits (Equations (1) and (3)) we obtain the dashed line in Figure 4, clearly a very poor description of the data. For
  the Fγ/FX values scatter around a mean value of ∼1000 with a spread of a factor of about 100. For higher
  the values of Fγ/FX seem to decrease drastically to an average value of ∼50, reaching the Crab with Fγ/FX ∼0.1.

Figure 1.  –LX diagram for all pulsars classified as type 2 and with a clear distance estimation, assuming fX = 1 (see Equation (5)). Stars: radio-quiet pulsars; squares: radio-loud pulsars; circles: millisecond pulsars. The linear best fit of the logs of the two quantities is shown.
Download figure:
Standard image High-resolution image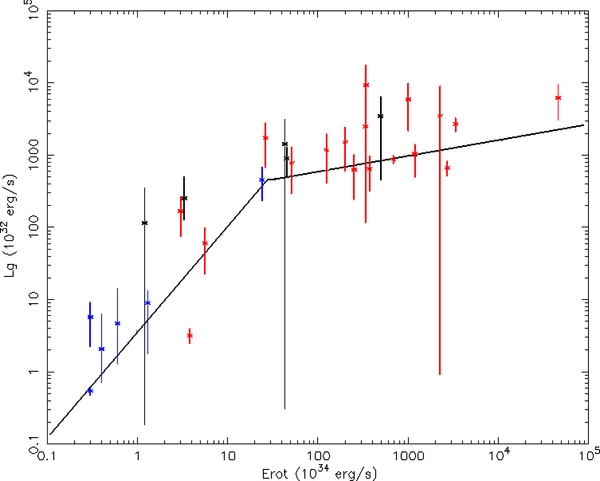
Figure 2.  –Lγ diagram for all pulsars classified as type 2 and with a clear distance estimation, assuming fγ = 1 (see Equation (5)). Stars: radio-quiet pulsars; squares: radio-loud pulsars; circles: millisecond pulsars. The double-linear best fit of the logs of the two quantities is shown.
Download figure:
Standard image High-resolution image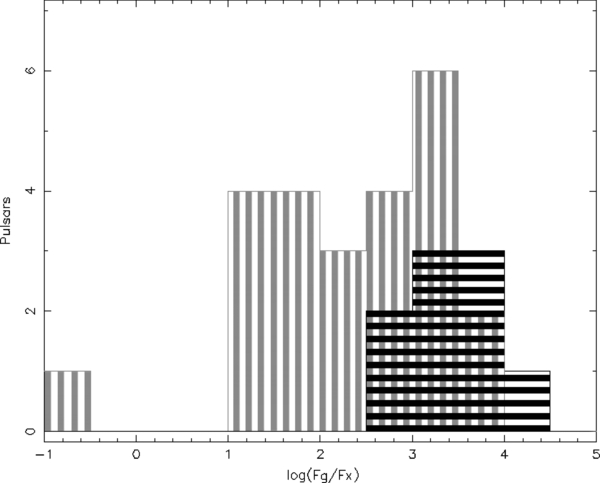
Figure 3. log(Fγ/FX) histogram. The step is 0.5; the radio-loud (and millisecond) pulsars are indicated in gray and the radio-quiet ones in black. Only high confidence pulsars (type 2) have been used for a total of 24 radio-loud and 9 radio-quiet pulsars.
Download figure:
Standard image High-resolution imageThe spread in the Fγ/FX values for pulsars with similar  is obviously unrelated to distance uncertainties. Such a scatter can be due to geometrical effects. For both X-ray and γ-ray energy bands,

where fX and fγ account for the X-ray and γ-ray beaming geometries (which may or may not be related). If the pulse profile observed along the line of sight at ζ (where ζE is the Earth line of sight) for a pulsar with magnetic inclination α is F(α, ζ, ϕ), where ϕ is the pulse phase, than we can write
where f depends only on the viewing angle and the magnetic inclination of the pulsar. With a high value of this correction coefficient, the emission is disfavored. Obviously Fγ/FX = Lγ/LX × fX/fγ. Different fγ/fX values for different pulsars can explain the scattering seen in the Fγ/FX– relationship.
Watters et al. (2009) assume a nearly uniform emission efficiency while Zhang et al. (2004) compute a significant variation in the emission efficiency as a function of the geometry of pulsars. In both cases, geometry plays an important role through magnetic field inclination as well as through viewing angle.
The very important scatter found for Fγ/FX values is obviously due to the different geometrical configurations which determine the emission at different wavelength of each pulsar. While geometry is clearly playing an equally important role in determining pulsar luminosities, the Fγ/FX plot makes its effect easier to appreciate.
The dashed line in Figures 4 and 5 is the combination of the best fits of Lγ– and LX–
 relationship, considering fγ = 1 and fX = 1 so that it represents the hypothetical value of Fγ/FX that each pulsar would have if fγ = fX: all the pulsars with a value of Fγ/FX below the line have fX < fγ. We have seen in Section 3.3 that the radio-quiet data set shows a higher mean value of Fγ/FX. This is clearly visible in Figure 5 where all the radio-quiet points are above the expected values (dashed line), so that all the radio-quiet pulsars should have fX > fγ. Moreover, the radio-quiet data set shows a lower scatter with respect to the radio-loud one pointing to more uniform values of fγ/fX for the radio-quiet pulsars. A similar viewing angle or a similar magnetic inclination for all the radio-quiet pulsars could explain such a behavior (see Equation (8)).
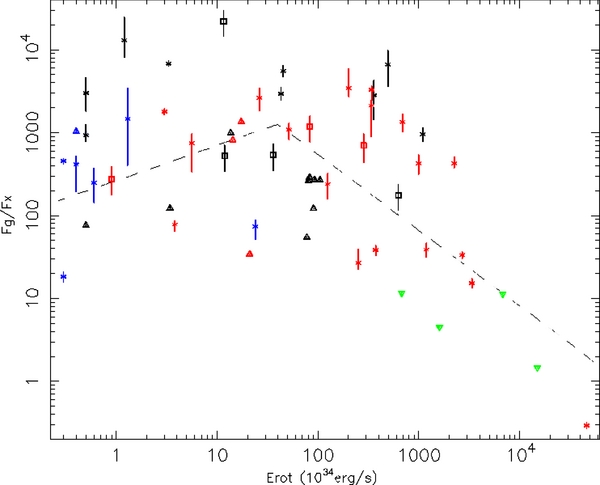
Figure 4.  –Fγ/FX diagram. Triangles: upper and lower limits; stars: radio-quiet pulsars; squares: radio-loud pulsars; circles: millisecond pulsars. The pulsars with a type-1 X-ray spectrum (see Table 2) are indicated in gray while in black are indicated pulsars with a high-quality X-ray spectrum. The dotted line is the combination of the best-fitting functions obtained for Figures 1 and 2 with the geometrical correction factor set to 1 for both the X-ray and γ-ray bands.
Download figure:
Standard image High-resolution image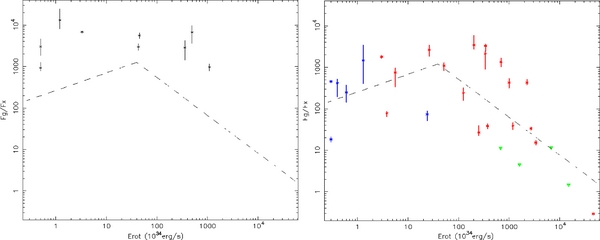
Figure 5.  –Fγ/FX diagram for high confidence pulsars only (type 2). Stars: radio-quiet pulsars; squares: radio-loud pulsars; circles: millisecond pulsars.
Download figure:
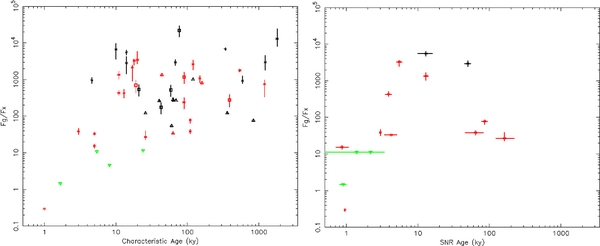
Standard image High-resolution imageFigure 6 shows the Fγ/FX behavior as a function of the characteristic pulsar age. In view of the uncertainty of this parameter, we have also built a similar plot using "real" pulsar age, as derived from the associated SNRs (see Figure 6). Similarly to the  relationship, for τ < 104 yr, Fγ/FX values increase with age (both the characteristic and real ones), while for t > 104 yr the behavior becomes more complex.
Figure 6. Left: characteristic age–Fγ/FX diagram. Right: SNR age–Fγ/FX diagram. Triangles: upper and lower limits; stars: radio-quiet pulsars; squares: radio-loud pulsars; circles: millisecond pulsars. The pulsars with a type-1 X-ray spectrum (see Table 3) are indicated in gray while in black are indicated pulsars with a high-quality X-ray spectrum.
Download figure:
Standard image High-resolution image
3.4. Study of the Selection Effects
There are two main selections we have done in order to obtain our sample of pulsars with both good γ-ray and X-ray spectra (type 2). First, the two populations of radio-quiet and radio-loud pulsars are unveiled with different techniques: using the same data set, pulsars with known rotational ephemerides have a detection threshold lower than pulsars found through blind period searches. In the First Fermi/LAT pulsar catalog (Abdo et al. 2010a), the faintest gamma-ray-selected pulsar has a flux ∼3× higher than the faintest radio-selected one. Second, we chose only pulsars with a good X-ray coverage. Such a coverage depends on many factors (including the policy of X-ray observatories) that cannot be modeled.
Our aim is to understand if these two selections influenced in different ways the two populations of pulsars we are studying: if this was the case, the results obtained would have been distorted. The γ-ray selection is discussed at length in the Fermi/LAT pulsar catalog (Abdo et al. 2010a). Since the radio-quiet population obviously has a detection threshold higher than the radio-loud, we could avoid such bias by selecting all the pulsars with a flux higher than the radio-quiet detection threshold (6 × 10⁻⁸ photon cm−2 s−1). Only five radio-loud type-2 pulsars are excluded (J0437−4715, J0613+1036, J0751+1807, J2043+2740, and J2124−3358) with Fγ/FX values ranging from 87 to 1464. We performed our analysis on such a reduced sample and the results do not change significantly.
We can, therefore, exclude the presence of an important bias due to the γ-ray selection on type-2 pulsars.
In order to roughly evaluate the selection affecting the X-ray observations, we used the method developed by Schmidt (1968) to compare the current radio-quiet and radio-loud samples' spatial distributions, following the method also used in Abdo et al. (2010a). For each object with an available distance estimate, we computed the maximum distance still allowing detection from Dmax = Dest(Fγ/Fmin)1/2, where Dest comes from Table 1, the photon flux and Fmin are taken from Abdo et al. (2010a) and Saz Parkinson et al. (2010). We limited Dmax to 15 kpc, and compared V, the volume enclosed within the estimated source distance, to that enclosed within the maximum distance,Vmax, for a galactic disk with radius 10 kpc and thickness 1 kpc (as in Abdo et al. 2010a). The inferred values of 〈 V/Vmax〉 are 0.462, 0.424, 0.443, and 0.516 for the entire gamma-ray pulsars' data set, the radio-quiet pulsars, millisecond pulsars, and the radio-loud pulsars. These are quite close to the expected value of 0.5 even if 〈 V/Vmax〉rq is lower than 〈 V/Vmax〉rl. If we use only type-2 pulsars we obtain 0.395, 0.335, 0.462, and 0.419. These lower values of 〈 V/Vmax〉 indicate that we have a good X-ray coverage only for close-by—or very bright—pulsars, not a surprising result. By using the X-ray-counterpart data set, both the radio-loud and radio-quiet 〈 V/Vmax〉 values appear lower of about 0.1: this seems to indicate that we used the same selection criteria for the two populations and we minimized the selection effects in the histogram of Figure 3.
We can conclude that the γ-ray selection introduced no changes in the two populations, while the X-ray selection excluded objects both faint and/or far away; any distortion, if present, is not overwhelming.
Only if deep future X-ray observations centered on radio-quiet Fermi pulsars fail to unveil lower values of Fγ/Fx, it will be possible to be sure that radio-quiet pulsars have a different geometry (or a different emission mechanism) than radio-loud ones.
4. CONCLUSIONS
The discovery of a number of radio-quiet pulsars comparable to that of radio-loud ones together with the study of their X-ray counterparts made it possible, for the first time, to address their behavior using a distance-independent parameter such as the ratio of their fluxes at X-ray and gamma-ray wavelengths.
First, we reproduced the well-known relationship between the neutron star luminosities and their rotational energy losses. Next, selecting only the Fermi pulsars with good X-ray data, we computed the ratio between the gamma-ray and X-ray fluxes and studied its dependence on the overall rotational energy loss as well as on the neutron star age.
Much to our surprise, the distance-independent Fγ/FX values computed for pulsars of similar age and energetic differ by up to three orders of magnitude, pointing to important (yet poorly understood) differences both in position and height of the regions emitting at X-ray and γ-ray wavelengths within the pulsars magnetospheres. Selection effects cannot account for the spread in the Fγ/FX relationship and any further distortion, if present, is not overwhelming.
In spite of the highly scattered values, a decreasing trend is seen when considering young and energetic pulsars. Moreover, radio-quiet pulsars are characterized by higher values of the Fγ/FX parameter (〈 Fγ/FX〉rl ∼ 800 and 〈 Fγ/FX〉rq ∼ 4800), so that a K-S test points to a probability of 0.0016 for them to belong to the same population as the radio-loud ones. While it would be hard to believe that radio-loud and radio-quiet pulsars belong to two different neutron star populations, the K-S test probably points to different geometrical configurations (possibly coupled with viewing angles) that characterize radio-loud and radio-quiet pulsars. Indeed the radio-quiet population we analyzed is less scattered than the radio-loud one, pointing to a more uniform viewing or magnetic geometry of radio-quiet pulsars.
Our work is just a starting point, based on the first harvest of gamma-ray pulsars. The observational panorama will quickly evolve. The gamma-ray pulsar list will certainly grow and this will trigger more X-ray observations, improving both in quantity and quality the database of the neutron stars detected in X-rays and γ-rays to be used to compute our multiwavelength, distance-independent parameter. However, to fully exploit the information packed in Fγ/FX, a complete three-dimensional modeling of the pulsar magnetosphere is needed to account for the different locations and heights of the emitting regions at work at different energies. Such modeling could provide the clue to account for the spread we have observed for the ratios between γ-ray and X-ray fluxes as well as for the systematically higher values measured for radio-quiet pulsars.
XMM data analysis is supported by contracts ASI-INAF I/088/06/0 and NASA NIPR NNG10PL01I30. Chandra data analysis is supported by INAF-ASI contract n.I/023/05/0. It is a pleasure to thank Niel Gehrels for granting Swift observations of the newly discovered Fermi pulsar. We also thank Pablo Saz Parkinson and Andrea Belfiore for the collaboration in searching for X-ray counterparts of radio-quiet pulsars.