


ABSTRACT
We present a detailed study of a coronal mass ejection (CME) with high temporal cadence observations in radio and extreme-ultraviolet (EUV). The radio observations combine imaging of the low corona with radio spectra in the outer corona and interplanetary space. The EUV observations combine the three points of view of the STEREO and SOHO spacecraft. The beginning of the CME initiation phase is characterized by emissions that are signatures of the reconnection of the outer part of the erupting configuration with surrounding magnetic fields. Later on, a main source of emission is located in the core of the active region. It is an indirect signature of the magnetic reconnection occurring behind the erupting flux rope. Energetic particles are also injected in the flux rope and the corresponding radio sources are detected. Other radio sources, located in front of the EUV bright front, trace the interaction of the flux rope with the surrounding fields. Hence, the observed radio sources enable us to detect the main physical steps of the CME launch. We find that imaging radio emissions in the metric range permits us to trace the extent and orientation of the flux rope which is later detected in interplanetary space. Moreover, combining the radio images at various frequencies with fast EUV imaging permits us to characterize in space and time the processes involved in the CME launch.
Export citation and abstract BibTeX RIS
1. INTRODUCTION
The kinematic evolution of coronal mass ejections (CMEs) associated with flares is typically described in four phases: buildup, initiation, impulsive, and propagation phases. These phases almost coincide with the energization, pre-flare, rise, and decay phases of solar flares (Zhang et al. 2001). During the buildup phase the magnetic configuration is stressed by photospheric motions (including the emergence of new magnetic flux), and the free magnetic energy increases. The initiation phase refers to a period of slow ascension of the magnetic configuration and it has a smoother and lower acceleration than the impulsive phase. The impulsive phase is characterized by fast acceleration and expansion. Its onset occurs almost simultaneously with the flare's onset. During this phase, the CME acceleration is temporally correlated with the hard X-ray flux and the derivative of the soft X-ray flux of the solar flare (Zhang et al. 2004; Temmer et al. 2010; Milligan et al. 2010). After complete acceleration, the CME travels at a nearly constant speed or with a smooth deceleration (propagation phase).
Most CME initiation models are based on the premise that the CME/flare derives energy from the coronal magnetic field (e.g., Forbes et al. 2006). The magnetic energy is built up by shearing motions, flux emergence, flux cancellation, and sunspot rotations during the buildup phase (e.g., see Aulanier et al. 2010, and references therein). Then, part of the free magnetic energy is transferred to the CME/flare during the initiation and acceleration phases (e.g., Gopalswamy et al. 2006). Magnetic reconnection plays a key role in the processes of CMEs and flares, both in releasing part of the stored magnetic energy and in transforming the erupting configuration (buildup of a flux rope from a sheared arcade).
Recently, several investigations have confirmed the presence of large-scale narrow structures behind an erupting CME, which are suggestive of a current sheet (Schwenn et al. 2006). Ciaravella et al. (2002) and Ko et al. (2003) have reported narrow, bright features in Fe xviii at 974 Å with spectroscopic observations. They concluded that a current sheet is present behind the CME. Webb et al. (2003) have analyzed the bright rays of CMEs recorded by Solar Maximum Mission (SMM) spacecraft, including their heights, lengths, widths, alignments, and motions, all as functions of time. They found that these bright rays are consistent with the existence of current sheets lasting for several hours and extending more than five solar radii into the outer corona.
Pick et al. (2005) have analyzed the multi-wavelength radio images from the Nançay Radio Heliograph (NRH) to trace the dynamic evolution of the reconnecting current sheet behind an ejected flux rope on 2002 June 2. The peak fluxes of both the quasi-stationary source (located below) and the fast-moving radio source (located above) were coincident with the hard X-ray flux, which suggested that the energetic electrons producing both bursts were coming from the same acceleration site. The quasi-stationary source was produced by the particles injected downward, while the fast-moving source was emitted by the particles injected upward. The two radio sources are plausibly located at the top of the flare loops and at the border of the twisted flux rope, respectively. This provides an upper length estimation of the current sheet. Finally, Aurass et al. (2009) also provided indirect diagnosis of the presence of a current sheet both with X-ray and radio sources observed in the 2002 May 17 CME/flare.
Kuperus (1974) first proposed a flux rope configuration to explain the inverse polarity of a prominence. Since then, many studies have focused on observational evidence and modeling of magnetic flux rope configurations (e.g., van Ballegooijen & Martens 1989; Forbes & Isenberg 1991; Chen 1996; Lin et al. 2000; Chen et al. 2001). Flux ropes partially emerge from the convective zone during the formation of active regions (ARs; e.g., Archontis & Hood 2010, and references therein). However, a more common way of flux rope formation in the corona is via shearing and converging motions around a polarity inversion line (PIL) of the photospheric magnetic field. Such motions induce magnetic reconnection which transforms a sheared arcade into twisted field lines, thus building a flux rope (e.g., Amari et al. 2003; Mackay & van Ballegooijen 2006). Such a configuration can support the dense plasma of a filament (e.g., Aulanier & Démoulin 1998; Guo et al. 2010) before becoming unstable at some point of its evolution and forming a CME (e.g., Forbes et al. 2006; Aulanier et al. 2010, and references therein).
In order to set further observational constraints on the CME mechanism, we analyzed the well-documented CME/flare event of 2008 April 26. This CME was previously analyzed using a density model defined by two shells of plasma: the first one has a hemispherical shape, while the second one has a flux rope geometry and is located on the concave side of the first one. The comparison of the model with the coronagraphic observations of the Solar Terrestrial Relations Observatory (STEREO) permits us to estimate the free parameters of the model, such as the launch direction of the CME (Thernisien et al. 2009; Wood & Howard 2009). They found that the CME consists of two elements: an internal structure outlining the shape of a flux rope and a bright leading edge outlining the shock ahead of the CME. Cheng et al. (2010) have presented a multi-wavelength analysis of this CME/flare event and separate the full evolution of the CME into four phases: buildup, initiation, main acceleration, and propagation phases.
To complement previous studies of this CME/flare event, we provide additional diagnostics obtained from radio observation combined with MDI/SOHO and EUVI/STEREO images. We provide further diagnosis of the initiation and early development of this CME. A summary of the event and a description of the analyzed data are presented in Section 2. Section 3 presents the interpretation of the observations. Finally, the discussion and conclusion are provided in Section 4.
2. OBSERVATIONS OF THE 2008 APRIL 26 EVENT
2.1. Instruments
The radio images are provided by the multifrequency NRH at four frequencies (432, 327, 228, and 150.9 MHz; Kerdraon et al. 1997). The radio spectral data are obtained by the Nançay Decameter Array (DAM; Lecacheux 2000) in the frequency range 70–20 MHz and by the WIND/WAVES spectrometer (Bougeret et al. 1995) in the frequency range 13.8 MHz–20 kHz.
STEREO consists of two spacecraft drifting ahead of and behind the Earth in their orbit. The separation of the two spacecraft enables us to monitor CMEs from two different perspectives. On 2008 April 26, the A and B spacecraft were, respectively, ≈24° ahead and ≈−26° behind from the Earth. The Extreme Ultraviolet Imager (EUVI) is part of the Sun–Earth Connection Coronal and Heliospheric Investigation (SECCHI) instrument on board the STEREO spacecraft. EUVI observes the solar chromosphere and the lower corona at four frequencies ("wavelengths") with high temporal and spatial resolutions (Howard et al. 2008). We used only the 171 Å channel because of the high cadence (150 s) available during this event.
The emission of coronal loops is also analyzed using data from the SOHO/EUV Imaging Telescope (EIT; Delaboudinière et al. 1995). Full-Sun maps of the longitudinal magnetic field in the photosphere are provided by the Michelson Doppler Imager (MDI) on board SOHO (Scherrer et al. 1995).
The soft X-ray light curves at 1–8 Å are obtained from the Geostationary Operational Environmental Satellite (GOES) spacecraft. The X-ray emissions are imaged over a broad energy range by the Reuven Ramaty High-Energy Solar Spectroscopic Imager (RHESSI; Lin et al. 2002).
2.2. Overview of the 2008 April 26 Event
Figure 1 shows, in a broad frequency range, the evolution with time of the dynamic radio spectrum (70–0.05 MHz) and of the radio flux measured by the NRH at 432, 327, 236, and 150.9 MHz (no spectral observation is available at these frequencies). The bottom plot shows the time profile of the soft (1–8 Å; GOES) X-ray flux. This CME event is associated with a B 3.8 soft X-ray flare, i.e. a weak flare which has no detectable hard X-rays. The flare starts before 13:54 UT and peaks at 14:08 UT in soft X-rays.
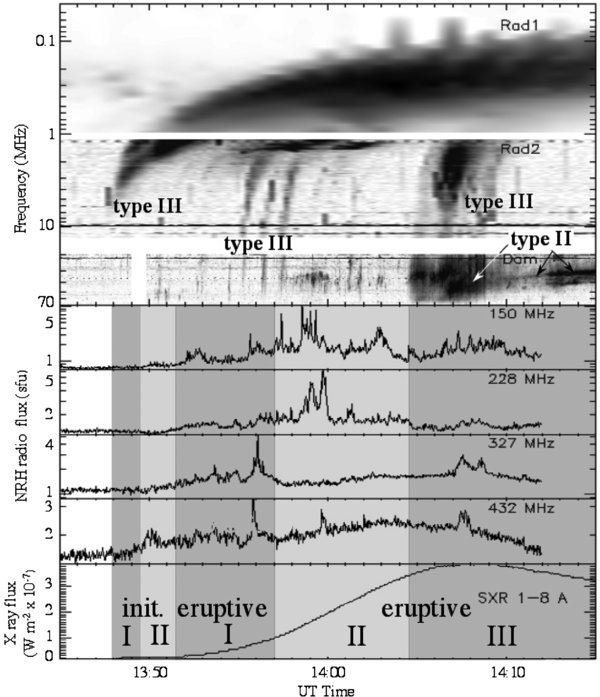
Figure 1. From top to bottom: the radio spectrum from WIND/WAVES (RAD 1 and RAD 2) and from DAM, the radio flux at 150.9, 228, 327, and 432 MHz from NRH/Nançay, and the soft X-ray flux at 1–8 Å. The vertical-axis scale for radio observations is logarithmic. The five phases of the radio bursts are outlined in gray.
Download figure:
Standard image High-resolution imageAccording to the evolution of the radio and X-ray emissions, we distinguish two main phases: the initiation and eruptive ones. The onset of the initiation phase is characterized by the occurrence of an interplanetary type III burst. During this phase a few radio sources, only detected at 432 MHz, are seen on the images (Figure 2). However, these sources are too weak to be seen on the total flux curve (Figure 1). Later on, the radio emission increases progressively at 432 and 327 MHz. The eruptive phase starts with an increase of the soft X-ray flux and of the radio flux in the four NRH channels. This increase is accompanied by a few interplanetary type III bursts that are also detected in the DAM frequency range. A strong sporadic activity starts in the DAM frequencies around 13:57 UT. This is followed by the buildup of a coronal type II burst and of a group of type III bursts (after ≈14:05 UT). We shall see in the next sub-sections that the spatial evolution of the radio sources leads us to distinguish two parts (I and II) in the initiation phase and three parts (I, II, and III) in the eruptive phase.

Figure 2. Initiation phase I. The centers of the radio sources (orange crosses at three times) are overplotted (a) on the magnetogram from MDI, and (b) on EUV based-difference image from STEREO-B rotated to the Earth viewpoint. The soft X-ray source centroid at 3–12 keV, integrated from 13:53:00 UT to 13:54:00 UT (eruptive phase I), is indicated with a yellow cross as the reference of the main region of the solar flare. In this figure, and all the following ones, the Stonyhurst system of coordinates as seen from Earth is used.
Download figure:
Standard image High-resolution imageThe observations of STEREO-A and B are rotated toward the SOHO point of view before comparison with the EIT images and identifying the relative position of the radio sources. The EUVI image taken at 13:41:00 UT is the base of our base-difference images. During this CME/flare event, the MDI magnetogram nearest in time is at 14:24:00 UT. The temporal difference between MDI and NRH data introduces a spatial shift that has been corrected.
2.3. The Initiation Phase I
The most striking feature of this phase is the presence of an interplanetary type III burst which starts at about 8 MHz (Figure 1). A burst source, observed by the NRH at 432 MHz, is located at the southern border of the negative magnetic polarity (Figure 2(a)). The time duration of this radio source, from 13:47:58 UT to 13:49:31 UT, defines the extent of the initiation phase I. The radio source is located above the northern end of bright EUV loops located at the south of the AR (Figure 2(b)). This base-difference image shows a slight increase of the loop brightness, in time coincidence with the radio source.
The EUVI base-difference images also show the presence of a bright front around a pair of dimmings, as well as brightenings around the PIL. These features are characteristics of CME initiation.
2.4. The Initiation Phase II
At 13:49:37 UT, the flux increases at 432 MHz by a factor up to ≈1.5 (Figure 1). This corresponds to a new radio source located over the PIL of the AR (Figure 3(a)) between the two dimmings (Figure 3(b)). Since this source is located in the internal part of the AR we call it IN. After about 50 s, a 327 MHz source is located at a similar location. During the period from 13:49:31 to 13:51:30 UT, the radio bursts are mainly present at these two high frequencies and the locations are almost stationary. This defines the initiation phase II.
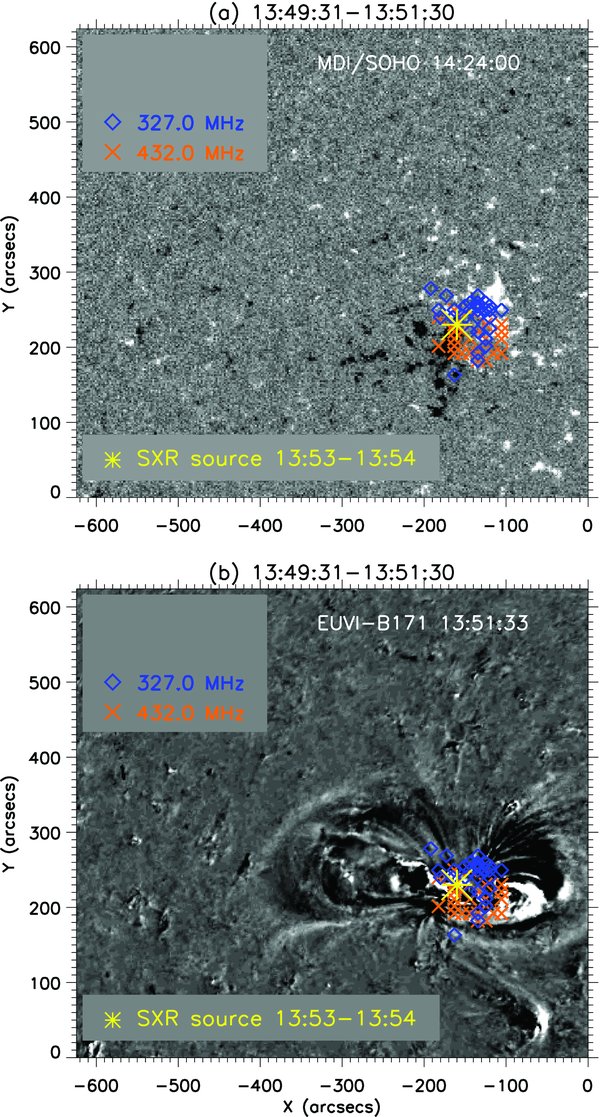
Figure 3. Initiation phase II. The centers of the radio sources (symbols) are overplotted (a) on the magnetogram from MDI, and (b) on EUV based-difference image from STEREO-B rotated to the Earth viewpoint. The position of the source centers is measured every 1 s. There is no coherent shift of centers with time. The plotting format is the same as in Figure 2.
Download figure:
Standard image High-resolution imageIn EUV, this phase is seen mostly as a continuation of the previous one, so EUV observations have not sufficient cadence to respond to the change of location for this weak energy release (Figure 3(b)). Finally, in the interplanetary frequency range, this phase has no new radio emission.
2.5. The Eruptive Phase I
This phase, from 13:51:30 UT to 13:57:00 UT, is characterized by an increase of the radio fluxes at the four NRH frequencies (Figure 1). Several type III bursts are detected in the radio spectrum at DAM and WAVES frequencies at the end of this phase. The distribution of the radio sources observed at the four NRH frequencies overlies the AR magnetic field and is aligned along a dominant east–west direction (Figure 4).
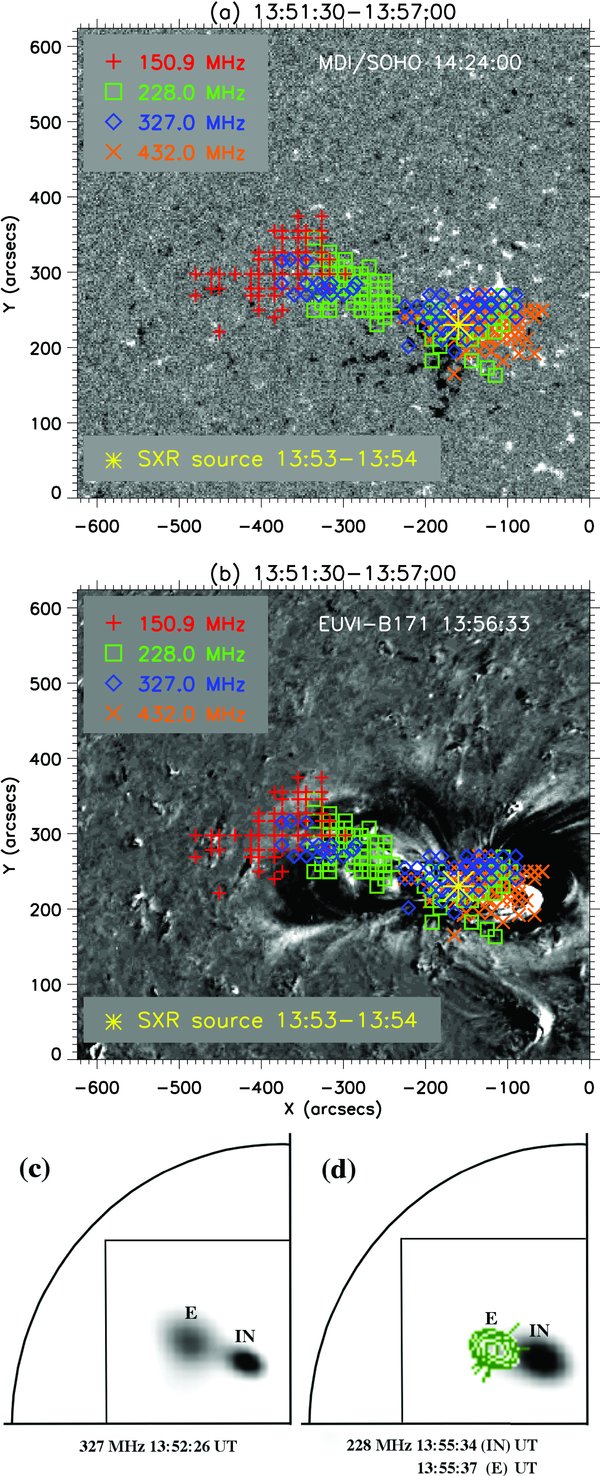
Figure 4. Eruptive phase I. (a, b) These panels are shown with the same format as Figures 2 and 3, with the difference that radio sources are seen at four radio frequencies. (c, d) The radio flux with gray levels or with isocontours on one quarter of the Sun. The field of view of panels (a, b) is indicated.
Download figure:
Standard image High-resolution imageMore precisely, the mean location of the source at 432 MHz is the same as in the initiation phase II (source IN) and is near the soft X-ray source. Double sources are observed at both 327 MHz and 228 MHz (Figures 4(c) and (d)). One is close to source IN and the other one is located in the east part of the AR, so we called it the source E. With an Earth viewpoint, Figure 4(b) shows that most of the radio sources at 150.9 MHz are located, in projection, above the observed EUV bright front, and a few sources are located ahead of the front (which is moving eastward).
All together the radio sources are aligned along the direction that joins the dimming pair. The IN sources are observed at all NRH frequencies, except 150.9 MHz, and the source positions are not significantly dependent on the frequency. The E sources are observed at all NRH frequencies, except 432 MHz; their positions at 150.9 MHz are on average located eastward of the positions at 228 MHz. However, at both frequencies, their distributions overlap the sources at 327 MHz. Then the IN sources trace the internal energy release, while the E sources trace the erupting magnetic configuration.
2.6. The Eruptive Phase II
In the time interval 13:57:00–14:04:30 UT, very few type III-like bursts are observed in the 70–20 MHz frequency range; these bursts are barely detected by the WIND/WAVES instrument. The most significant spectral evolution is the appearance of bursty activity of narrow bandwidth around 35 MHz (Figure 1). Details of this activity are shown on an expanded timescale in Figure 5. This figure displays the DAM spectrum, the corresponding integrated radio flux in the 30–50 MHz frequency range and the flux at 150 MHz. This phase is also characterized by the evolution of the radio sources observed by the NRH, as summarized in Figure 6.
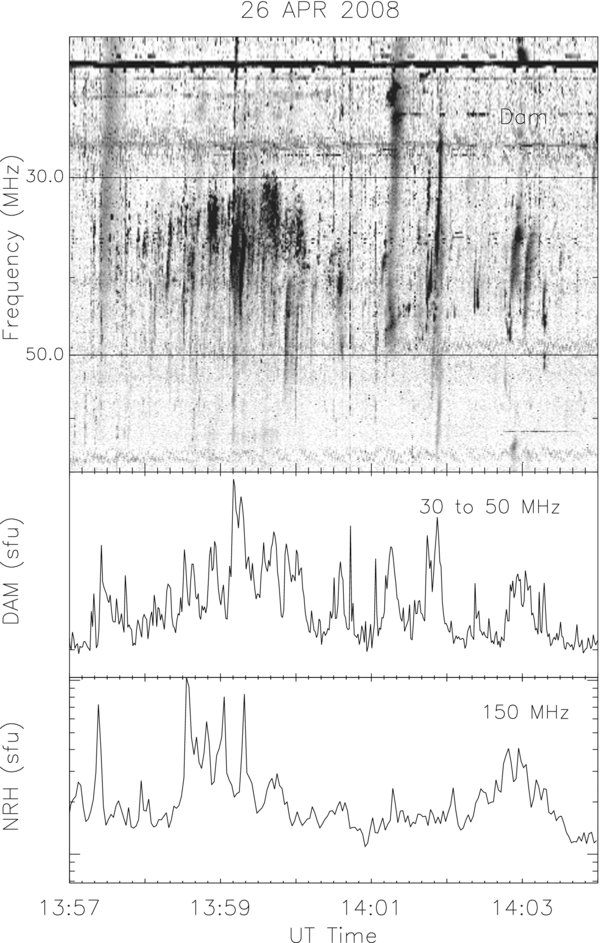
Figure 5. Time evolution of the radio emission during the eruptive phase II. From the top to the bottom: the radio spectrum from DAM, the radio flux integrated from 30 to 50 MHz and at 150.9 MHz.
Download figure:
Standard image High-resolution image
Figure 6. Erupting phase II. Time evolution of the radio source centers is overplotted on EUV based-difference image from STEREO-B. There were three groups of radio sources: the internal (IN), the south (S), and the north (N) ones, as labeled in panel (b).
Download figure:
Standard image High-resolution imageSimilarly to the previous two phases, there are almost stationary radio sources over the PIL located near the soft X-ray source (sources IN, Figure 6). However, at 228 and 150.9 MHz, two newer groups of sources appear as marked in Figure 6(b). One is located at the southeast of the AR (called S). The other one is located at the northeast of the AR (called N). We note that there was a spatial gap between the sources E of the previous phase and the new sources N at both 228 MHz and 150.9 MHz; hence, the sources N are newer ones.
Figure 7(a) shows that at 228 MHz, the brightness temperatures of both N and S sources are correlated when both of them are detected. The flux evolution has several main episodes of emission. The S sources are more intense than the N sources. This very variable radio emission is also present at 150.9 MHz during the entire time interval of the eruptive phase II.
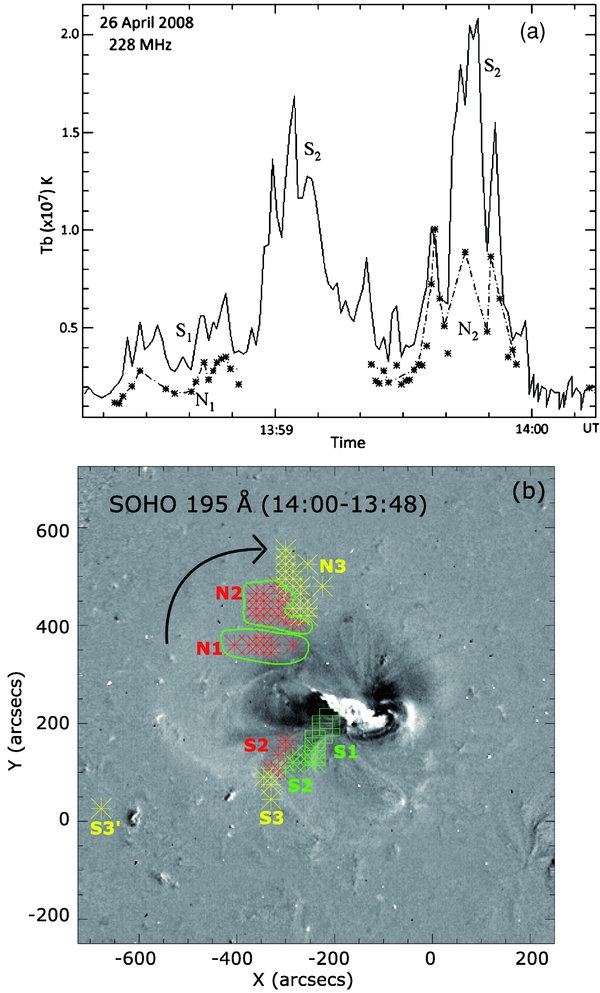
Figure 7. Eruptive phases II and III. (a) Time correlation between the brightness temperatures of the N (asterisks and dash-dotted line) and S (continuous line) sources at 228 MHz detected during two intervals of Eruptive phase II. (b) Positions at successive times of the radio sources N (see the arrow) and S overplotted on an EIT 195 Å difference image. Eruptive phase II: the red and green colors refer to the sources observed at 150.9 and 228 MHz, respectively. As the projected positions at the two frequencies coincide, we have simply indicated N1 and N2 at 228 MHz by a green contour. At 228 MHz, N1 and N2 correspond to the first and second periods (see panel (a)) in which these sources are correlated with sources S1 and S2. At 150.9 MHz, the N sources are present during the entire time interval of this phase, while there is no S1 source during the N1 time interval. Eruptive phase III: N3 and S3–S3' are exclusively detected at 150.9 MHz (yellow color).
Download figure:
Standard image High-resolution imageIn Figure 7(b), the sources N1 and N2 at 150.9 MHz (red stars) move toward the northwest (indicated by an arrow). At 228 MHz, the sources N1 and N2 have the same projected positions as at 150.9 MHz. Simultaneously the sources S1 at 228 MHz (green square) and S2 at 228 and 150.9 MHz (green and red stars) move toward the southeast. This evolution trend continues at 150.9 MHz for N3 in the eruptive phase III (yellow stars).
2.7. The Eruptive Phase III
The radio spectrum changes suddenly after 14:04:30 UT (Figure 1), as summarized below.
A coronal type II burst is present at DAM frequencies, while it is later not detected below 10 MHz (not shown). Two groups of type III bursts are observed in the DAM and WIND/WAVES data (Figure 1). They are also detected at 150.9 MHz. Their positions measured at 150.9 MHz coincide with the sources called N3 and S3–S3' in Figure 7(b). The direction finding capabilities of the WIND/WAVES receiver (Manning & Fainberg 1980) also show that the N3 bursts are observed in an azimuthal direction of the order of 5° and with an elevation angle measured from the ecliptic plane of about 5° (courtesy of S. Hoang 2010, private communication), so the IP type III bursts are coming from a solar source located to the northeast. A few bursts are observed at 150.9 MHz at 14:06:20 UT during about 15 s in the sources called S3 (Figure 7(b)). A new sporadic source S3' at 150 MHz is detected from 14:06:51 UT to 14:07:16 UT. This time coincides precisely with the onset of the type II burst and the strong type III-like emission seen by WIND/WAVES. Note that S3' is located in projection near the EUV bright/dark features in Figure 7. The comparison in time with STEREO-A running differences EUVI and COR1 images (Figure 8; see also Figure 5 of Cheng et al. 2010) strongly suggests that this type II burst is associated with the onset of the coronal wave near the southern flank of the CME. This is coherent with Cheng et al. (2010) who noted that, during the CME eruption, a streamer disturbance was triggered at the southern side as indicated by a black arrow in the running difference image (14:25–14:15 UT) shown in their Figure 5.
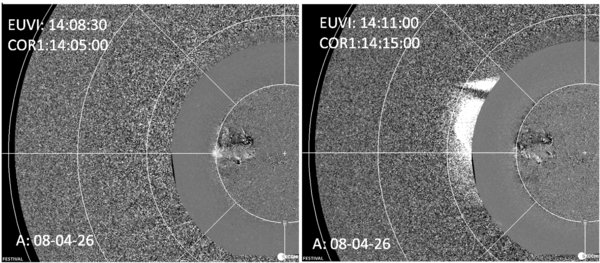
Figure 8. Eruptive phase III. STEREO-A running difference EUVI and COR1 images at two times.
Download figure:
Standard image High-resolution image3. ANALYSIS AND RESULTS
3.1. Global Evolution of the Active Region
ARs are formed by new magnetic flux coming from the convective zone. After a time period of a few days to a week, this magnetic flux starts to be dispersed by the convective motions. This flux dispersion leads to convergent flows toward the PIL, increasing the magnetic shear and forcing flux cancellation (e.g., van Driel-Gesztelyi & Culhane 2009, and references therein). From various observations, this flux cancellation is one of the primary features associated with flares and CMEs (Livi et al. 1989; Kosovichev et al. 2001; Somov et al. 2002; Lin et al. 2004; Wang 2006).
3.2. Initiation Phase I: Decrease of Magnetic Tension
In the studied AR, Cheng et al. (2010) have found a continuous flux cancellation near the PIL lasting for several days. Such cancellation implies the buildup of a flux rope with coronal loops transformed by reconnection into S-shaped loops (e.g., Moore et al. 1995; Green & Kliem 2009). This also implies that the whole AR magnetic configuration increases in size (since the reconnection of sheared field lines removed one anchorage to the photosphere; see, e.g., the MHD simulations of Aulanier et al. 2010, and references therein). This expanding magnetic configuration is expected to reconnect with the surrounding magnetic field (e.g., see Baker et al. 2009, and references therein).
In order to determine the surrounding magnetic field, the potential field extrapolation of the longitudinal photospheric field from Mount Wilson Observatory is computed with a source surface at 2.5 R☉ (Wang & Sheeley 1992). We find an open positive flux westward of the AR, as shown by the example of the enhanced blue field line in Figure 9(b). As the AR core magnetic field is expanding (as shown by the bright front and dimming appearance), a current sheet is necessarily formed in between the core field and the open flux passing on the side and above the AR because both magnetic fields have a large difference of orientation and they are pushed against each other. At some point of the evolution, when the current sheet is too extended, magnetic reconnection occurs as found in the MHD simulation studied by Masson (2010).
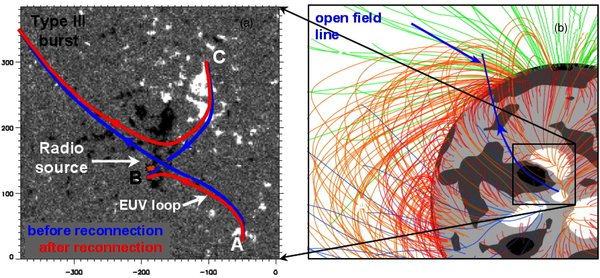
Figure 9. Initiation phase I. (a) Sketch of the magnetic field structure. The original coronal and open field lines (blue lines) reconnect and are transformed to the red field lines. During the reconnection process, electrons are accelerated and propagate along the new connections. The newer loop (red line) is the EUV loop recorded by the EUVI/STEREO-B (Figure 2(b)) and the accelerated electrons traveling along the newer open line produced the type III burst (Figure 1). (b) The potential magnetic field computed from the photospheric magnetogram (courtesy of Y.-M. Wang). The blue open field line, corresponding to the open field line of the left panel, is enhanced.
Download figure:
Standard image High-resolution imageFrom the observed photospheric evolution (flux cancellation; Cheng et al. 2010), the computed coronal magnetic field and the present theoretical knowledge on magnetic reconnection, we deduce the following theoretical scenario, illustrated in Figure 9(a). As the AR core field grows in size, the magnetic connections located at the external border of the core, i.e. between the positive (C) and negative (B) polarities, reconnect with the open field lines anchored at the positive polarity (A) outside the AR. An example of these pre-reconnection field lines is shown in Figure 9(a) with blue field lines (a closed one connecting C to B and an open one anchored at A). A pair of reconnected field lines is shown in red.
Next we confront the above theoretical expectations to the coronal observations which trace the consequences of energy input in both sets of reconnected field lines. As expected, the open reconnected field lines have no counterpart in EUV because the volume of the associated magnetic flux tubes is too large to permit a significant increase of plasma density after the heat input (since the EUV emission depends on the square of the density). However, the close reconnected field lines are seen in EUV as a faint loop (Figure 2(b)). The loop is formed by both evaporation and heating of chromospheric plasma to coronal temperatures. Moreover, a source at 432 MHz is cospatial with the northern footpoint of the faint EUV loop (Figure 2(b)). This source is probably a consequence of the non-thermal electrons accelerated during the reconnection and propagating downward. The non-thermal electrons traveling upward along the newer open field lines produce the type III burst when the conditions for radiation emission are met. It starts at about 8 MHz, which corresponds typically to a radial distance of 2–3 solar radii (Leblanc et al. 1998).
In summary, the magnetic reconnection scenario, expected theoretically, is supported by the observed evidence of the energy input in the coronal plasma: a radio source on the footpoint of an EUV loop and interplanetary type III bursts.
This reconnection reduces the downward magnetic tension, so it decreases the stabilizing effect of the upper magnetic arcade located over the AR. This is expected to favor the later eruption of the core magnetic field located below the arcade. This is similar to the breakout model proposed by Antiochos et al. (1999) in a closed quadrupolar configuration, but here it involves open fields for the larger-scale connectivity region. However, from the observations we cannot tell if this process contributes only marginally or if this process is rather a key process in the initiation of the eruption.
3.3. Initiation Phase II: Further Buildup of the Flux Rope
Magnetic flux cancellation was detected at the PIL of the AR during a few days before this CME (Cheng et al. 2010). The coronal activity associated with this slow reconnection is typically difficult to detect. However, Cheng et al. (2010) reported several jets and activity in the filament located over the PIL, up to two days before the CME. They also reported EUV brightenings 1 hr before the eruption starts. Just at the beginning of initiation phase II, a radio source, called IN, is observed at 432 MHz over the PIL, where flux cancellation was observed. However, this new radio source indicates a location in the low corona rather than in the photosphere, which implies that a newer reconnection occurred. Indeed, such reconnection is expected to start behind an erupting flux rope since a current sheet is formed above the PIL in MHD models (e.g., van Ballegooijen & Martens 1989; Forbes & Isenberg 1991; Amari et al. 2000). Such reconnection continues the transformation of the sheared arcade to twisted field lines (as also present in the pre-eruptive phase due to flux cancellation). Then, the magnetic flux involved in the flux rope is expected to significantly grow during the initiation phase (as well as later on).
After about 50 s, the radio burst at 327 MHz appears at the same location. The shifting of the radio burst from high frequency to lower frequency implies a lower plasma density for a radio emission occurring at the plasma frequency (or its harmonic). Since the density is typically decreasing with height, this is an indication that the reconnection site is moving to greater heights as expected in the above MHD erupting models, and in agreement with the observed growing of flare loops (formed below the reconnection site).
3.4. Eruptive Phase I: Acceleration of the CME
The eruptive phase I is characterized by the appearance of new radio sources E at 327 MHz, 228 MHz, and 150.9 MHz (Figure 4), while the source IN was continuously present at 432, 327, and 228 MHz. This phase is also characterized by a peak in the acceleration of the CME leading edge (see Figure 7 of Cheng et al. 2010) and by the development of strong twin dimmings.
In another CME, observed on 2002 June 2, Pick et al. (2005) concluded that both observed radio sources are due to the accelerated particles in or near the reconnecting current sheet located below the erupting flux rope for a CME which was a limb event. We propose the same mechanism for the present event. A part of these particles is expected to be accelerated downward creating the IN radio source, while the other part is injected upward, at the border of the flux rope, creating the eastward radio sources E (Figure 4). However, as described below, the geometry of the observations is different than in the 2002 June 2 event.
The difference in the perspective is illustrated in Figures 10(a) and (b) by the based-difference images from STEREO-A at 13:58:30 UT and from STEREO-B at 13:59:03 UT (we select the beginning of eruptive phase II simply because the asymmetry is even more visible as the CME develops). The double ribbons, the dimmings, and the bright front are present in both images, but their structures in STEREO-A were much more asymmetrical than in STEREO-B. Wood & Howard (2009) concluded that STEREO-A observed this CME from the side and STEREO-B observed it almost along its ejecting direction (Figure 10(c)). The NRH on the Earth observed this CME with a perspective in between the STEREO spacecraft, so the radio sources viewed in projection on the disk are shifted toward the east direction proportionally to their coronal heights.
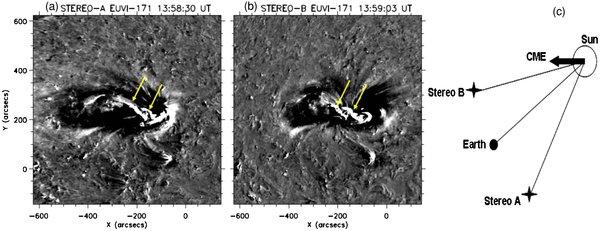
Figure 10. Eruptive phase II. (a) The based-difference image of EUVI from STEREO-A at 13:58:30 UT. (b) The based-difference image of EUVI from STEREO-B at 13:59:03 UT. A pair of arrows points to the double ribbons in both panels. (c) The sketch map of the positions of STEREO-A and B, the Earth and the direction of the CME.
Download figure:
Standard image High-resolution imageThe radio source IN, observed typically at higher frequency, is expected to be at lower height, and so moderately shifted by the side view from the Earth. This source is indeed always located close to the soft X-ray source and to the two eruptive flare ribbons (Figures 4 and 10). Both series of impulsive bursts and a smooth component are distinguished (Figure 11), then we interpret this radio source as the emission of particles accelerated downward from the reconnection region (or possibly from the shock associated with a downward jet), and we locate it above the observed flare loops. Note that the brightness temperature of the smooth component is smaller than 2 × 10⁶ K, so the emitting mechanism can be thermal or non-thermal within flare loops.

Figure 11. Time evolution of the brightness temperature of the IN source measured at 432 MHz during the eruptive phases. The smooth component is outlined with the lower continuous curve, shifted downward to not overlap with the data.
Download figure:
Standard image High-resolution image
The radio source E is the counterpart of the radio source IN, as we interpret this radio source as the emission of particles accelerated upward. This interpretation implies that, during the impulsive phase I, the magnetic structure is small enough so that the radio emission level is around (or even above) the top of the erupting structure. Then, the radio source is observed up to the CME bright front (Figure 4(b)).
At 150.9 MHz, part of the sources E is located in front of the bright EUV front observed by STEREO-B (Figure 4(b)). The difference of perspective has been corrected, and we also overplotted the radio data on SOHO/EIT data (as in Figure 7(b)) to check that the easternmost sources E are truly in front of the bright EUV front. So it is plausible that part of sources E at 150.9 MHz is due to the reconnection of the erupting magnetic configuration with the surrounding magnetic field, in particular open magnetic field lines since several type III bursts are detected at lower frequencies (DAM and WIND/WAVES, Figure 1). The electrons accelerated along large or open field lines can excite radio sources located significantly ahead of the front of the CME.
We also note that there is a region in which the projected E source positions, when also detected at 327 MHz, are not located eastward as the radio frequency decreases; they are observed at three frequencies (327, 228, and 150.9 MHz) along approximately the same line of sight and they are located close to the PIL. These observations may suggest that reconnection is driving non-thermal electrons in a comparable way to in source IN (i.e., that reconnection occurs at different locations along the PIL). Figure 4 provides some support to this suggestion since most of the 327 MHz sources are indeed located close to the PIL. A few other ones are located near the edge of the flux rope.
Finally, the radio emissions indicate an intensification of magnetic reconnection above the PIL and below the erupting flux rope. Since part of the magnetic connections to the dense photosphere is cut during the process, it implies a fast growth of the magnetic configuration which is indeed observed as the expansion of the bright front and the intensification of the twin dimmings. The bright front is located inside field lines significantly inclined with respect to the local vertical since with STEREO-A the western part of the bright front is intense and thin (viewed edge-on), while the eastern part of the bright front is diffuse and extended (viewed from the side, Figure 10(a)). Such difference is not intrinsic to the erupting configuration since the eastern and western parts of the bright front have similar width when viewed from STEREO-B (Figure 10(b)). Such inclination, about 50°, is a consequence of the lateral expansion of the erupting field.
Both the lateral and vertical expansions also imply an important increase of the volume of the configuration, and so a decrease of the density and the intensification of twin dimmings (this does not require a true opening of the magnetic field lines). Since the plasma density is higher at low height, as stratified by the solar gravity, this dimming formation corresponds dominantly to a decrease of density at low height, so the twin dimmings mainly trace the locations of the flux rope footpoints.
3.5. Eruptive Phase II: Propagation of the CME
The eruptive phase II is characterized by the occurrence of new sources N and S (Figure 6), and the flux measured at 150 MHz which appears to present a variability similar to that of the flux measured around 35 MHz (Figure 5). The flux at 228 MHz of the sources N and S is correlated during some time intervals, indicating that they have a common source of energetic electrons (Figure 7).
We suggest that the physical origin of sources N and S is due to reconnection of the erupting flux rope with the surrounding closed magnetic field. This interpretation is consistent with the observations, as follows. First, in the full-Sun potential extrapolation, large-scale field lines are present over the eastern part of the AR (orange lines in Figure 9(b)). Second, during the time period when the flux of sources N and S is correlated the radio emissions are mainly limited to the DAM frequency range, so the accelerated electrons are located in closed loops. The bursty DAM activity could be the signature of the reconnection region.
3.6. Eruptive Phase III and CME Development in Interplanetary Space
The interaction of the CME with the surrounding field is pronounced in the eruptive phase III since a series of type III bursts is observed (Figure 1). Moreover, the combination of radio and STEREO images shows that the type II burst has its origin near the southern neighboring of the flux rope and of the CME flank. This is coherent with the results of former studies which showed the link between the fast CME development and the origin of coronal shocks in the low corona. These studies established identifications of shocks propagating at CME flanks with streamers deflected when the shock impinges on them (Vourlidas et al. 2003; Yan et al. 2006; Lario & Pick 2007). Type III bursts observed at the same time originate near the compression region built up between the expanding CME and the neighboring open field line region (Pick et al. 2005; Yan et al. 2006).
Next, we investigate the global evolution of the flux rope from the corona to interplanetary space. The orientation of the PIL in the central part of the AR (Figure 2(a)) and the flare ribbons (Figure 10) are all inclined to the ecliptic plane by about 40°. However, the locations of the twin dimmings indicate that the flux rope has footpoints in an east–west direction. The radio sources also define approximately the direction of the flux rope (Figure 4(b)). From the comparison of the synthetic images built from density models with coronagraph observations by the STEREO spacecraft, Thernisien et al. (2009) and Wood & Howard (2009) concluded that the flux rope was tilted in the counterclockwise direction by 13° and 20°, respectively, to the ecliptic plane. This is a small rotation, at most 20°, between the low corona and interplanetary space.
The inverse S-shaped coronal loops before the eruption, the observed magnetic shear in the flare loops (Figure 4 in Cheng et al. 2010), as well as the separation of the flare ribbons along the PIL (Figure 10) all indicate a negative magnetic helicity (Démoulin & Pariat 2009). From MHD simulations (Török & Kliem 2003), as well as from observations (Green et al. 2007), a counterclockwise rotation is expected in the eruption of a flux rope with negative magnetic helicity. It is a consequence of a magnetic torque present in the erupting configuration, when the magnetic forces are strong enough, so most of the rotation is expected in the low corona. Then, the observed weak counterclockwise rotation of the flux rope is most probably a simple consequence of the eruption and it is plausibly present in the low corona in agreement with the present observational constraints.
4. CONCLUSION
With the high cadence observation from NRH/Nançay and EUVI/STEREO, we made a detailed study of the initiation and eruption phases of the CME on 2008 April 26. These observations are complemented by magnetograms, soft X-ray data, and radio spectra. The interpretation of all these data is in global agreement with the model of an erupting flux rope, with magnetic reconnection occurring behind it. This reconnection transforms arcade field lines to twisted ones, thus further building up the flux rope as it is erupting. The results also emphasize the interaction of the erupting field with the surrounding fields, an interaction which is evidenced already at the beginning of the initiation phase with radio imaging.
Because of their higher time resolution and also higher sensitivity to lower energy events, radio observations provide a precise trace of the events involved in a CME. Then, the evolution of the radio emissions at all frequencies is used to characterize the main phases of the eruption. Accordingly, the initiation and eruption phases were separated into five intervals, which indicated different physical processes, as follows.
During the initiation phase I, the radio source detected in the low corona to the south of the CME source AR, as well as the interplanetary type III burst, is evidence of the reconnection of the AR magnetic field with the surrounding open field. The open field found in the vicinity of the AR, with a full-Sun potential extrapolation of the magnetic field, supports the above interpretation. This process reduces the magnetic tension of the AR magnetic arcade, and so it is favoring the eruption.
A stationary radio source over the PIL is first detected in the initiation phase II. At the same location a soft X-ray source appears in the eruptive phase. All these emissions are interpreted as the consequence of energy release in a reconnection site located behind the eruptive flux rope, above the PIL.
During the eruptive phase, characterized in EUV by the development of a pair of deep dimmings surrounded by a bright front, radio sources are located on the expanding field region. In eruptive phase I, they are outlining the whole projection of the erupting flux rope on the disk. We interpret these radio sources as produced by fast electrons coming from the reconnecting region below the flux rope. At this early stage of the eruption, the flux rope is so low in the atmosphere, in so dense a region, that the accelerated particles can produce radio sources in the whole flux rope for the NRH spectral range.
Moreover, already in eruptive phase I, a fraction of the sources at the lowest imaging frequency, 150 MHz, are located in front of the EUV bright front. While we cannot totally reject a projection effect (because the radio emission is located higher than the EUV bright front), we rather interpret these sources as due to the interaction of the erupting field with the surrounding magnetic field. Since a series of type III bursts are detected at the end of eruptive phase I, some open magnetic field is involved.
While stationary radio sources are still present above the PIL, the next two eruptive phases are characterized by two groups of radio sources located on and partly ahead of the northern and southern parts of the EUV bright front. These radio observations provide evidence of lateral interaction, probably with reconnection, between the erupting flux rope and the surrounding magnetic field. The interaction occurs first with large-scale closed field lines (emissions limited toward low frequencies in the DAM range for the eruptive phase II), and later on with open field lines (presence of interplanetary type III bursts detected by WIND/WAVES in the eruptive phase III). Finally, we note that it is only in this last phase that a type II is detected, so a signature of a shock is present relatively late in the event (≈16 minutes from the beginning of the initiation phase).
The studied CME is launched from an AR significantly offset from the center of the disk, but still far from the limb. At the beginning of the erupting phase, the radio sources taken at all NRH frequencies are distributed over the eruptive flux rope. They trace its orientation in projection on the Sun, in agreement with the EUV dimmings that indicate the lower coronal footpoints of the flux rope. The comparison with the orientation deduced in interplanetary space from modeling coronagraph observations (Thernisien et al. 2009; Wood & Howard 2009) reveals a small counterclockwise rotation of the flux rope axis (at most 20°). Moreover, the direction of rotation is as expected by theory and previous observations in an eruptive flux rope having negative magnetic helicity (as indicated by several proxies: pre-eruptive and flare loops, flare ribbons).
In summary, the imaging radio observations of the low corona together with spectral data at lower frequencies (upper corona and interplanetary medium) brought further constraints on the physical processes of the CME launch. These observations pin down on the one hand the emissions induced by fast electrons accelerated both upward and downward from the main reconnection region located behind the eruptive flux rope, and on the other hand the emissions which result from the reconnections of the flux rope with various surrounding magnetic structures, as the flux rope grows in size during the eruption.
We thank the referee for her/his constructive comments on the manuscript. J. Huang acknowledges the CNES who provided the support for her three months stay in Paris Observatory. The authors are grateful to A. Lecacheux for helpful discussions. This work was supported by NSFC grants 10921303, 10903013, 10873021, the National Basic Research Program of MOST (grant 2006CB806301), CAS-NSFC Key Project (grant 10778605), and the Young Researcher Grant of National Astronomical Observatories, CAS (grant 0835032002). In France, this work was supported by CNES and CNRS. The authors thank the GOES, SOHO, RHESSI, and STEREO teams for providing data. The STEREO/SECCHI data are produced by a consortium of NRL (US), LMSAL (US), NASA/GSFC (US), RAL (UK), UBHAM (UK), MPS (Germany), CSL (Belgium), IOTA (France), and IAS (France).