


ABSTRACT
Recombination of Be-like Si10+ over the 0–43 eV electron–ion energy range is measured at the CRYRING electron cooler. In addition to radiative and dielectronic recombination, the recombination spectrum also shows strong contributions from trielectronic recombination. Below 100 meV, several very strong resonances associated with a spin-flip of the excited electron dominate the spectrum and also dominate the recombination in the photoionized plasma. The resonant plasma rate coefficients corrected for the experimental field ionization are in good agreement with calculated results by Gu and with AUTOSTRUCTURE calculations. All other calculations significantly underestimate the plasma rate coefficients at low temperatures.
Export citation and abstract BibTeX RIS
1. INTRODUCTION
Recent measurements have confirmed that a large part of the baryonic mass of the universe is in a highly ionized state, emitting and absorbing in the UV and X-ray regime (Day 2008; Werner et al. 2008). Silicon is an astrophysically abundant element (Anders & Grevesse 1989). Observations of emission and absorption lines of various charge states of silicon range from hot astrophysical objects (Lehmann et al. 2007; Smith et al. 2009; Vilhu et al. 2009) to the intergalactic medium (Danforth & Shull 2008). Accurate atomic data for silicon ions are needed for the modeling of astrophysical plasma and for the interpretation of astrophysical observations.
Recombination of highly charged ions with electrons is an important electron–ion process influencing the charge state distribution and temperature of plasmas and is an important source of emission lines from astrophysical plasmas (Phillips et al. 2006). Dielectronic recombination (DR) was first recognized by Burgess (1964) as being the most important recombination mechanism in the solar corona, dominating over the direct radiative recombination (RR). In DR, a free electron is attached to an ion, with the simultaneous excitation of a core electron. If the created doubly excited state decays radiatively below the ionization threshold, the system is stable against autoionization and DR is completed. We use here the convention of identifying the recombination spectra by the charge state of the ion prior to recombination. In the notation of the electron configurations we neglect the He-like 1s2 core.
In Be-like ions, a resonant recombination channel is available through simultaneous excitation of both 2s bound electrons to a 2p2 state during the attachment of the free electron to an nl Rydberg state. As one of the possible outcomes, the triply excited state stabilizes radiatively below the ionization energy of the recombined ion. This channel involves three active electrons and is therefore termed trielectronic recombination (TR).
Accurate calculation of TR resonances is challenging for theory because of the strong electron–electron interaction in the triply excited states which influences the resonance positions and strengths. In turn, uncertainties in the energy position of low-energy resonances lead to low-temperature plasma rate coefficients having large uncertainties (Schippers et al. 2004). Additionally, even at high temperatures, the calculated plasma rate coefficients of astrophysically relevant Be-like ions, such as Ne6+, Mg8+, and Si10+, have estimated uncertainties of up to 60% (Savin & Laming 2002). Storage ring measurements yield accurate, high-resolution recombination rate coefficients which can benchmark different theoretical descriptions and are ideal tools for the study of electron correlation in doubly and triply excited states.
In storage ring experiments, TR was first observed in the recombination spectrum of Be-like Cl (Schnell et al. 2003). Later, recombination spectra of other Be-like ions, such as Mg8+ (Schippers et al. 2004), C2+, N3+, O4+ (Fogle et al. 2005), Fe22+ (Savin et al. 2006), Ti18+ (Schippers et al. 2007), Ne6+ (Orban et al. 2008), and Ge28+ (Orlov et al. 2009), have been studied in storage ring experiments. TR contributes substantially to the recombination spectra of most of these ions.
2. EXPERIMENT AND DATA ANALYSIS
The experiment was performed at the CRYRING Heavy Ion Storage Ring located at the Manne Siegbahn Laboratory in Stockholm, Sweden. The Si10+ ions were produced in an electron cyclotron resonance ion source and were transported and injected into the storage ring. Following injection, the Si10+ ions were stored on a stable orbit and accelerated to an energy of 12 MeV amu−1. In the electron cooler section of the storage ring a velocity-matched, cold electron beam (Danared et al. 2000) was merged with the circulating ions and the ion beam was electron cooled for 1.5 s. The energy of the electron beam was then scanned in a zig-zag pattern, so as to cover the 43 eV electron–ion collision energy with electrons both faster and slower than the circulating ions. During the measurements, the electron current was kept constant, with 4.8 × 106 cm−3 electron density at cooling energy. Recombined ions were separated from the stored charge state in the first dipole bending magnet following the electron cooler and were detected with a solid state detector with unity efficiency. After the electron energy scan, the ion beam was dumped and the above sequence was repeated. The entire measurement was made over a number of 2535 cycles.
Due to experimental conditions, the ion beam extracted from the ion source contained a significant fraction of He-like N5+ ions. The similar charge-to-mass ratio of the Si10+ and N5+ ions prevented the separation of the ions prior to injection and therefore both ion species were stored and accelerated, as shown in the Schottky frequency spectrum of the circulating ions (see Figure 1). Following recombination in the electron cooler, however, the recombined ion species, i.e., Si9+ and N4+ had significantly different charge-to-mass ratios and consequently had different trajectories after the charge state separating dipole magnet. The separation between the recombined Si and N was much larger than the size of the detector, thus facilitating the detection of the pure recombined Si9+ ions, without contributions from the recombined N4+. For each recombined ion hitting the detector, the pulse height, electron accelerating potential, and time were recorded in event mode.
The collision energy was obtained with a similar procedure as described by DeWitt et al. (1996), considering the electron beam space charge including the contribution from trapped residual gas ions, and correcting for the effects of the electron energy detuning on the ion energy. Rate coefficients were obtained by normalizing the electron–ion energy-dependent count rates R(E) to the number of circulating Si10+ ions (Ni) and the electron density (ne):
where γ is the relativistic factor and li/LR is the ratio of the electron–ion interaction length to the orbit length of the ions, and accounts for the fraction of time the ions spent interacting with the electrons. The number of Si10+ ions was obtained from the measured ion current, after correcting for the fraction of N5+ present in the ion beam, where the fraction of N5+ was extracted from the Schottky spectrum of the circulating ions (see Figure 1).
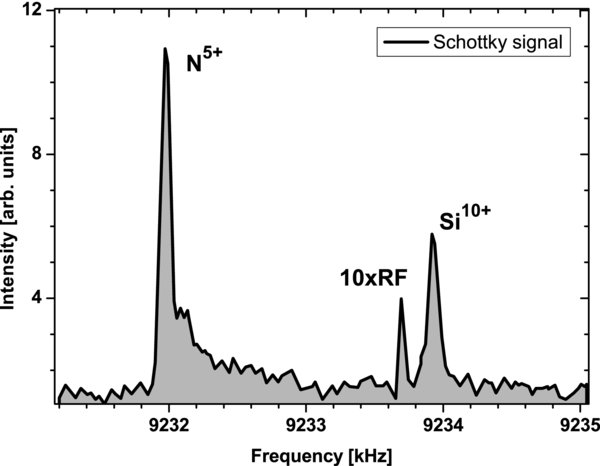
Figure 1. Schottky spectrum of the stored ions.
Download figure:
Standard image High-resolution image3. THEORY
Intermediate-coupling AUTOSTRUCTURE calculations (Badnell 1986, 1987) yielded resonant recombination (i.e., DR + TR) cross sections within the independent-processes–isolated-resonances approximation. The core-excited energies of the calculation were adjusted to match spectroscopic values from the NIST atomic spectra database (Ralchenko et al. 2009). Separate calculations were performed for ions initially in the ground state and in the 2s2p3P0 metastable state, using a similar method as described by Fogle et al. (2005). The AUTOSTRUCTURE calculation contained radiative stabilization channels of the intermediate doubly excited state through decay of both the excited core and the Rydberg electron and autoionization rates to the original as well as to all other energetically available states.
To compare with the experimentally derived recombination rate coefficients α(E), the calculated cross sections σ(v) were multiplied with the electron velocity v and were convoluted with the velocity distribution of the electrons from the experiment:
where f(v, T||, T⊥) is the anisotropic electron velocity distribution with parameters derived from the experiment. The best agreement between the experiment and calculation was found for T|| = 0.15 meV and T⊥ = 1 meV electron beam temperatures.
4. RESULTS AND DISCUSSION
4.1. Merged-beams DR Rate Coefficients
In Be-like systems, the decay of the 2s 2p3P0 excited state is only allowed through the simultaneous emission of two photons. In the absence of a nuclear spin, the associated lifetime of this state is much longer than our experimental timescale (Marques et al. 1993; Brage et al. 1998; Cheng et al. 2008). A fraction of the ion beam circulating in the storage ring was therefore in the above 2s2p3P0 metastable state, whereas other excited states were expected to decay to the ground state before the electron energy scan was started. The RR cross section for ground-state and metastable Si10+ ions is approximately equal, i.e., the count rate associated with RR depends on the total number of Si10+ ions and is independent of the metastable fraction of these ions. The RR rate coefficients in the experimental spectrum were calculated with a similar procedure as described in Orban et al. (2008). The good agreement shown in Figure 2(a), between the calculated RR rate coefficients and experiment, supports our determination of the total number of circulating Si10+ ions.
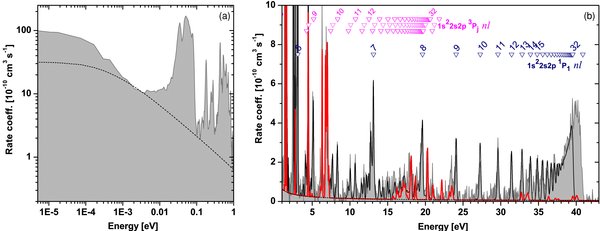
Figure 2. Overview of the Be-like Si recombination spectrum (a) at low energies and (b) up to the 2s2p(1P1) nl series limit. The gray area shows experimentally determined rate coefficients corrected for the metastable fraction of the ion beam. The black solid line shows total rate coefficients (i.e., RR + AUTOSTRUCTURE). The black dashed line shows RR and the red solid line shows TR contributions to the recombination spectrum. Symbols mark DR resonance positions calculated using Equation (3). The principal quantum number of the outer electron is written above the symbols. The last symbol in each series marks the series limit.
Download figure:
Standard image High-resolution imageIn order to correct for the metastable fraction, the resonant part of the experimentally derived spectrum was scaled to match the results of the AUTOSTRUCTURE calculation in the region from 25 to 39 eV. Figure 2 shows the metastable-corrected experiment together with the ground-state AUTOSTRUCTURE results summed with the calculated RR. Above 9 eV, good agreement can be observed between experimental and calculated rate coefficients. The spectrum is dominated in this region by the DR resonances belonging to the 2s2p(1P1)nl series, which form a pile-up structure toward the series limits located at 40.875 eV (Ralchenko et al. 2009). In contrast to the 2s2p(1P1)nl series, the 2s2p(3PJ)nl-type DR resonances are decreasing in strength toward higher energies, without creating an observable pile-up structure at the corresponding series limits. The TR contribution to the calculated spectrum is shown by the red curve. As previously observed for other Be-like ions, the calculation has lower values than the experiment at energies where TR contributions are predicted, especially at energies above the 2s2p(3PJ)nl series limits.
Approximate positions of the DR resonances, as shown by the symbols in Figures 2 and 3, were obtained using the formula
where E is the kinetic energy of the free electron and ΔEcore is the excitation energy of the core. The last part in Equation (3) gives the binding energy of the outer electron (neglecting the quantum defect of different l states), with Ry and Q being the Rydberg constant and charge number of the ion, respectively.
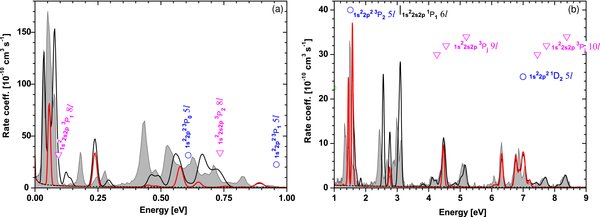
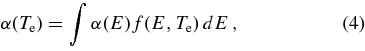
Figure 3. Recombination spectrum at low energies, with the same plot designations as in Figure 2.
Download figure:
Standard image High-resolution imageFigure 3 shows a detailed view of the low-energy recombination spectrum. Several sharp resonances are present in this region, due to recombination through doubly excited states with 2s2p(1P1)6l and 2s2p(3PJ)nl(n = 8, 9, and 10) configurations. This region also contains strong TR contributions which are comparable in strength to the DR resonances, as emphasized by the red solid line. The AUTOSTRUCTURE calculation finds the TR resonances below 1 eV to have 2p25d electron configurations, with one TR resonance at 0.9 eV with the 2p25f configuration. The agreement between calculation and experiment, although not as good as at higher energies, is remarkable considering the difficulties in the calculation of resonances located at low energies.
The first resonances, situated below 100 meV, are significantly higher than any other spectral feature in the spectrum. These resonances are due to recombination through doubly excited states with a (3PJ)nl configuration that require a spin-flip of the excited core electron and a TR peak due to recombination through a 2p25d intermediate state. The AUTOSTRUCTURE calculation shows a similar resonant structure at these energies, although with differently distributed peak strengths. A similar low-energy resonance group was also observed in the spectrum of Be-like Ne (Orban et al. 2008) having strong effects on the temperature-dependent plasma rate coefficients.
The uncertainty in the rate coefficients is estimated to 17% and is the quadratic sum of 10% statistical uncertainty, 5% uncertainty in the electron–ion interaction length, 5% uncertainty in the ion current measurement, 5% uncertainty in the number of Si ions, because of the presence of N ions in the stored beam, and 10% uncertainty in the estimated metastable content of the Si ions.
4.2. Plasma Recombination Rate Coefficients
In order to calculate plasma recombination rate coefficients for the resonant recombination channels (i.e., DR + TR), the RR-subtracted experimental rate coefficients α(E) were convoluted with Maxwell–Boltzmann energy distributions with a temperature Te (Savin 1999; Schippers et al. 2001):
where α(Te) is the plasma rate coefficient and f(E, Te) is the electron energy distribution:
The obtained plasma rate coefficients are decreasing monotonically over the presented temperature range by more than 3 orders of magnitude (see Figure 4). Temperature intervals, where the number of Si10+ ions is larger than 10% of the maximum abundance in photoionized and collisionally ionized plasmas, are indicated by vertical dashed lines and corresponding arrows (Kallman & Bautista 2001). In order to emphasize the contribution from the low-energy DR resonances, several low-energy ranges were excluded from the convolution. The low-energy resonance group located below 100 meV is dominating recombination in low-temperature plasmas, and it is responsible for >90% of the recombination strength at 103 K, >60% at 2.5 × 10³ K, >35% at 5 × 10³ K, and >20% at 104 K. Therefore, changes in the position or strength of low-energy resonances strongly influence the low-temperature plasma rate coefficients over a wide temperature range.
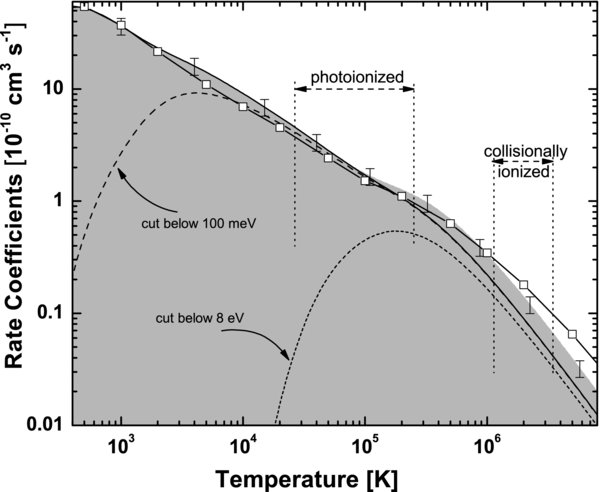
Figure 4. Solid line shows experimentally derived plasma DR + TR rate coefficients into states up to ncutoff = 32 and dashed and dotted lines show partial contributions, as specified in the figure. The gray area shows field-ionization-free Δn = 0 rate coefficients. The symbols show the results of the AUTOSTRUCTURE calculation that include Δn = 0 and Δn = 1 DR. Vertical dashed bars and associated arrows show temperature regions over which the Be-like Si are abundant in photoionized and collisionally ionized plasmas (Kallman & Bautista 2001).
Download figure:
Standard image High-resolution imageDue to field ionization in the charge separating dipole magnet, only recombination into states below ncutoff = 32 was detected in the experiment. To evaluate the amount of recombination into states above ncutoff, calculations including recombination into states up to n = 1000 were performed. Recombination above n = 1000 was considered insignificant and was not included in the calculations. Spectra including recombination into states up to n = 1000 are hereafter termed as field-ionization-free data.
To prepare field-ionization-free plasma recombination rate coefficients, the RR-subtracted experiment was replaced with the field-ionization-free calculation at the 2s2p(1P1)nl series limits, between 39.5 and 41.2 eV. The resulting spectrum was then convoluted to yield field-ionization-free plasma rate coefficients for the resonant recombination channels as shown in Figure 4 by the gray area. Compared to the ncutoff case, recombination into states above ncutoff = 32 causes an increase in the plasma recombination rate coefficients by 3% at 105 K, 25% at 2.5 × 10⁵ K, 40% at 5 × 10⁵ K, 50% at 106 K, and 60% at 107 K.
Additionally, we estimate from the calculation that the contribution from the Δn = 1 DR located above the 2s2p(1P1)nl series limit affects the plasma rate coefficients above 106 K (see Figure 4), and cause an increase of 13% at 106 K, 40% at 2 × 10⁶ K, and 80% at 5 × 10⁶ K. Because our experiment did not cover the energy range above the 2s2p(1P1)nl series limit, we use in the following the Δn = 0 recombination results for comparison with calculated rate coefficients existent in the literature.
To facilitate a comparison with other results, the Δn = 0 resonant plasma rate coefficients were fitted with the expression (Burgess 1965)
where ci and Ei are fit parameters. The coefficients obtained from the fitting procedures are shown in Table 1 and reproduce the data within 1% up to 106 K and better than ∼2% up to 107 K.
Table 1. Fit Coefficients for the RR-subtracted Δn = 0 ncutoff and RR-subtracted Δn = 0 Field-ionization-free Plasma Rate Coefficients from Figure 4
| No. | ncutoff | n = 1000 | ||
|---|---|---|---|---|
| i | ci | Ei | ci | Ei |
| 1 | 2.22 | 0.026 | 2.31 | 0.026 |
| 2 | 16.18 | 0.055 | 16.24 | 0.056 |
| 3 | 6.13 | 0.151 | 6.34 | 0.156 |
| 4 | 63.81 | 0.461 | 67.01 | 0.470 |
| 5 | 78.66 | 1.036 | 82.73 | 1.103 |
| 6 | 217.15 | 2.891 | 230.38 | 3.073 |
| 7 | 491.02 | 8.945 | 544.25 | 9.858 |
| 8 | 1970.00 | 30.900 | 3682.30 | 35.605 |
Note. The dimensions of ci and Ei are 10−5 cm3 s−1 K1.5 and eV, respectively.
Download table as: ASCIITypeset image
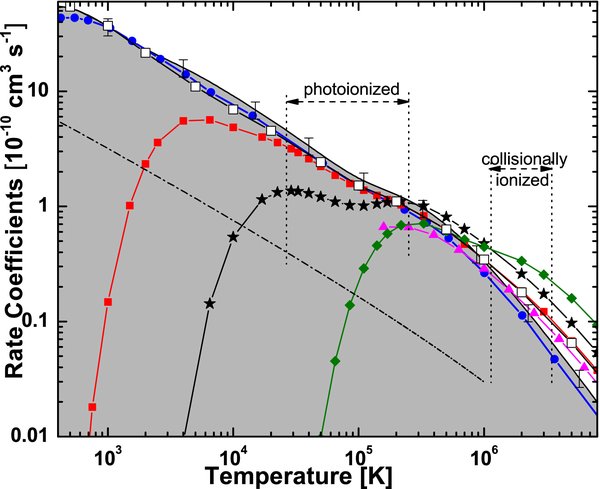
In the investigated temperature range, the resonant (DR + TR) recombination channels dominate by ∼1 order of magnitude over RR (Badnell 2006). The resonant field-ionization-free plasma rate coefficients are compared with calculated data from the literature in Figure 5. Below 3 × 10⁵ K, the calculated rate coefficients existing in the literature show a wide spread. Several calculations neglect or underestimate the low-energy resonances and consequently underestimate the low-temperature rate coefficients by orders of magnitude. Closest to our results are the plasma rate coefficients by Gu (2003) which, although lower than our data, are within the 17% experimental uncertainty over the entire presented temperature range. The relatively recent calculations of Colgan et al. (2003) lie below the experimentally derived rate coefficients. The rate coefficients from Colgan et al. (2003) are based on an AUTOSTRUCTURE calculation and should be very close to the calculated results presented here (see open squares in Figure 5). After some investigations, a mistake in the shift to NIST core-excited energies was found in the post-processor input file used by Colgan et al. (2003), leading to the lower rate coefficients. As shown in Figure 5, when the correct shift is used, the AUTOSTRUCTURE results lie very close to the experimentally derived rate coefficients. Following our investigations, the online database (Badnell 2009) containing the data from Colgan et al. (2003) will be updated with the corrected results.
Figure 5. Resonant field-ionization-free rate coefficients derived from the experiment are shown by the gray area. Results of the AUTOSTRUCTURE calculation are given by open squares. Data from the literature are denoted as follows: circles, Gu (2003); squares, Colgan et al. (2003); stars, Romanik (1988); diamonds, Aldrovandi & Pequignot (1973); triangles, Badnell (1987). The dash-dotted line shows RR plasma rate coefficients from Badnell (2006). Vertical dashed bars show temperature ranges as given in Figure 4.
Download figure:
Standard image High-resolution image
Above 3 × 10⁶ K, all data from the literature are higher than our results. This can be partially attributed to possible contributions from DR through excitation of the 2s electron to higher shells and to DR through excitation of a 1s electron, which are not included in our data.
5. CONCLUSIONS
High-resolution absolute recombination rate coefficients are presented for Be-like Si. Good agreement is found between the experimentally derived recombination rate coefficients and results of AUTOSTRUCTURE calculations. The recombination spectrum contains strong contributions from TR. Below 100 meV collision energy, TR and DR associated with the spin-flip of the excited electron create a group of strong resonances. Recombination through these resonances dominates the recombination in low-temperature plasma.
The resonant plasma recombination rate coefficients of Be-like Si are monotonically decreasing over the presented temperature range. Comparison of our data with predictions from the literature reveals a general underestimation of the low-temperature plasma recombination rate coefficients except in the case of the results of Gu (2003). The presented plasma rate coefficients do not include the contribution from resonances located above 43 eV electron–ion energy (above the 2s2p1P0nℓ series limits), and therefore in the region of abundance of Be-like Si in collisionally ionized plasmas, they underestimate the total plasma rate coefficients.
We thank the CRYRING crew for the excellent support during the experiment.