


ABSTRACT
Recently, the mechanisms and extent of immediate postshock heating of electrons at collisionless shocks have been under intense investigation. Several recent studies have suggested that the ratio of electron to proton temperature at the shock front scales approximately as the inverse square of the shock velocity. A specific interpretation of this dependence was first introduced by Ghavamian et al., who suggested electron heating by lower-hybrid waves in a cosmic ray (CR) precursor as a possible mechanism behind such a relationship. The best line diagnostics for the electron to proton temperature ratio behind collisionless shocks in partially neutral gas are the combination of broad and narrow Hα lines emitted in the immediate vicinity of the shock front. In this work, we present extensive long-slit spectroscopy of the Hα emission in the blast wave shock of supernova remnant DEM L71. We chose this remnant for two main reasons. First, the shock velocities in DEM L71 span the range of speeds where the electron to proton temperature ratio varies most rapidly with shock speed. Second, previous Fabry–Perot scans of the Hα line complex indicated broad-to-narrow flux ratios lower than existing models predicted, but the spectral coverage of those observations was not broad enough to reliably measure the background emission around the broad component Hα line. Our new high-resolution (R ≳ 1600) spectra of DEM L71 provide extensive coverage of the background near the Hα line and confirm our earlier Fabry–Perot results of consistently low (≲1) broad-to-narrow flux ratios. Here, we present results of these observations and also outline the first results from spectra of radiative portions of DEM L71. We compare our results to the latest models of Hα profiles from collisionless shocks. We conclude that the most likely explanation for the low broad-to-narrow flux ratio is the ionization and excitation of neutrals by electrons heated in the extended CR precursor.
Export citation and abstract BibTeX RIS
1. INTRODUCTION
The Hα broad and narrow lines have proven to be extraordinarily successful probes of the electron heating at collisionless shocks. When these shocks propagate into partially neutral gas they produce spectra dominated by the Balmer lines of hydrogen (i.e., they are `Balmer dominated'; Chevalier & Raymond 1978; Chevalier et al. 1980). The Balmer emission lines have been used to predict the ratio of electron to proton temperatures, Te/Tp in at least eight supernova remnants (SNRs; van Adelsberg et al. 2008). Within this context, DEM L71 stands out in two important ways. First, the steepest decline in Te/Tp occurs exactly over the range of shock speeds present around the rim of DEM L71 (400–1000 km s−1). Second, with Balmer-dominated filaments present around almost the entire rim, DEM L71 allows us to study shocks in the same object, where systematic differences in the interstellar medium between different shocks are mitigated. For this reason, we obtained a set of nine new long-slit observations to verify and expand upon existing Hα data.
The Hα broad and narrow line diagnostic has played a central role in developing the observational constraints on electron heating at collisionless shocks. Chevalier & Raymond (1978) were the first to recognize and Chevalier et al. (1980) the first to observe that charge exchange between cold neutral H and postshock heated protons would create a population of hot neutrals immediately behind the shock. These hot neutrals give rise to a broad component in the H lines. The width of the broad component, VFWHM, reflects the distribution function of hot neutrals and hence the hot protons behind the shock. The flux ratio between the narrow and broad components, IB/IN, reflects the competing cross sections for charge exchange, electron and proton impact ionization, and electron and proton impact excitation of the cold neutrals. Due to the electron temperature dependence of the cross sections for ionization and excitation, the flux ratio is a diagnostic for the electron temperature or the electron to proton temperature ratio β. Several authors have since elaborated on the work of Chevalier & Raymond (1978) and Chevalier et al. (1980) and refined the use of VFWHM and IB/IN as a diagnostic tool. For example, Ghavamian et al. (2001) incorporated Monte Carlo modeling of Lyman α absorption. Heng & McCray (2007) and Heng et al. (2007) included a more careful evaluation of the charge-exchange cross section as a function of relative velocity, and van Adelsberg et al. (2008) incorporated the effect of multiple charge exchanges on the distribution function of the hot neutrals. We note, however, that all of the above models assume that the hot electrons participating in the ionization and excitation of the cold neutrals are located behind the shock, cospatial with the shock heated protons. Recently Wagner et al. (2009) were the first to incorporate ionization, emission, and heating in a CR precursor into the modeling of the Hα IB/IN conducted for the specific case of "knot g" in Tycho's SNR and heating by Drury's acoustic instability (Drury & Falle 1986).
The proximity of the Hα line emission to the shock front makes the Hα line ratio and broad component width the most reliable measurement for the electron heating at collisionless shocks, particularly at the outer shock of SNRs. As enumerated in Rakowski (2005) and references therein, this is by no means the only method for constraining β in SNRs. Ultraviolet line diagnostics, additional optical lines, and even downstream X-ray bremsstrahlung and nonequilibrium ionization line emission provide complimentary information. However, for a consistent determination of the electron temperature as a function of shock velocity, in Ghavamian et al. (2007b), we chose to focus on the single uniform diagnostic of Hα broad and narrow emission. There we found that the relationship between β and shock velocity vs was remarkably well described as β ∝ v−2s above 450 km s−1, which would imply a constant electron temperature regardless of shock velocity.
On the theoretical side, Ghavamian et al. (2007b) proposed that the observed trend of β ∝ v−2s could be interpreted as electron heating by lower-hybrid waves in an extended cosmic-ray (CR) precursor. Rakowski et al. (2008) investigated both the kinetic and reactive growth rates for lower-hybrid waves and found that there was no growing mode for a reactive instability. However, the kinetic (or resonant) growth rate was sufficient to explain the electron heating and to compete with the magnetic field amplification by cosmic-ray-driven, modified Alfvén waves described by Bell (2004, 2005) once some amplification had occurred and a quasi-perpendicular geometry had been established. The question for the present work is do the low IB/IN observed in DEM L71 fit with this explanation of the electron heating?
DEM L71, also known as SNR 0505−67.9, is a well-studied type Ia SNR, with X-ray observations from Einstein, ASCA, Chandra, and XMM-Newton analyzed by a number of authors including Long et al. (1981), Tuohy et al. (1982), Hughes et al. (1998), Hughes et al. (2003), and van der Heyden et al. (2003). The Balmer-dominated shocks in DEM L71 were first imaged by Tuohy et al. (1982), followed by long-slit observations by Smith et al. (1991, 1994). In these observations the spectroscopic slit was laid across the SNR, sampling emission from opposing edges of the blast wave as well as the center. The first thorough optical study of the entire rim of DEM L71 was performed by Ghavamian et al. (2003, hereafter GRHW03) and Rakowski et al. (2003, hereafter RGH03) using Fabry–Perot (two-dimensional spectroscopic) observations of DEM L71 for 14 wavelengths around Hα in conjunction with Chandra X-ray data. GRHW03 found that IB/IN was consistently below model predictions, thus not allowing us to gauge β on the Hα data alone. RGH03 therefore used the broad component width to constrain the shock velocity, via the proton temperature, and modeled the X-ray emission from successive regions behind the shock with a range of initial values of β. This procedure enabled us to identify at least one region in DEM L71 where the initial electron temperature was between the two extreme cases of full and minimal equilibration with respect to the proton temperature. Rakowski (2005) revised this data point using additional Chandra data to better constrain the electron temperature. Recently the IB/IN and VFWHM values from DEM L71 of GRHW03 were reexamined by van Adelsberg et al. (2008) in the course of their revisions to the Hα modeling. With their revisions to the model, van Adelsberg et al. (2008) were able to accommodate the two highest IB/IN ratios, 0.93+0.11−0.10 and 0.88+0.11−0.10. They could not accommodate any other ratios, the next highest of which was 0.67 ± 0.11 at a VFWHM of 865+180−145.
Since we will be interpreting the Hα fluxes in the context of a CR precursor, it is worth reviewing any evidence of CR acceleration for DEM L71. Given its location in the Large Magellanic Cloud (LMC), the distance to DEM L71 limits the brightness of any extended CR precursor and would make any bright thin precursor unresolvable spatially. DEM L71 is weak at radio wavelengths, 9.6 mJy at 846 MHz (Mills et al. 1984), which was interpreted by Hendrick & Reynolds (2001) in the context of the X-ray emission, as implying an upper limit on the cutoff energy for cosmic ray electrons of 80 TeV. Thus, DEM L71 is not expected to be amongst the SNRs with extremely efficient cosmic ray acceleration that might modify its shock dynamics. GRHW03 found a low explosion energy of at most E51 = (0.37 ± 0.06)D5/250, where D50 is the assumed distance to the LMC, by modeling the preshock densities, radii, and velocities of portions of the blast wave with a Sedov solution. This low explosion energy with respect to canonical models of Type Ia explosions could be construed to imply energy losses to CR escape during an earlier more efficient CR acceleration phase in the lifetime of DEM L71. However, this result is model dependent and there are no supporting independent measurements of the age or ambient density. Regardless our picture of electron heating depends primarily on the low-energy portion of the CR distribution and does not require extremely efficient CR acceleration.
The velocities exhibited around the rim of DEM L71 lie between 400 km s−1 and 1000 km s−1, where β is falling rapidly, so we felt that it was important to revisit this remnant with higher quality spectra. Additionally, there was a lingering question as to whether GRHW03 had accurately identified the background level. The sparse sampling (only 14 wavelength bins) and limited range of wavelength coverage could have affected the measurement of the broad component, particularly its flux. In this paper, we present the results of an extensive set of high-resolution, long-slit spectra from around the rim of DEM L71 taken in two observing runs at Las Campanas Observatory, Chile. Our new spectra strengthen the case for low IB/IN found in GRHW03. We discuss this result in light of our hypothesis of electron heating by lower-hybrid waves in a CR precursor.
2. OBSERVATIONS AND DATA REDUCTION
Long-slit spectra of DEM L71 were acquired in two trips to Las Campanas Observatory, Chile, in February and December of 2006. All spectra were taken with the LDSS-3 instrument on the Magellan Clay Telescope with the "VPH-blue" grism and a red offset slit mask. For the first run we used a 1'' width slit to maximize the signal to noise, but chose the 0 75 width slit in the second observing run to take advantage of the greater spectral resolution and avoid geometrical complications from emitting regions that might not fill the aperture on nights with good seeing.
The wavelength range considered here is for a single CCD, and covers 5600–7000 Å. The spectral resolution was measured to be 2.5 ± 0.1 Å and 3.9 ± 0.2 Å for the 075 and 10 slits, respectively. This is comparable to the expected resolution given the instrument parameters and seeing. At Hα this results in resolutions of 115 km s−1 and 179 km s−1 for the two slit widths. Both the wavelength solution and the spectral resolution were verified using 12 unresolvable night sky lines from the catalog of Osterbrock et al. (1996).
A total of nine slit positions were taken, seven around the rim or edge of the remnant (E1–E7), and 2 (C1 and C2) across the rim through the center to obtain spectra of some bright radiative knots (as well as alternative views of the rim). In Table 1, we list their positions around DEM L71 with respect to the center of the remnant as determined in GRHW03 (α = 05h05m42 3, δ = −67°52'413 [J2000.0]). After target acquisition three exposures of either 600 s or 900 s each were taken at each slit, followed by flats and arc-lamp exposures. All data were processed in IRAF,4 first with LDSS-3 specific tools and then with the long-slit package following the prescriptions relevant for extended emission line sources in Massey et al. (1992).
Table 1. Slit Positions
| Slit Name | Anglea | GHRW Apertures | RGH Apertures | Runb | Total Exposure Time (min) |
|---|---|---|---|---|---|
| E1 | −3–28 | 1, 2, 3 | 1 | 45 | |
| E2 | 33–89 | 4, 5 | x1, x2 | 1 | 30 |
| E3 | 128–175 | 7, 8, 9 | x3 | 2 | 45 |
| E4 | 170–205 | 10 | 2 | 45 | |
| E5 | 207–264 | 11, 12 | x4 | 1 | 30 |
| E6 | 259–285 | 13 | 1 | 30 | |
| E7 | 285–352 | 13, 14 | x5 | 2 | 45 |
| C1 | 151–33c | 8, 3 | x3, x1 | 2 | 45 |
| C2 | 223–77c | 12, 5 | x4, x2 | 2 | 45 |
Notes.
aAngle with respect to center of DEM L71, clockwise from north.
bObserving Run 1: 2006 February 1''slit; observing run 2: 2006 December, 075 slit.
cSlits crossing the center of DEM L71 from one angle with respect to the center of DEM L71 to another.
Download table as: ASCIITypeset image
The exact position of the slit in the sky was determined post facto through careful comparison of the two-dimensional spectrum and the acquisition images based on both bright and faint stars that fell in the aperture. Figure 1 shows the actual slit positions overlaid on a narrow band Hα image of DEM L71 taken on 2005 November 5 for 300 s with the MagIC Camera also on the Clay Magellan Telescope at Las Campanas.
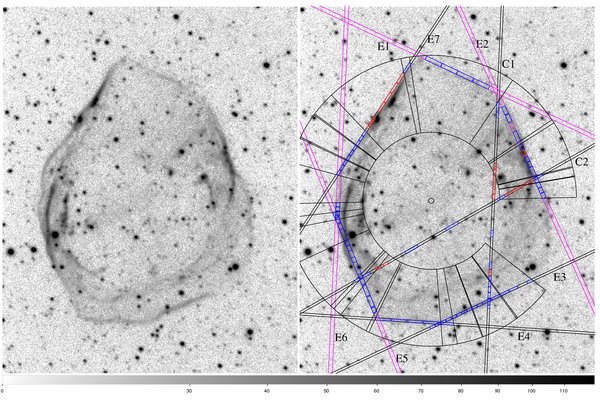
Figure 1. Hα narrowband image of DEM L71 taken with the MagIC camera on the Clay Telescope at Las Campanas Observatory. Both panels show the same image with square-root scaling from 0 to 120 counts pixel−1. The right panel is overlaid with all the slit positions as verified by the pattern of stars in the spectrum. The 1'' slits from the first observing run are marked in magenta, while the 075 slits are marked in black. Subapertures from which spectra were extracted are marked in blue for pure Hα emission or in red if radiative lines were present. The black annulus and angle markings, centered at the expansion center of DEM L71 as determined in GRHW03, correspond to the ranges over which individual spectral results were combined.
Download figure:
Standard image High-resolution imageExtraction apertures along each slit were chosen by examining the two-dimensional spectrum line by line and in five and 10 line blocks to ensure consistency of features within each aperture, and that any small scale spectral features were captured in separate spectra. Long segments of slowly changing or similar spectra were broken up into equal size apertures. Areas with no spectral features were not extracted. An example of the two-dimensional spectrum is shown in Figure 2.
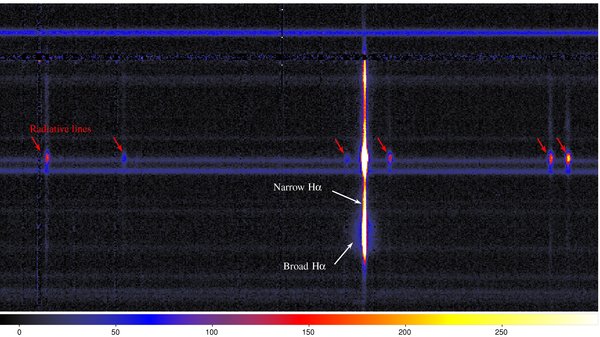
Figure 2. Example sky-subtracted two-dimensional spectrum, slit E7 (south, bottom, north, top). The scaling is linear, from −10 to 300 counts pixel−1, in the B color table of DS9. This was chosen to highlight the presence of the weak but clearly detectable broad component in the southern end of this spectrum seen here in blue, against the red, white, and yellow narrow components. Also clear is the isolated knotlike nature of the brightest radiative emission, marked with red arrows. This corresponds to the bright knot behind the southern set of red apertures in Figure 1 along this slit. Some possible radiative contamination is present in the spectra above that knot. Those are excluded from the broad-to-narrow analysis due to this radiative contamination and also because the slit position here is clearly slightly ahead of the shock.
Download figure:
Standard image High-resolution imageObservables were extracted from the wavelength-calibrated spectra using "splot deblend" in IRAF to fit the background level, line centers, and line widths of multiple lines, whether that was just one broad and one narrow component for Hα, multiple shifted broad or narrow components, or fitting radiative lines of O, N, or S. Examples of Hα broad and narrow component spectra are shown in Figures 3 and 4. Examples of spectra that showed evidence for radiative emission from the recombination zone further behind the shock are shown in Figures 5 and 6.
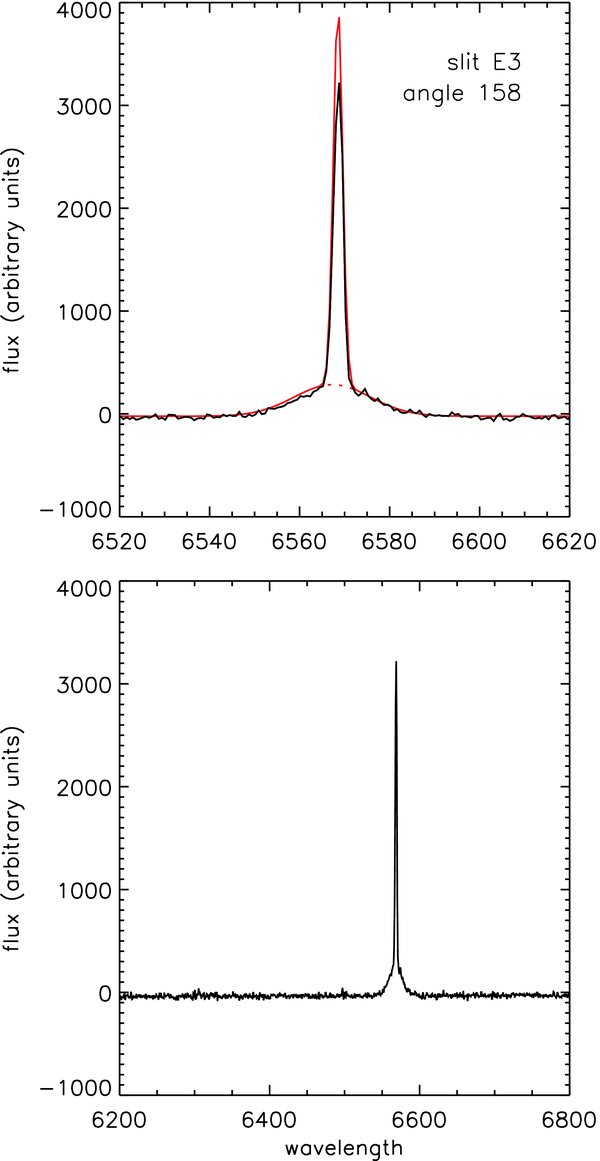
Figure 3. Sky-subtracted spectrum of a single region along the E3 slit, centered at an angle of 158 west of north from the center of DEM L71. The bottom panel shows the wide wavelength coverage, illustrating the complete lack of any radiative emission lines, as well as clearly illustrating the existence of the broad component above the background. The upper panel zooms in on the Hα lines and displays the fitted Gaussians (overlaid in red) used to determine the line widths and fluxes. The aperture displayed here had one of the highest measured IB/IN.
Download figure:
Standard image High-resolution image
Figure 4. Same as Figure 2, but for the C2 slit which cut across the remnant, at an aperture which subtends the southeast rim. This illustrates the clear detection of the broad component, even in this case with a very low IB/IN.
Download figure:
Standard image High-resolution image
Figure 5. Spectrum of a region along slit E7 which exhibited all the radiative lines expected within this wavelength range, [O i] 6300, [O i] 6333, [N ii 6548], Hα 6563, [N ii] 6583, [S ii] 6716, and [S ii] 6731. The two-dimensional spectrum of E7 shows this region of radiative emission to be a distinct knot, with only very faint radiative emission extending to the north through the rest of the brightest portion of this rim.
Download figure:
Standard image High-resolution image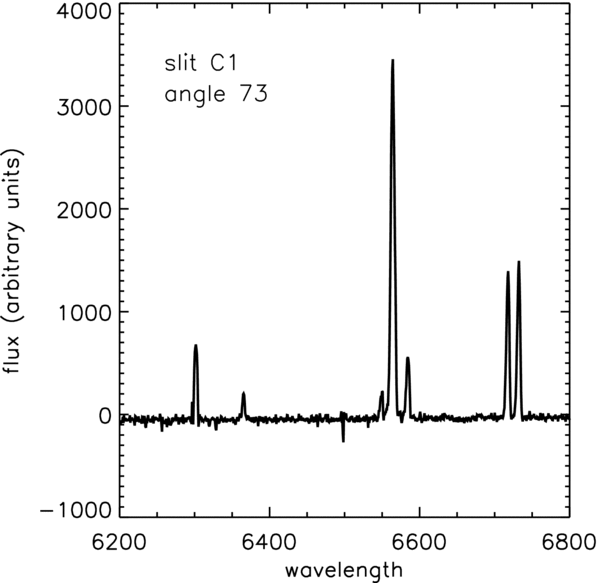
Figure 6. Spectrum of an isolated radiative knot in the interior of DEM L71.
Download figure:
Standard image High-resolution image3. RESULTS: Hα BROAD AND NARROW LINES
In Tables 2 and 3, we present the ratio of broad and narrow fluxes IB/IN and the full width at half-maximum VFWHM5 of the broad component for all those regions for which no radiative lines were seen, and the Hα line blend was adequately matched with a single broad and a single narrow component. The shift in the line centroid between the broad and narrow components is included in Table 2 for completeness, but is less than the 115 km s−1 spectral resolution in all cases. Wherever possible results from multiple adjacent apertures are averaged and the "errors" listed are simply the 1 standard deviation ranges on those fitted values. Despite the deep observation time, we note that no broad component was detected at any point along slit E1, although the narrow Hα emission was comparable in counts to apertures along E7 that showed weak but clearly detectable broad components. Also, note that a section of slit E5 is excluded from this analysis because multiple components with different redshifts were seen, complicating the interpretation of the spectrum, such that the broad-to-narrow ratios were deemed unreliable. Given that this segment of slit E5 was clearly behind the main edge-on shock front, it is not surprising to see both blue and red components from partially face-on shocks.
Table 2. Hα Broad and Narrow Fits
| Angle | ||||||
|---|---|---|---|---|---|---|
| Slits | Center | Range | VFWHMa (km s−1) | IB/IN | Δ VB-N (km s−1) | GRWH Aperture |
| E2, C1 | 45 | (33.9–56.0) | 789 ± 73 | 0.55 ± 0.15 | 70 ± 9 | 4 |
| E2 | 67 | (57.5–76.3) | 584 ± 55 | 0.48 ± 0.08 | −26 ± 29 | |
| E2, C2 | 78 | (76.7–80.1) | 578 ± 46 | 0.41 ± 0.03 | −31 ± 41 | |
| E2 | 84 | (80.3–88.5) | 896 ± 190 | 0.47 ± 0.04 | 35 ± 15 | 5 |
| E3 | 136 | (127.9–143.5) | 1042 ± 115 | 0.66 ± 0.10 | −79 ± 32 | 7 |
| E3, C1 | 151 | (143.9–159.0) | 941 ± 66 | 0.72 ± 0.07 | −34 ± 22 | 8 |
| E3 | 167 | (159.3–175.4) | 822 ± 75 | 0.61 ± 0.07 | −42 ± 18 | 9 |
| E3, E4 | 187 | (169.5–205.3) | 887 ± 69 | 0.49 ± 0.04 | −46 ± 40 | 10 |
| E5 | 213 | (206.6–218.4) | 777 ± 79 | 0.38 ± 0.02 | −80 ± 22 | 11 |
| C2 | 223b | (222.0–223.6) | 607 | 0.40 | −83 | 12 |
| E5 | 254 | (245.1–263.1) | 853 ± 112 | 0.36 ± 0.05 | −31 ± 40 | |
| E6 | 264 | (258.7–268.8) | 918 ± 105 | 0.36 ± 0.04 | −50 ± 27 | |
| E7 | 290 | (285.3–295.3) | 784 ± 59 | 0.44 ± 0.09 | −36 ± 44 | 13 |
| E7 | 301 | (295.9–306.2) | 630 ± 95 | 0.49 ± 0.11 | −22 ± 26 | 14 |
| E7 | 312c | (306.7–316.5) | 444 ± 48 | 0.24 ± 0.06 | −99 ± 15 | |
| E7 | 350d | (347.8–351.2) | 740.3 | 0.30 | −21.4 | |
Notes. aRanges given are the standard deviation in the fitted values from subapertures and do not explicitly include uncertainties in the measurement. bOnly one subaperture is included as others in the area contained red and blueshifted narrow components. cThe emitting region may not be filling the slit. dOnly one subaperture was extracted here.
Download table as: ASCIITypeset image
Table 3. Slit C1 Interior Nonradiative Broad to Narrow
| Subaperture | Distance | VFWHM (km s−1) | IB/IN | Δ VB-N (km s−1) |
|---|---|---|---|---|
| 4 | 1.6–3.1 | 1016 | 0.98 | −0.4 |
| 5 | 3.2–4.7 | 579 | 0.79 | 140 |
| 6 | 4.8–6.3 | 718 | 0.64 | 119 |
| 8 | 8.3–10.5 | 640 | 0.68 | 55 |
| 9 | 17.6–19.5 | 468 | 0.55 | 355 |
| Mean | 684 ± 207 | 0.73 ± 0.17 | 134 ± 135 |
Download table as: ASCIITypeset image
Figure 7 displays the broad and narrow component results graphically as a function of angle around the rim of the remnant. Figure 8 presents a scatter plot of IB/IN versus VFWHM, where the angle is denoted by the color, in rainbow order from purple to red from north clockwise around the remnant. Also plotted in black are the two data points from GRHW03 that van Adelsberg et al. (2008) presented as having viable fits for the combination of VFWHM and IB/IN. All currently measured values are below these, and well below the minimum IB/IN = 1.0 found in any models of RGHW03. We consulted with M. van Adelsberg, who confirmed that none of our current measurements can be matched by the revised calculations of van Adelsberg et al. (2008; M. van Adelsberg 2008, personal communication). The lone cross in the lower left-hand corner can probably be disregarded, given that the emitting region did not fill the slit aperture. However, the bulk of the measurements lie well below values easily matched by the latest models and cannot be so easily dismissed.
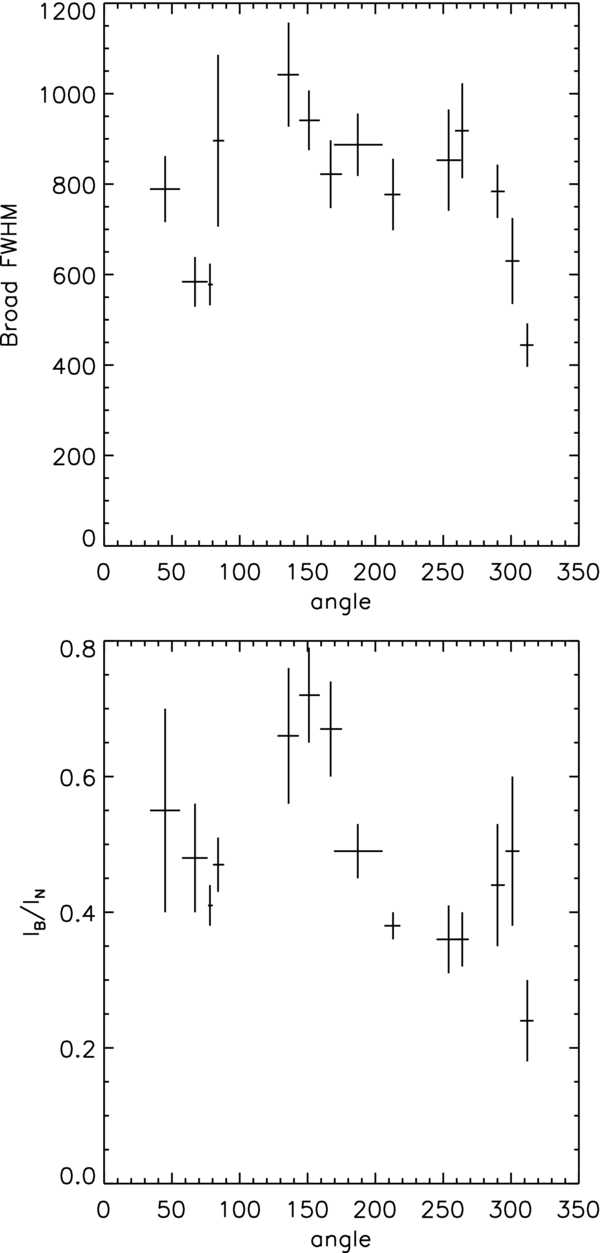
Figure 7. Observed broad component VFWHM and IB/IN for all slit regions for which no radiative emission was seen and multiple subaperture spectra were examined, displayed as a function of angle around the rim.
Download figure:
Standard image High-resolution image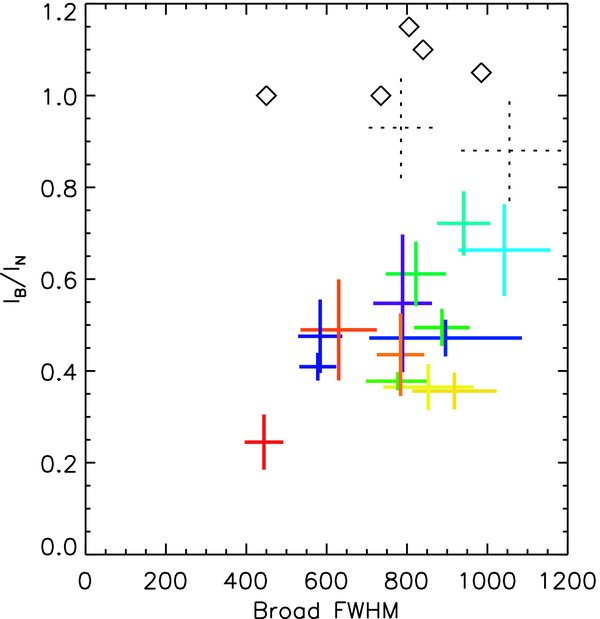
Figure 8. Same as Figure 7, but displayed as VFWHM vs. IB/IN, with the position along the rim denoted by the color of the cross, from purple to red clockwise from north. The two points from the Fabry–Perot measurements of IB/IN by RGHW03 that were matched by van Adelsberg et al. (2008) are plotted in dotted black. Note that a limit of IB/IN ⩾ 1.0 was found over this range of VFWHM by RGHW03, as denoted by the diamonds.
Download figure:
Standard image High-resolution image3.1. Comparison with Previous Observations
The first spectral measurements of DEM L71 were taken by Smith et al. (1991), who estimated values of VFWHM = 600± 75 km s1 IB/IN > 0.6 and VFWHM = 500 ± 150 km s1 IB/IN > 0.7 for the eastern and western rims, respectively. For individual subapertures at similar places in these rims, we find similar but slightly higher values of VFWHM, but distinctly lower values of IB/IN. Given that our final results specifically exclude any regions that show radiative line emission, we are confident that our low IB/IN measurements are real. In their analysis Smith et al. (1991) implicitly assume that the low IB/IN they were finding was due to contamination from radiative regions, whereas their Figure 6 would seem to suggest that IB/IN was even lower for region 2, outside the radiative emission than it was for region 4, which was slightly contaminated.
Our new measurements along the southern edge of DEM L71 should also be compared to the FUSE measurements of Hydrogen Lyβ (λ1025.7) and O vi (λλ1032, 1038) by Ghavamian et al. (2007a) of this segment. Along this region we now find VFWHM as high as 1042 ± 115, as opposed to the 805+140−115 found by GRHW03. This subtle increase in velocity does not alter the conclusion in Ghavamian et al. (2007a) that β is not constrained by the ratio of Lyβ to O vi, only the neutral fraction (0.2–0.4). The measured Lyβ width of 1365 ± 75 km s−1 is still much wider than Hα, thus retaining the conclusion that it must be Doppler broadened by contributions from nontangent filaments. The O vi width of 935 ± 125 km s−1 is now technically, but insignificantly smaller than the measured Hα. Hence, the upper limit on (TO/Tp)0 < 9, based on assuming the O vi width is purely thermal, is essentially unchanged and still the only strong conclusion we can make. However, the low neutral fraction may explain why DEM L71 in particular displays such large discrepancies between the measured IB/IN and models that do not include a CR precursor.
4. RESULTS: RADIATIVE LINES
In Table 4, we present the flux ratios relative to the narrow component of Hα for radiative lines of O, N, and S in the 6200–6800 Å regime for every aperture that showed evidence of radiative line emission. These are listed by the position along the slit and separated by redshift when more than one redshift was seen. No lines were found to be wider than the instrumental resolution, so their widths are not tabulated here. Figure 9 displays scatter plots of the ratio to the Hα narrow component of [N ii] 6583, [O i] 6300, and the sum of [S ii] 6716 and [S ii] 6731. There is a wide range in the flux ratios to Hα as expected given the transition from nonradiative shocks to fully formed radiative shocks. For fully formed recombination zones one would expect the flux ratios from one element to another to be constant, primarily reflecting their relative abundances. For those spectra with detections of [N ii] that is what is seen in Figure 9 for the ratio of [N ii] to [S ii] emission, as marked by the diagonal line. However, there are a handful of spectra with [S ii] emission that fall well below the general trend in the flux ratio of [O i] to [S ii]. These "outliers" include both low and high [S ii] 6716/6731 ratios, so this is not purely a density effect. Rather we consider this more evidence of an incomplete recombination zone, similar to that seen in more detailed studies of the Cygnus Loop (Raymond et al. 1980, 1988). We defer to future work the detailed modeling of the radiative emission required to investigate this further. However, we believe that the ratios seen here are unlikely to require a more exotic explanation like the radiative instability invoked to explain the 2 orders of magnitude spread in flux ratios seen in N49 (Rakowski et al. 2007).

Figure 9. Scatter plots of the flux ratios of [S ii] 6716 + 6731, [N ii] 6548, and [O i] 6300 to Hα. The solid diagonal lines mark the average ratios between [S ii] and [N ii] (upper plot) or [S ii] and [O i] (lower plot). The dashed line in the lower plot was chosen arbitrarily (at 70% of the average) to mark the locus along which most of the [S ii] to [O i] ratios lie.
Download figure:
Standard image High-resolution imageTable 4. Radiative Portions
| Slit | Aperture | 〈Vshift〉 (km s−1) | O i 6300/Hα | O i 6363/Hα | N ii 6548/Hα | N ii 6583/Hα | S ii 6716/Hα | SII 6731/ |
|---|---|---|---|---|---|---|---|---|
| E2 | 5 | 288 | 0.047 | 0.017 | 0.048 | 0.084 | 0.117 | |
| C2 | 3 | 153 | 0.058 | 0.104 | 0.145 | |||
| C2 | 4 | 111 | 0.253 | 0.091 | 0.212 | 0.512 | 0.496 | |
| 415 | 0.098 | 0.053 | ||||||
| C2 | 8 | 239 | 0.154 | 0.050 | 0.055 | 0.194 | 0.315 | 0.379 |
| C2 | 9 | 369 | 0.048 | 0.046 | 0.084 | 0.072 | ||
| C2 | 10 | 351 | 0.037 | 0.056 | 0.057 | |||
| C2 | 11 | 307 | 0.048 | 0.013 | 0.037 | 0.053 | ||
| C1 | 7 | 137 | 0.080 | 0.033 | 0.157 | 0.170 | ||
| C1 | 10 | 105 | 0.100 | 0.112 | ||||
| C1 | 11 | 163 | 0.157 | 0.156 | 0.298 | 0.333 | ||
| C1 | 12 | 57 | 0.169 | 0.047 | 0.048 | 0.144 | 0.326 | 0.343 |
| C1 | 13 | 55 | 0.397 | 0.197 | 0.256 | |||
| 330 | 0.078 | 0.037 | 0.073 | 0.187 | 0.204 | |||
| C1 | 14 | 49 | 0.117 | 0.037 | 0.034 | 0.106 | 0.193 | 0.249 |
| or | 49 (Hα 26) | 0.388 | 0.122 | 0.116 | 0.352 | 0.643 | 0.830 | |
| 342 (Hα 148) | 0.031 | 0.016 | 0.042 | 0.046 | ||||
| E7 | 10 | 304 | 0.061 | 0.040 | 0.047 | |||
| E7 | 11 | 297 | 0.100 | 0.054 | 0.126 | 0.178 | ||
| E7 | 12 | 300 | 0.073 | 0.027 | 0.047 | 0.092 | 0.125 | |
| E7 | 13 | 309 | 0.094 | 0.035 | 0.029 | 0.076 | 0.134 | 0.178 |
| E7 | 14 | 318 | 0.111 | 0.039 | 0.030 | 0.100 | 0.135 | 0.191 |
| E7 | 15 | 301 | 0.057 | 0.021 | 0.046 | 0.047 | ||
| E7 | 16 | 297 | 0.110 | 0.035 | 0.104 | 0.113 | ||
| E7 | 17 | 294 | 0.106 | 0.042 | 0.073 | 0.061 | ||
| E7 | 18 | 297 | 0.097 | 0.032 | 0.050 | 0.032 |
Download table as: ASCIITypeset image
Rather than plotting the individual single-element line ratios for each spectrum, we collect them into histograms in Figure 10. The line ratios for [O i] 6300/6363 and [N ii] 6583/6548 should both theoretically be 3. This is well within one standard deviation from the mean of each distribution (2.8 ± 0.5 and 3.1 ± 0.4 for [O i] and [N ii]) and the scatter is similar to the typical measurement error on the ratio (0.6 and 0.3, respectively). There are a number of entries in Table 4 where [N ii] 6583 was detected but the weaker [N ii] 6548 line was not. Although Table 4 lists only flux ratios to Hα, we note that in each of these cases there were fewer than 60 total counts in [N ii] 6583, implying less than 20 counts in [N ii] 6548, which explains why it would be hard to detect over any broad component of Hα which typically shows a few hundred or more counts. The line ratio of [S ii] 6716/6731 is density dependent, with theoretical values between 1.4 (the ratio of statistical weights) to around 0.5 for extremely high density gas (postshock; Osterbrock 1989). Our observations of [S ii] 6716/6731 between 0.7 and 1.5 are consistent with the expected densities (i.e., ∼1–104 cm−3) in the postshock compressed radiative recombination region behind a shock into typical interstellar densities. No correlation was seen between [S ii] 6716/6731 ratios and the presence of detectable broad component emission.
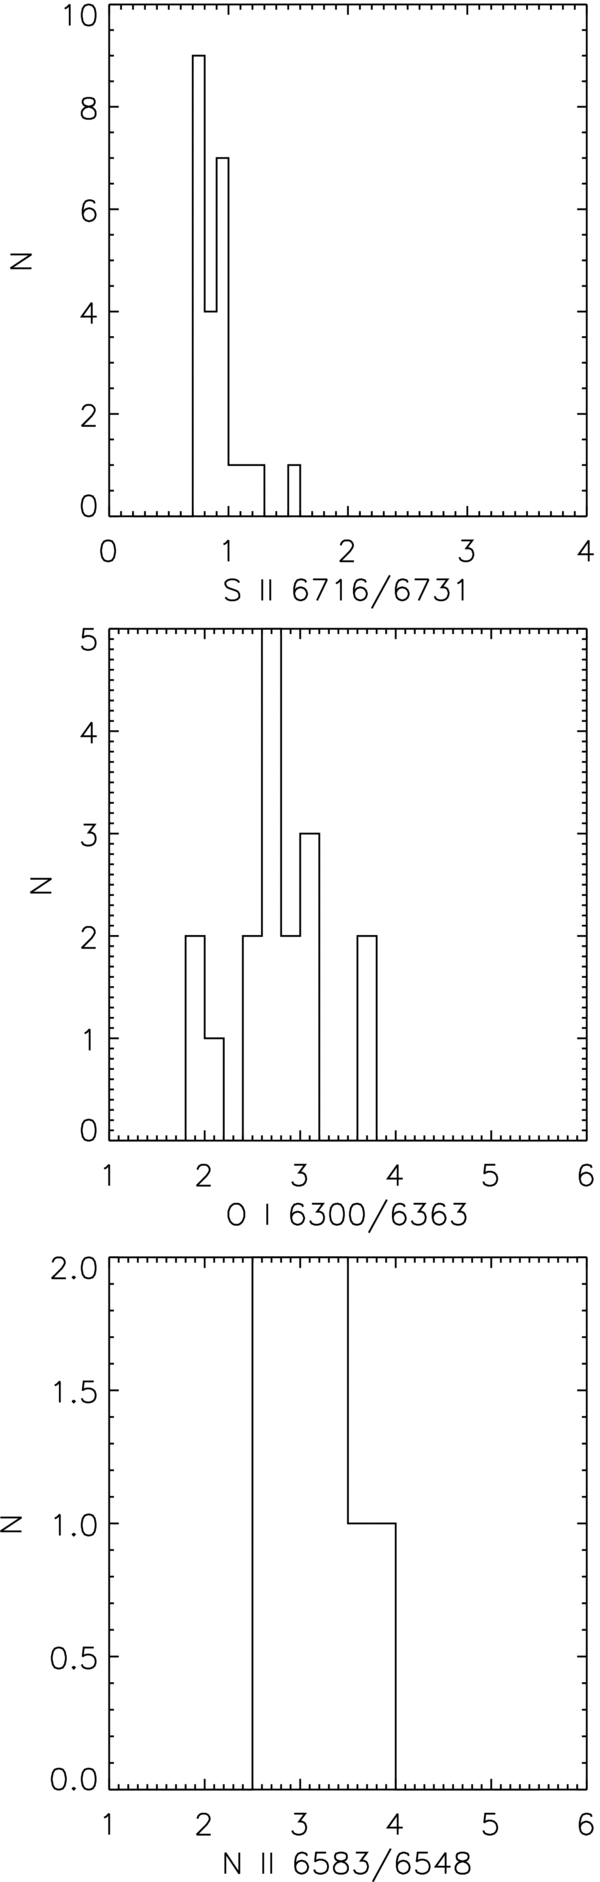
Figure 10. Histograms of the line ratios of S ii 6716/6731, O i 6300/6363, and N ii 6583/6548, for those spectra with bright enough radiative emission that both lines were detectable.
Download figure:
Standard image High-resolution imageIn Figure 11, we plot a histogram of the redshifts of the radiative lines. Most are within 100 km s−1 of the LMC systemic line-of-sight velocity, 262.2 ± 3.4 km s−1 (van der Marel et al. 2002). Four spectra show radiative lines shifted as much as 200 km s−1 from the LMC velocity. However, all of the Doppler shifts found are much smaller than the line broadening seen in Hα at the rim, so unfortunately there is no additional constraint on the shock velocity from potentially face-on shocks.

Figure 11. Histogram of the redshift of the radiative lines, as compared to the typical LMC systemic velocity.
Download figure:
Standard image High-resolution image
For completeness, in Table 5 we include VFWHM and IB/IN for those radiative regions that also showed clear evidence of a broad Hα line. All IB/IN in this table are less than 0.5.
Table 5. Radiative Portions with Detectable Broad Hα
| Slit | Aperture | 〈Vshift〉 (km s−1) | VFWHM (km s−1) | Hα IB/IN |
|---|---|---|---|---|
| E2 | 5 | 288 | 734 | 0.291 |
| C2 | 3 | 153 | 793 | 0.368 |
| C2 | 10 | 351 | 458 | 0.406 |
| C2 | 11 | 307 | 490 | 0.495 |
| C1 | 11 | 163 | 203 | 0.389 |
| E7 | 15 | 301 | 434 | 0.358 |
| E7 | 16 | 297 | 342 | 0.348 |
| E7 | 17 | 294 | 449 | 0.369 |
| E7 | 18 | 297 | 553 | 0.287 |
Download table as: ASCIITypeset image
5. INTERPRETATION
5.1. Hα Broad–Narrow Intensity Ratio
In this section we further consider the implications of our measurements of IB/IN < 1.0, and the fact that none of the most recent calculations of van Adelsberg et al. (2008) can explain these results. In a series of papers beginning with Heng & McCray (2007) and Heng et al. (2007), these authors have considered neutral H encountering a shock, being excited and ionized by various processes in the downstream region. Hence, we suggest that the discrepant IB/IN are explained by ionization and excitation in the upstream region, in particular during passage through the CR precursor. In Ghavamian et al. (2007b) and Rakowski et al. (2008), we suggested that electron heating at SNR shocks occurs through waves excited in an extended precursor formed by CRs. While detailed modeling is required to determine how exactly the IB/IN ratios would be changed, some basic predictions of the size of such a precursor are possible. The length of the CR precursor is approximately κ/vs, the CR diffusion coefficient divided by the shock velocity, which is significantly larger (by orders of magnitude) than other precursors associated with shock reflected ions. In fact Ghavamian et al. (2007b) and Smith et al. (1994) argued for κ ⩽ 1024 (vs/1000 km s−1)2/ne cm2 s−1, in order that neutral H should survive unionized in the precursor to reach the shock front proper.
On the other hand, Ghavamian et al. (2007b) argued that a lower limit on the CR diffusion coefficient should come from the requirement that the precursor be sufficiently long that the minority of electrons in resonance with and energized by the CR-generated waves have sufficient time to communicate their energy to the other ambient electrons. This yields κ ⩾ 1023(vs/1000 km s−1)2/ne cm2 s−1. A further constraint on κ comes from the original idea in Ghavamian et al. (2007b) that in order to obtain the approximate relationship Te/Tp ∝ 1/v2s, κ should be approximately independent of vs. When the CRs are relativistic, it can indeed be shown the momentum dependence is weak (Blandford & Eichler 1987), depending on the spectrum of turbulence. Rakowski et al. (2008) suggest that the generalization of this result (for parallel shocks) to the perpendicular cases of more immediate interest here (see below) renders the momentum dependence even weaker. Accordingly we argue that the CR diffusion coefficient should be in the range 1024–1025 cm2 s−1 (assuming ne ∼ 1 cm−3), and that evidence of destruction of neutral H within the precursor prior to reaching the shock front proper should be manifest at the lower shock velocities in our sample. This should appear as a reduction in IB/IN since less neutral H survives passage through the precursor to produce broad component emission behind the shock. Looking at Figure 8, we see exactly this behavior in our sample of shocks measured in DEM L71. The discrepancy between our measurements and the latest theory of van Adelsberg et al. (2008) arises as neutral H is excited and ionized in the CR precursor, by electrons heated by CR-generated waves. This is distinct from the photoionization of H by photons from the shock, which of course also destroys neutrals, but does not also excite narrow component Hα emission.
Clearly precise modeling of the shock precursor region will be required to make further progress in the interpretation of the intensity ratios IB/IN from DEM L71, similar to that by Wagner et al. (2009) for Tycho's SNR. This is beyond the scope of the current work, but before completing our discussion one further topic requires consideration. We mentioned above that perpendicular shocks are of most relevance here. The reason is that besides exciting waves that heat electrons, a CR precursor may also amplify the magnetic field (e.g., Bell 2005, 2004), and that these amplified field lines are in general perpendicular to the shock velocity vector, rendering the shock quasi-perpendicular. Rakowski et al. (2008) showed that above a critical Alfvén Mach number in the range 12–60 the growth rate for CR amplification of the magnetic field is larger than that for growth of lower-hybrid wave that then damp by heating electrons. Consequently, we expect an extended CR precursor where magnetic field amplification occurs, followed by a shorter (but still long compared to shock dimensions) precursor where electron heating takes place. Our estimate of the CR diffusion coefficient above is therefore an underestimate, since we only considered the electron heating part of the precursor.
5.2. The Narrow Component Width
The CR amplification of magnetic field could also have observational consequences for visible spectroscopy. One puzzling feature in high-resolution optical observations has been the width of the narrow component of Hα (Smith et al. 1994; Sollerman et al. 2003). This is frequently around 30–50 km s−1, and corresponds to a temperature far higher than that where H is neutral in collisional ionization equilibrium in the upstream medium. One possibility is that this broadening comes from the conservation of the adiabatic invariant, v2⊥/B for all plasma particles as the magnetic field increases. An important caveat is that the rate of increase of the magnetic field must be slow compared to the gyrofrequency of the orbiting particles. Since neutral H is coupled to protons by charge exchange, this effectively means that magnetic field growth must be slow compared to the proton–H charge exchange rate, or ≪10−8 s−1. Bell (2004) estimates a growth time of order 100 years, which suitably meets this requirement. Faster magnetic growth would invalidate the adiabatic invariant.
In observations of LMC SNRs, Smith et al. (1994) find no discernible center-to-limb variation in the FWHM of the narrow component, and no obvious dependence on shock velocity. Sollerman et al. (2003) on surveying shocks in RCW 86, Kepler, and SN 1006 find a weak dependence of the FWHM on shock velocity, rising from ∼35 km s−1 at shock velocities of 500 km s−1 to around 45 km s−1 at vs ≃ 2200 km s−1. If the heating were due to magnetic field amplification, this dependence would represent roughly a factor of two increase in magnetic field over a factor of about five in shock velocity. Assuming an initial preshock temperature of 104 K, the initial ion v⊥ ≃ 10 km s−1. Measured FHWMs of 30–50 km s−1 therefore represent a preshock amplification of the magnetic field of approximately one order of magnitude. This degree of amplification is similar to the speculation in Ghavamian et al. (2007b) based on the shock velocities at which complete equilibration is observed in SNRs, compared with those in the solar wind.
In the context of modeling the spatially resolved broad and narrow Hα emission at "knot g" in Tycho's SNR, Wagner et al. (2009) propose a different explanation for the width of the narrow component. Wagner et al. (2009) specifically chose to model sound waves excited by the CR pressure gradient via the Drury instability (Drury & Falle 1986). These acoustic waves damp, heating the preshock plasma and yielding the width of the narrow component as simply the thermal width in the heated precursor. In Wagner et al. (2009) the CR diffusion coefficient, injection parameter for CRs, the CR pressure gradient, and the timescale for energy transfer were parameterized. Also they assumed (for the sake of the first calculations) that the thermal energy gained from damping the acoustic waves is equally shared amongst electrons, protons, He, and neutral H. To match the length scale of the precursor and flux ratios a pre-subshock ion temperature of 105 K is needed. This is higher than the 4 × 10⁴ K implied by the width of the narrow component in Lee et al (2007). That difference can easily be explained by relaxing the arbitrary assumption of equal temperatures, and accounting for the delay in neutral heating from charge exchange. Narrow component emission is seen in Tycho's SNR "knot g" out to ∼1017 cm ahead of the shock (Lee et al. 2007), which they interpret as a photoionization precursor.
Comparison of the Drury instability with that of Bell (2004) is difficult due to uncertainties in the relevant shock parameters, but simple estimates suggest that they are of the same order of magnitude, with magnetic field amplification being favored at faster (i.e., higher Alfvén Mach number) shocks and the Drury instability at slower shocks. In either case, the lower temperature associated with the precursor broadening the narrow component will correspond to a collisional ionization rate for neutral H up to 100 times slower than in the postulated ∼106 K precursor where electrons are heated, thus allowing a precursor of order 100 times as deep, or a CR diffusion coefficient in the range 1026–1027 cm2 s−1. Thus we would interpret the extended precursor of narrow emission ahead of Tycho's SNR as heating in the CR precursor due to the combination of damping of acoustic waves and adiabatic heating in the magnetic field as it is amplified. The thin precursor would represent the short length over which electrons are being heated by CR-generated lower-hybrid waves. Since the electrons require on the order of 1016 cm to be heated and Coulomb equilibrate with each other, and these processes happen gradually through this layer, the neutrals would not be entirely destroyed in this precursor (for an alternative interpretation see Wagner et al. 2009).
6. SUMMARY
We have presented new data on the Hα profile from various positions in the LMC SNR DEM L71, and confirmed previous speculations that the intensity ratio between broad and narrow components of this feature, IB/IN, is discrepant with current models in that either some of the broad component is missing and/or an extra unaccounted contribution to the narrow component exists. We interpret this as being due to excitation and ionization of H in a shock precursor. We have discussed this in some detail with reference to a CR precursor which specifically heats electrons (Ghavamian et al. 2007b; Rakowski et al. 2008), but note that aspects of these observations could also be interpreted in terms of acoustic wave generation in a CR precursor as modeled by Wagner et al. (2009). The influence of the shock precursor on the spectrum emitted from the shock itself is clear, and we argue that the precursor and the CRs producing it should be considered an integral part of the collisionless shock phenomenon.
An obvious next step to understanding the role of CRs is detailed modeling of the precursor in DEM L71 to directly interpret the low IB/IN. It might also be enlightening to obtain higher resolution spectra that would resolve the width of the narrow line and precisely determine the redshifts. Any dependence of the narrow width on shock velocity could be used to distinguish different processes in the CR precursor once the theoretical consequences thereof are understood. Future observatories capable of measuring either optical or X-ray polarization could also assist by providing information on the geometry of the magnetic field in the precursor and immediately postshock (unlikely to be possible in the radio for such weak radio sources as DEM L71).
C.E.R. would like to thank Vicki Tran and Karen Masters for obtaining the E1 slit spectrum on the final night of their observing run. This work was supported by NASA LTSA grant NNH06AD66I, Chandra X-ray Observatory grant NNM08AA22I and by basic research funds of the Office of Naval Research.
Facility: Magellan:Clay
Footnotes
- 4
IRAF is distributed by the National Optical Astronomy Observatory, which is operated by the Association of Universities for Research in Astronomy, Inc., under cooperative agreement with the National Science Foundation.
- 5
The VFWHM listed here have been corrected for the instrumental resolution. The narrow component width is unresolved in these spectra.