


ABSTRACT
Geomagnetic activity late in the sunspot cycle has been used successfully to forecast the amplitude of the following cycle. This success is somewhat surprising, however, because the recurrent high-speed wind streams that trigger the activity are not proxies of the Sun's polar fields, whose strength is a critical factor in many solar dynamo models. Instead, recurrent geomagnetic activity signals increases in the Sun's equatorial dipole moment, which decays on the ∼1–2 yr timescale of the surface meridional flow and does not survive into the next cycle. In accordance with the original empirical method of Ohl, we therefore argue that solar cycle predictions should be based on the minimum level of geomagnetic activity, which is determined by the Sun's axial dipole strength, not on the peak activity during the declining phase of the cycle. On physical grounds, we suggest that an even better indicator would be the total open flux (or strength of the radial interplanetary field component) at sunspot minimum, which in turn can be derived from the historical aa index by removing the contribution of the solar wind speed. This predictor yields a peak yearly sunspot number Rmax = 97 ± 25 for solar cycle 24.
Export citation and abstract BibTeX RIS
1. INTRODUCTION
Geomagnetic activity late in the solar cycle has been found to be a good predictor of the amplitude (maximum sunspot number) of the following cycle (Ohl 1966, 1971; Feynman 1982; Lantos & Richard 1998; Hathaway et al. 1999; Hathaway & Wilson 2006; Hathaway 2009). As the physical basis for this correlation, it has been suggested that late-cycle geomagnetic activity reflects the strength of the interplanetary magnetic field (IMF) and hence that of the Sun's polar fields, from which the sunspots of the next cycle are generated according to dynamo models of the Babcock–Leighton type (Schatten & Sofia 1987; Layden et al. 1991; Schatten & Pesnell 1993). However, the recurrent geomagnetic activity prevalent through the declining phase of the cycle is associated with high-speed wind streams from low-latitude coronal holes, which bear at most a tenuous relationship to the polar fields. The lack of a clear physical understanding of the geomagnetic precursor also leaves open the question of whether the prediction should be based on the maximum or minimum level of geomagnetic activity, and over what portion of the declining phase of the cycle the relevant activity extends.
Figure 1 shows annual averages of the geomagnetic aa index and sunspot number R during the interval 1868–2008. Here, the pre-1957 aa measurements have been corrected as described by Svalgaard et al. (2004) and Svalgaard & Cliver (2007); the recalibrated values are on average 3 nT higher than the original measurements. (The conclusions of this study remain the same even if the calibration correction is omitted.) Also plotted is aaI, the "interplanetary component" of the aa index, obtained by subtracting out from the latter a contribution that depends linearly on R and that is attributed to flares and coronal mass ejections (CMEs) rather than high-speed streams (Ohl 1971; Feynman 1982; Hathaway & Wilson 2006). The aa index exhibits sharply defined minima that occur near (often one year after) the corresponding sunspot minima. From the scatter plot shown in Figure 2, it is evident that the values of aamin are very well correlated (cc = 0.93) with the maximum sunspot number Rmax of the following cycle, as was first noted by Ohl (1966). The relation between enhanced geomagnetic activity and the amplitude of the next cycle is less clearly defined, because aa and aaI often show multiple peaks after sunspot maximum. Nevertheless, however the late-cycle geomagnetic activity is measured (compare the differing methodologies of Ohl 1971; Thompson 1993; Lantos & Richard 1998; Hathaway 2009), the correlations for cycles 12–23 remain relatively high. For example, when the peak in aa (aaI) that occurs closest to sunspot minimum is compared with Rmax of the following cycle, the linear correlation coefficient is found to be cc = 0.74 (cc = 0.86); taking instead the highest peak in aa (aaI) after sunspot maximum, one obtains cc = 0.67 (cc = 0.80).

Figure 1. Annual averages of the aa index (thick solid line), of its "interplanetary component" aaI = aa − 0.097R − 10.9 (thin solid lines), and of the sunspot number R (dotted line) for solar cycles 11–23 (1868–2008). The pre-1957 aa measurements have been scaled upward as discussed by Svalgaard et al. (2004) and Svalgaard & Cliver (2007). The formula for aaI is from Hathaway & Wilson (2006).
Download figure:
Standard image High-resolution image
Figure 2. Scatter plot of maximum yearly sunspot number Rmax vs. lowest yearly value of the aa index near the preceding sunspot minimum, for cycles 12–23. Dashed line represents a linear least-squares fit to the data.
Download figure:
Standard image High-resolution imageThe interpretation and timing of the geomagnetic precursor turn out to be especially critical for forecasting the coming cycle 24. If we employ aamin as the predictor and assign to it a value of 14 nT, the annual average for 2008 (L. Svalgaard 2009, private communication), we would infer from the linear least-squares fit in Figure 2 an amplitude Rmax(24) ≲ 110 ± 16; this estimate represents an upper bound because the minimum in aa may not yet have occurred. If instead we take as the relevant indicator the small secondary peak or shoulder recorded in 2005, when aa = 22 nT (aaI = 8 nT), we would obtain Rmax(24) = 87 ± 29 (88 ± 22). However, if we follow Hathaway & Wilson (2006) and choose the peak of 2003, when the annual aa (aaI) attained its highest ever value of 34 nT (17 nT), the predicted amplitude of cycle 24 would be Rmax = 166 ± 32 (155 ± 26), comparable to or somewhat greater than that of cycles 21 and 22.
Cameron & Schüssler (2007) have attributed the predictive skill of aamin to the overlapping of cycles whose rise times are anticorrelated with their amplitudes. When a given cycle is followed by a weaker (stronger) one, the slow (rapid) rise of the new cycle shifts the minimum to later (earlier) times, when sunspot and geomagnetic activity are at lower (higher) levels. Accordingly, the long decline of cycle 23 and the many spotless days in 2008 foreshadow an even weaker cycle 24. However, the historical record provides only mixed support for a systematic relationship between Rmin and Rmax of the following cycle. For example, sunspot numbers were lower during the minimum preceding cycle 19 than during that preceding the much weaker cycle 20; and a similar "inverse" relationship between Rmin and Rmax was observed for cycles 15 and 16.
In the following section, we discuss the physical basis of the geomagnetic precursor, focusing on the relationship between geomagnetic activity and the large-scale solar magnetic field. In Section 3, we propose a new predictor derived from the aa index, and use it to forecast the amplitude of cycle 24. Our conclusions are summarized in Section 4.
2. GEOMAGNETIC ACTIVITY AND THE SUN'S DIPOLE VECTOR
When averaged over timescales greater than a month, the aa index is highly correlated with V2wB, where Vw is the solar wind speed and B is the total IMF magnitude at Earth (see, e.g., Murayama & Hakamada 1975; Crooker et al. 1977; Rouillard et al. 2007; Svalgaard & Cliver 2007). Figure 3(a) shows three-rotation (82 day) running means of aa, Vw, and the near-Earth radial IMF strength |Br| during 1967–2008. We see a clear tendency for the peaks in aa to occur where Vw or |Br|, and in most cases both Vw and |Br|, are enhanced; the correlation coefficients calculated between aa and Vw, |Br|, and V2w|Br| are, respectively, 0.73, 0.75, and 0.87.
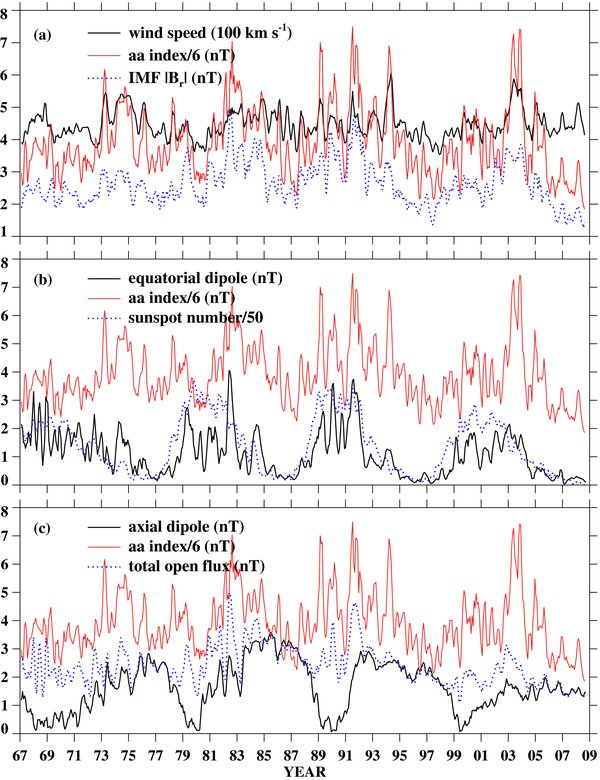
Figure 3. Variation of the aa index during 1967–2008, compared with (a) the solar wind speed Vw and radial IMF strength |Br| at Earth (National Space Science Data Center OMNI 2 data), (b) the Sun's equatorial dipole strength and the sunspot number, and (c) the Sun's axial dipole strength and total open flux. In all cases, 82-day (three Carrington rotation) running means were taken. The dipole strengths and total open flux have been converted to equivalent field strengths (nT) at 1 AU; they were calculated by applying a potential-field source-surface (PFSS) extrapolation (with source surface at r = 2.5R☉) to MWO and WSO photospheric field measurements, corrected for line profile saturation as described in Wang & Sheeley (1995).
Download figure:
Standard image High-resolution imageThe radial IMF strength, being independent of heliographic latitude and longitude (Balogh et al. 1995; Smith et al. 2001; Smith & Balogh 2008), is proportional to the Sun's total open flux, which in turn varies approximately as its net dipole strength (Wang & Sheeley 2002). The magnetic dipole vector may be decomposed into an equatorial (l = 1, |m| = 1) and an axial (l = 1, m = 0) component, whose respective evolutions during 1967–2008 are plotted in Figures 3(b) and 3(c). Here, we have used photospheric field measurements taken by the Wilcox Solar Observatory (WSO) during 1976–1995 and by the Mount Wilson Observatory (MWO) during the remaining intervals. The axial or axisymmetric component Dax varies in a manner similar to the Sun's polar fields, attaining its maximum strength at sunspot minimum and vanishing near sunspot maximum. In contrast, the equatorial dipole component Deq varies roughly in phase with sunspot activity, while undergoing large-amplitude fluctuations lasting ∼1–2 yr. The equatorial dipole strength is a function of both the level of sunspot activity and its distribution in longitude; the highest peaks (including those of 1982, 1991, and 2003) occur when large active regions emerge with their east–west dipole moments "in phase" with each other (Wang & Sheeley 2003). Unless maintained by new flux emergence, Deq decays on the timescale of the surface meridional flow, which transports the active region remnants to midlatitudes, where the steep rotational gradients combine with supergranular diffusion to annihilate the nonaxisymmetric component of the large-scale field.
From Figure 3(b), we note a general tendency for strengthenings of the equatorial dipole to coincide with peaks in the aa index. This correlation arises because: (1) an increase in Deq leads to an increase in the total open flux and IMF strength; (2) during the declining phase of the cycle, when Dax is large, an increase in Deq causes the Sun's net dipole vector to tip toward the equator, giving rise to recurrent high-speed streams at Earth from the pair of large open field regions centered on the tilted dipole axis; (3) an increase in Deq is often accompanied by an increase in the number of fast CMEs (see Figure 6(b) in Wang et al. 2006). Thus, for example, the unprecedented peak in the aa index in 2003 can be attributed to the combination of a strong equatorial dipole, the associated year-long recurrent high-speed stream from a large lobe of the south polar hole, and a succession of major flare/CME events late in the year. As discussed in Wang & Sheeley (2003), the ∼1.2–1.7 yr quasi-periodicities intermittently detected in geomagnetic activity and the solar wind speed (Silverman & Shapiro 1983; Richardson et al. 1994; Paularena et al. 1995; Mursula & Vilppola 2004) may be a result of stochastic, meridional-flow-limited fluctuations in Deq.
Given that it represents a fluctuating, relatively short-lived component of the large-scale field which must be continually regenerated by sunspot activity, the equatorial dipole cannot act as a seed for the toroidal flux of the next cycle. The axisymmetric dipole component, on the other hand, undergoes a systematic evolution over the sunspot cycle, reflecting the tendency for the north–south dipole moments of the active regions to be aligned in the same sense (Joy's law), so that their resultant grows cumulatively. As may be seen from Figure 3(c), the axial dipole provides by far the largest contribution to the Sun's open flux near sunspot minimum (when the curves representing Dax and the total open flux are almost indistinguishable). Assuming, then, that aamin scales roughly as Dax and that the sunspots of the following cycle are generated from the poloidal field represented by Dax, we conclude that it is the lowest—not highest—value of the aa index near sunspot minimum that should be used as the solar cycle predictor. Furthermore, an even better indicator would be the radial IMF strength at sunspot minimum, in the absence of reliable measurements of the polar fields themselves.
During the present (2008) activity minimum, the Sun's equatorial dipole and quadrupole (l = 2) components have remained sufficiently strong compared with the axial dipole to cause the heliospheric current/plasma sheet (and white-light streamers in the outer corona) to deviate by as much as ∼20° from the heliographic equator (see Figure 4). Nevertheless, |Br| and the total open flux are still determined almost entirely by the axial dipole component. This can be understood by noting that the total dipole strength D = (D2ax + D2eq)1/2 may be approximated as D ≃ Dax[1 + (1/2)(Deq/Dax)2] when Deq ≪ Dax; thus, the total open flux (which scales as D) depends on Deq only to second order. In contrast, the dipole tilt angle δ = tan−1(Deq/Dax) ≃ Deq/Dax varies linearly with Deq.
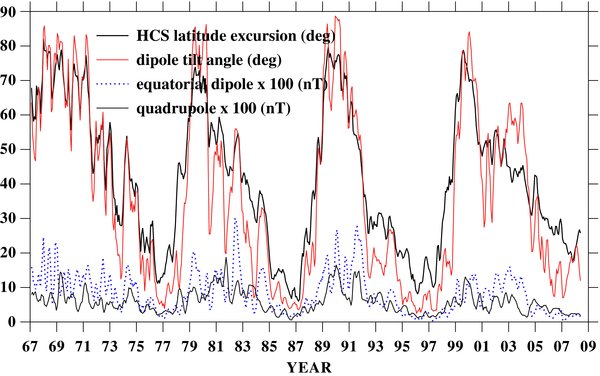
Figure 4. Variation of the maximum latitudinal excursion of the heliospheric current sheet during 1967–2008; here, the highest latitude reached by the source-surface neutral line has been averaged between the Northern and Southern hemispheres. Also plotted are the dipole tilt angle δ = tan−1(Deq/Dax), the equatorial dipole strength, and the total quadrupole strength. Three-rotation running means have been taken, and the equatorial dipole and quadrupole moments have been expressed as equivalent field strengths at 1 AU. The latitudinal excursion of the current sheet from the heliographic equator is unusually large during the present sunspot minimum because of the weakness of the polar fields. Nevertheless, as is evident from Figure 3(c), the total open flux is still almost entirely dominated by the axial dipole component.
Download figure:
Standard image High-resolution image3. THE RADIAL IMF STRENGTH AS SOLAR CYCLE PREDICTOR
Svalgaard & Cliver (2005) have devised a new geomagnetic index, called IDV, which is highly correlated with B but (unlike aa) is almost independent of Vw. By comparing IDV with aa (after correcting the latter time series for instrumental intercalibration errors), Rouillard et al. (2007) extracted the long-term variation of the solar wind speed and then deduced |Br| from the Parker spiral formula |Br| = B/[1 + (ΩSrEcos LE/Vw)2]1/2, where ΩS denotes the Sun's angular velocity, rE = 1 AU, and LE is the heliographic latitude of the Earth.
In Figure 5, we have plotted the annual averages of |Br| derived by Rouillard et al. (2007) for the minima of cycles 13–22 against the amplitude of the following cycle. A least-squares fit to the scatter plot yields Rmax = −39 + 85(|Br|ssmin/nT), with a standard deviation of 25 and a correlation coefficient of 0.80. In situ spacecraft measurements give |Br| = 1.6 nT for the average radial IMF strength over the period 2008 January–September. Employing |Br|ssmin as the precursor, then, we find that Rmax = 97 ± 25 for cycle 24. This value is roughly consistent with the predictions based on the minimum of the aa index (Rmax ≲ 110) and on its last peak (Rmax ≃ 87), but is much smaller than the estimate Rmax ≃ 160 derived from the large 2003 peak. On the other hand, it is somewhat higher than the values Rmax ≃ 75–80 inferred by comparing current polar field measurements with those made during the 1976, 1986, and 1996 sunspot minima (Svalgaard et al. 2005; Schatten 2005; Choudhuri et al. 2007). We note, however, that the latter forecasts are based on magnetograph data extending only over the past ∼40 yr.
Figure 5. Scatter plot of maximum sunspot number Rmax vs. radial IMF strength at the preceding sunspot minimum, derived from the aa index as described in Rouillard et al. (2007). Dashed line represents a least-squares fit to the annually averaged data.
Download figure:
Standard image High-resolution image
In the scatter plots of Figures 2 and 5, cycle 19 is an obvious outlier located far above the regression line. Based on both the aa index and the aa-derived radial IMF strength, which was somewhat lower during the minimum preceding cycle 19 than during that preceding cycle 22, cycle 19 should have been weaker than cycle 22, but instead turned out to have a much higher amplitude. The polar faculae measurements of Sheeley (2008), however, indicate that the polar fields were as much as ∼70% stronger in 1954 than in 1986; eclipse photographs also show that the coronal streamers were highly flattened toward the equator. These observations, as well as the unusually low level of sunspot activity in 1954, suggest that the Earth remained very close to the heliospheric current sheet, as is indeed consistent with the pronounced semi-annual modulation in the geomagnetic activity recorded at that time (when the current sheet was so flat that the local IMF polarity was determined entirely by the 7° tilt of the solar rotation axis: cf. Rosenberg & Coleman (1969)). In that case, the average radial IMF strength at Earth may not have reflected the full strength of the Sun's axial dipole component, leading to an underestimate of Rmax(19).
It should be emphasized that most of the scatter in Figures 2 and 5 is likely to be of physical origin, since the cycle amplitude will depend on parameters in addition to Dax. The amount of scatter that might be expected is illustrated by Figure 6(a) in Wang et al. (2005), who used a surface flux-transport model with time-varying meridional flow to model the evolution of the Sun's large-scale field during cycles −3 through 22.
Dikpati et al. (2006) applied their flux-transport dynamo model to predict that cycle 24 will be 30%–50% higher than cycle 23 (see also Dikpati & Gilman 2006). In their two-dimensional simulations, the magnetic field at the solar surface is completely disconnected from its source in the tachocline. Before it can be reconverted into toroidal flux, the polar field must be advected bodily down to the bottom of the convection zone, a slow process that greatly prolongs the recycling time. Consequently, Dikpati et al. find that the sunspots of cycle n are created from the polar fields formed during cycles (n − 1), (n − 2), and (n − 3), the strongest correlation being with cycle (n − 2). If we compare |Br|ssmin of cycle (n − 2) with Rmax of cycle n, we obtain a correlation coefficient of 0.70. In this case, with the radial IMF strength being 2.0 nT at the end of cycle 22, a linear regression would yield Rmax(24) = 134 ± 27. As noted by Choudhuri et al. (2007) and Yeates et al. (2008), the Dikpati et al. predictions depend on the assumption of a relatively small turbulent diffusivity inside the convection zone. If a value closer to that observed at the photosphere is adopted, the surface field is able to diffuse through the convection zone on a timescale much shorter than that for advection, so that the toroidal field of cycle n would be generated from the polar field of cycle (n − 1). The same would be the case in a realistic three-dimensional system, where the surface field remains linked to the bottom of the convection zone by means of continual field–line reconnection, just as the quasi-rigidly rotating field in the outer corona continually rearranges its connections (on much shorter timescales) to the differentially rotating photospheric field.
In surface flux-transport models, the axial dipole and polar field strengths at sunspot minimum are determined by the total amount of photospheric flux Φeq that diffuses across the equator after polar field reversal; in the absence of such cross-equatorial transport, the two polarities exactly cancel each other in a given hemisphere and no net magnetic flux reaches the poles (see, e.g., Wang & Sheeley 1991). Accordingly, Cameron & Schüssler (2007) have proposed that Φeq be used as a proxy for the polar field strength and thus as a predictor of the next cycle (see also the discussion of Dikpati et al. 2008). However, deriving Φeq is not a straightforward matter, for it depends sensitively on the axial tilts of active regions at low latitudes and on the meridional flow speed near the equator, which acts to impede the cross-equatorial diffusion and may well vary from cycle to cycle (as well as during each cycle).
4. CONCLUSIONS
The main points of this Letter may be summarized as follows.
- 1.Recurrent geomagnetic activity during the declining phase of the cycle is associated with increases in the Sun's equatorial dipole strength, which causes the dipole axis to tilt equatorward and brings high-speed wind into the ecliptic. However, the equatorial dipole component decays away on the ∼1–2 yr timescale of the surface meridional flow, and therefore cannot provide a seed field for the next cycle.
- 2.The toroidal flux of the next cycle is generated from the axial dipole component, which provides the dominant contribution to the Sun's open flux around sunspot minimum. Because the polar fields are difficult to measure, the radial IMF strength at sunspot minimum may represent a more reliable solar-cycle indicator.
- 3.As shown by Rouillard et al. (2007), the long-term variation of the radial IMF strength (or total open flux) can be deduced from the aa time series by removing the contribution of the solar wind speed. This procedure yields a predicted amplitude of Rmax = 97 ± 25 for cycle 24.
We are indebted to L. Svalgaard for helpful comments and for sending us his recalibrated aa values, to A. P. Rouillard and M. Lockwood for providing their open-flux time series derived from the aa and IDV indices, and to R. K. Ulrich (MWO) and J. T. Hoeksema (WSO) for making available the photospheric field data used in Figures 3 and 4. This work was supported by NASA and the Office of Naval Research.