
Abstract
Supergiant fast X-ray transients are a sub-class of high mass X-ray binaries, in which the compact object is a neutron star and it is accreting materials from its non-degenerate companion star. The sample of supergiant fast X-ray transients from XMM-Newton public observations have been intensively studied, and hence the corresponding parameters for identifying X-ray flares have been obtained by Sidoli et al., such as the rise time, the decay time, the duration time, the waiting time, the peak luminosity, the isotropic energy and the mean luminosity. In order to investigate the origin of the X-ray flares from the supergiant fast X-ray transients, we apply the cumulative distribution method with the power-law index  to the target sample. We then find that the relevant parameters can be well described by the cumulative distribution with indices 1.0–1.9 for IGR J16418-4532, IGR J16328-4726 and IGR J18450-0435, respectively. This finding indicates that the X-ray flares are likely to be produced by the self-organizing critical process, one possible scenario may be due to reconnection in magnetized stellar wind blobs approaching into the magnetosphere of magnetized neutron star. Therefore, we suggest that the high mass X-ray binaries with similar X-ray flares likely belong to the self-organized criticality systems.
Export citation and abstract BibTeX RIS
1. Introduction
Supergiant fast X-ray transients are a sub-class of high mass X-ray binaries, in which a neutron star is accreting a fraction of the stellar winds from an early-type supergiant star (see Walter et al. 2015; Martínez-Núñez et al. 2017). A series of transient X-ray flares could be produced by the accretion process in X-ray binary systems. Observational features from the X-ray flares of supergiant fast X-ray transients can be obtained in the XMM-Newton public archive and INTEGRAL data, which covers a large range of soft X-ray luminosities. The relevant parameters of X-ray flares, e.g., rise times, decay times, duration times, energies and luminosities, have been obtained in Sidoli et al. (2019).
X-ray flares are also common astrophysical phenomena in the universe (Zhang 2007). They have been observed in stars, X-ray binaries, especially in the Sun (Aschwanden 2011; Shibata & Magara 2011), gamma-ray bursts (GRBs; Burrows et al. 2005; Falcone et al. 2006; Nousek et al. 2006; Zhang et al. 2006; Yi et al. 2016, 2017; Mu et al. 2016; Yi et al. 2021), the tidal disruption event (TDE) Swift J1644 + 57 (Burrows et al. 2011; Bloom et al. 2011; Zheng et al. 2020) and some active galactic nuclei (AGNs; Rees 1984; Yan et al. 2018). From the observational point of view, X-ray flares show a sharp rise and decay, and their luminosities from different systems cover a large range of energy band.
Therefore, it is necessarily required to systematically analyze the properties of X-ray flares from different systems and further investigate their physical origin. Interestingly, Wang & Dai (2013) found that both GRB X-ray flares and solar flares show similar power-law distributions for the waiting times, energies and duration times, respectively. It is well known that solar X-ray flares can be produced by the process of magnetic reconnection and predicted in a self-organized criticality system (Bak et al. 1987; Bak & Tang 1989; Lu & Hamilton 1991; Aschwanden 2011; Shibata & Magara 2011). It is believed that the X-ray flares found in GRBs may also have the same physical mechanism as that in the Sun. In addition to that, similar power-law distributions of flares have been found in other systems, e.g., soft gamma repeaters (Cheng et al. 2020), repeating fast radio bursts (Wang et al. 2017; Zhang et al. 2020), some black hole binary systems (Wang et al. 2015; Yan et al. 2018) and type I X-ray bursts from low-mass X-ray binary systems (Wang et al. 2017). Type I X-ray bursts are common flashes in low-mass X-ray binary systems and they are considered to be generated by the unstable nuclear burning of accreted materials (Woosley & Taam 1976; Joss 1977). Wang et al. (2017) analyzed some type I X-ray bursts and found the power-law-like distributions for fluence, peak count, rise time, duration and waiting time. For some supergiant fast X-ray transients, which have been analyzed systematically for several years of publicly available INTEGRAL observations in the hard X-rays, the cumulative luminosity distributions have been extracted by Paizis & Sidoli (2014) and Sidoli & Paizis (2018). The power-law like distributions for the temporal behavior of the X-ray flares from supergiant fast X-ray transients are also found by Sidoli et al. (2016). They suggested that the power-law features for the selected supergiant fast X-ray transients are an indication of self-organized criticality. Therefore, it is critical to systematically investigate the properties of X-ray flares produced by the high mass X-ray binaries.
In general, obtaining power-law distributions plays a critical role in understanding its physical origin in self-organized criticality systems. Here we analyze the supergiant fast X-ray transient data provided by Sidoli et al. (2019) and apply the cumulative distribution method to obtain corresponding physics-motivated parameters. We then investigate the obtained parameters of the rise times, decay times, duration times, waiting times, energies, as well as the luminosities distributions of X-ray flares from high mass X-ray binaries. We then compare the cumulative distributions with those of other systems. In Section 2, we present the selected X-ray flare samples and the methods for further analysis. Finally, the distributions of X-ray flare parameters are shown in Section 3 and our conclusions are given in Section 4.
2. Data and Methods
Sidoli et al. 2019 obtained some essential features of the X-ray flares extracted from the "Exploring the X-ray Transient and variable Sky" (EXTraS) database. The project of EXTraS is aimed at extracting the temporal information of the observed sources from the public archive observed by the XMM-Newton in the energy range of 0.2–12 keV (Sidoli et al. 2019). They supposed that an "X-ray flare" should have a significant peak comparing with the surrounding adjacent emission. By means of a Bayesian blocks analysis of the light curves with X-ray flare from some supergiant fast X-ray transients (Sidoli et al. 2019), a total of 144 X-ray flares (nine sources) have been obtained. In particular, these identified flares can be used to identify the parameters of X-ray flares, e.g., the rise time, the decay time, the duration time, the waiting time, the peak luminosity, the isotropic energy and the mean luminosity. More details about the parameters of X-ray flares can be found in Table A1 of Sidoli et al. (2019). Yi et al. (2016) also further analyzed all the significant X-ray flares from the GRBs observed by Swift/XRT between 2005 and 2015, in which 500 X-ray flares are collected. The corresponding parameters for GRB X-ray flares are given by fitting with a smooth broken power law function.
However, the waiting times mentioned by Yi et al. (2016) are very different from that by Sidoli et al. (2019). Sidoli et al. (2019) defined the waiting time as Twaiting = Tpeak,i+1 − Tpeak,i , the time interval between the peaks of subsequent flares, while the waiting time for GRB X-ray flares is defined as Twaiting = Tstart,i+1 − Tstart,i , where Tstart,i+1 and Tstart,i are the start times for the i + 1th and ith flares, respectively (Yi et al. 2016). Although the two types of waiting times are defined differently, there is a small discrepancy between them as the duration is not too long. This definition of waiting time is also used widely in some other natural systems (Wang & Dai 2013; Wang et al. 2015, 2017; Zhang et al. 2020), especially for the solar X-ray flares (Wheatland et al. 1998; Aschwanden 2011). For some sources, the number of X-ray flares is limited. Therefore, we selected 86 X-ray flares for IGR J16418-4532, IGR J16328-4726 and IGR J18450-0435. We took the values of X-ray flares for the three different sources given in Table A1 of Sidoli et al. (2019) and investigated the distributions of them. Note that the derived parameters by Sidoli et al. (2019), which will be investigated by us, are dependent on the parameters of the Bayesian block algorithm. In this paper, we are mainly focused on investigating whether or not the cumulative distribution of the relevant parameters follows a power law form. Therefore, there may have no influences on our studies for the different definition of the waiting time and the use of different parameters by the Bayesian block algorithm, which would change the values of the power law index rather than the form.
For the three sources, the number of X-ray flares is not sufficient to bin the data, therefore, the cumulative distribution rather than a differential distribution of a power law model, is chosen for further analyses. The benefit of using the cumulative distributions is that there is no need to arbitrarily bin the X-ray flare data, enabling a comparison among the selected sources for different parameter distributions and avoiding the loss of information for the X-ray flares. Compared with Sidoli et al. (2019), we compiled more parameters about X-ray flares from SFXTs, including the rise time, the decay time, the duration time, the waiting time, the isotropic energy, the mean luminosity and the peak luminosity for X-ray flares. In general, the observed differential distribution for the number of events can be described with a threshold power-law distribution as follows

A cumulative number distribution is usually defined as the integral of the total number of events above a given value x. Therefore, the corresponding cumulative distribution function of Equation (1) can be written as follows (αx ≠ 1) (Aschwanden 2015; Lyu et al. 2020)
where x0 is a constant by considering the threshold effects (e.g., incomplete sampling below x0, background contamination), αx
is the power law index of the distribution of flares, Nenv refers to the total number of events, x1 and x2 are the minimum and maximum values of x, respectively. The uncertainty of the cumulative distribution in a given bin i is approximately calculated as  , where Ncum,i
is the number of events in the ith bin. It can be seen that there are only two free parameters in the cumulative distribution function. Due to the existence of selection effect, it is inevitable that there will be some points with serious deviation from the normal cumulative distributions. In the process of our data fitting, we do not consider the individual data points that clear out of the normal cumulative distributions. Generally, because of incomplete sampling for those selected X-ray flares, the cumulative distributions will be generated above the threshold x0. Therefore, when adopting the threshold x0 as a free parameter along with the index αx
to fit the cumulative distributions, the power law index αx
for X-ray flares can be well constrained. It also should be pointed out that the cumulative number distribution of Equation (2) is a power law function with an index of αx
, therefore the derivation of the power law index though the X-ray flare values are an important quest in this work.
, where Ncum,i
is the number of events in the ith bin. It can be seen that there are only two free parameters in the cumulative distribution function. Due to the existence of selection effect, it is inevitable that there will be some points with serious deviation from the normal cumulative distributions. In the process of our data fitting, we do not consider the individual data points that clear out of the normal cumulative distributions. Generally, because of incomplete sampling for those selected X-ray flares, the cumulative distributions will be generated above the threshold x0. Therefore, when adopting the threshold x0 as a free parameter along with the index αx
to fit the cumulative distributions, the power law index αx
for X-ray flares can be well constrained. It also should be pointed out that the cumulative number distribution of Equation (2) is a power law function with an index of αx
, therefore the derivation of the power law index though the X-ray flare values are an important quest in this work.
3. Results and Discussion
According to the report in Appendix Table A1 of Sidoli et al. (2019), some of X-ray flares are not well identified, and they have marked those unresolved flares with an asterisk in Table A1. Although the number of unresolved flares is limited, we still divided those X-ray flares into two groups for each source, i.e., the whole sample and the resolved flares sample. In this work, we use a python module pymc 3 to fit the data and get the confidence intervals of the parameters with the Monte Carlo Markov Chain (MCMC) method. Generally, because of incomplete sampling at a low value threshold, the distributions of X-ray flare parameters show an approximate flat part or a gap at the beginning regime (Cliver et al. 2012; Aschwanden 2015; Wang et al. 2015). Therefore, in order to avoid the selection effect or the influence of incomplete sampling, the cumulative distributions for the X-ray flares are fitted with Equation (2) above the threshold x0 (the dashed line). The fitting results αx of each parameter are shown in Table 1.
Table 1. The Best-fitting Power-law Slopes (αx ) of Each Parameters of Three Sources
| Source | IGR J16418-4532 | IGR J16328-4726 | IGR J18450-0435 | |||
|---|---|---|---|---|---|---|
| Parameter | Resolved | All | Resolved | All | Resolved | All |
| Rise | 1.71 ± 0.19 | 1.82 ± 0.13 | 1.47 ± 0.28 | 1.53 ± 0.26 | 1.65 ± 0.25 | 1.74 ± 0.21 |
| Decay | 1.84 ± 0.15 | 1.92 ± 0.09 | 1.08 ± 0.08 | 1.14 ± 0.13 | 1.55 ± 0.18 | 1.80 ± 0.18 |
| Duration | 1.94 ± 0.07 | 1.95 ± 0.07 | 1.87 ± 0.14 | 1.74 ± 0.21 | 1.58 ± 0.26 | 1.70 ± 0.24 |
| Waiting Time | 1.58 ± 0.27 | 1.93 ± 0.06 | 1.34 ± 0.25 | 1.34 ± 0.25 | 1.58 ± 0.28 | 1.72 ± 0.25 |
| Eiso,37 | 1.47 ± 0.25 | 1.55 ± 0.24 | 1.61 ± 0.26 | 1.68 ± 0.24 | 1.47 ± 0.28 | 1.33 ± 0.25 |
| Liso,34 | 1.78 ± 0.21 | 1.91 ± 0.11 | 1.22 ± 0.21 | 1.23 ± 0.20 | 1.46 ± 0.28 | 1.70 ± 0.25 |
| Lpeak,34 | 1.59 ± 0.15 | 1.78 ± 0.22 | 1.54 ± 0.28 | 1.59 ± 0.27 | 1.50 ± 0.26 | 1.63 ± 0.26 |
Download table as: ASCIITypeset image
The cumulative distributions of different parameters for all three sources are shown in Figures 1–7. For the cumulative distributions of IGR J16418-4532, the best-fitting power-law slopes of the rise time, the decay time, the duration time, the waiting time, the isotropic energy, the mean luminosity and the peak luminosity for X-ray flares for resolved flares are 1.71 ± 0.19, 1.84 ± 0.15, 1.94 ± 0.07, 1.58 ± 0.27, 1.47 ±0.25, 1.78 ± 0.21 and 1.59 ± 0.15, respectively. The best-fitting power-law indices of the corresponding values for the whole sample of IGR J16418-4532 are 1.82 ± 0.13, 1.92 ±0.09, 1.95 ± 0.07, 1.93 ± 0.06, 1.55 ± 0.24, 1.91 ± 0.11 and 1.78 ± 0.22, respectively. Both the whole sample and the subsample show the similar power-law distributions of the different X-ray flare parameters. More interestingly, the similar power-law like distributions for the supergiant fast X-ray transients are found by Paizis & Sidoli (2014), who investigated nine years of INTEGRAL X-ray flare data (17–100 keV). The long-based INTEGRAL observations for all currently known supergiant fast X-ray transients are fully applied to characterize their hard X-ray transient emission for the first time, by means of the cumulative luminosity distribution with their supergiant fast X-ray transient flares. The average luminosity distribution for IGR J16418-4532 in Paizis & Sidoli (2014) is 1.31 ± 0.31, and the power-law slope is well consistent with our values for this same X-ray transient.
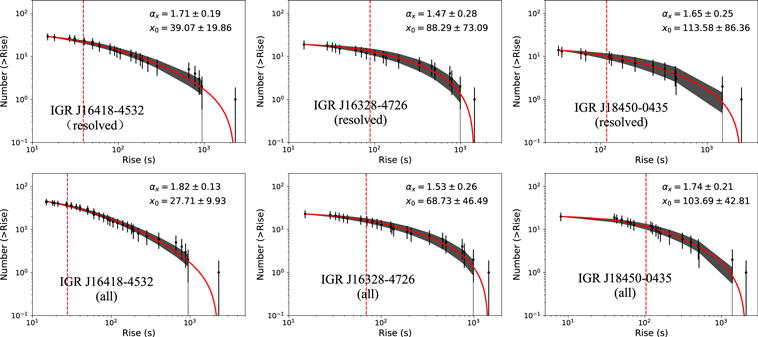
Figure 1. The best-fit indices are shown for the cumulative distributions of the rise time of X-ray flares from IGR J16418-4532, IGR J16328-4726 and IGR J18450-0435, respectively. Top panel: Distributions of the resolved X-ray flares. Bottom panel: Distributions of all X-ray flares. The gray region stands for the 95% confidence level, the red line is the best fitting result, and the dashed line is marked as the threshold x0.
Download figure:
Standard image High-resolution image
Figure 2. Distributions of the decay time of X-ray flares.
Download figure:
Standard image High-resolution image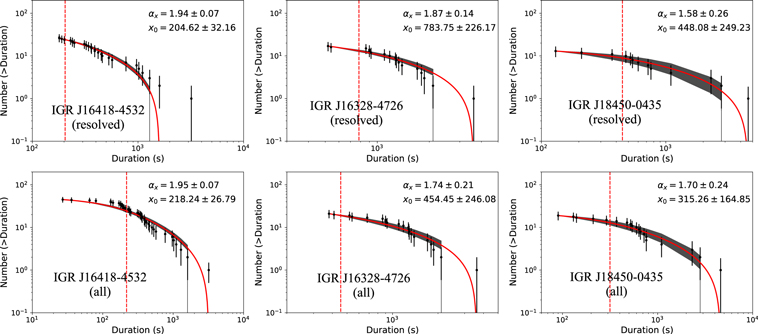
Figure 3. Distributions of the duration time of X-ray flares.
Download figure:
Standard image High-resolution image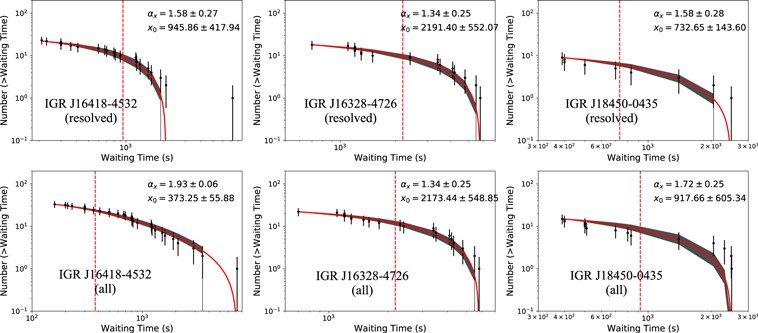
Figure 4. Distributions of the waiting time of X-ray flares.
Download figure:
Standard image High-resolution image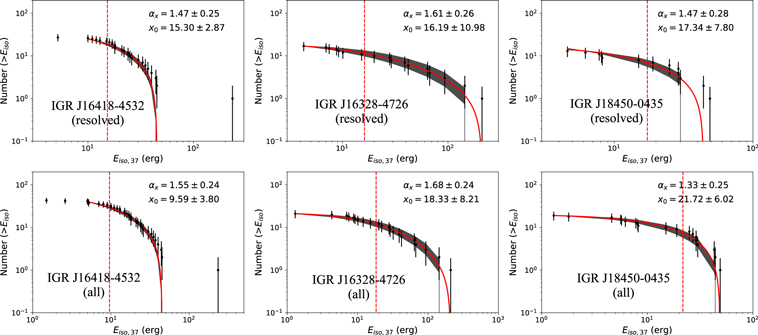
Figure 5. Distributions of the isotropic energy of X-ray flares.
Download figure:
Standard image High-resolution image
Figure 6. Distributions of the mean luminosity of X-ray flares.
Download figure:
Standard image High-resolution image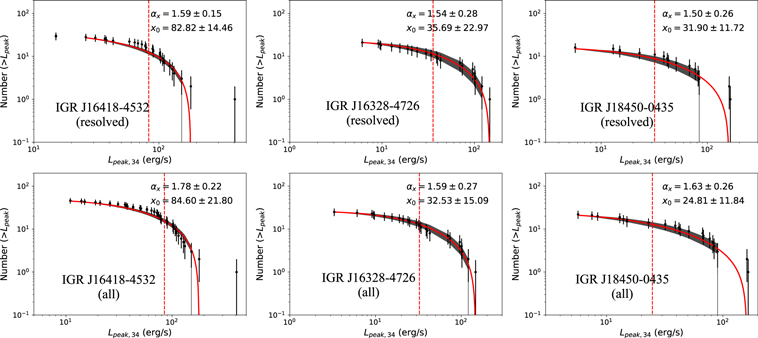
Figure 7. Distributions of the peak luminosity of X-ray flares.
Download figure:
Standard image High-resolution image
The observed flares of supergiant X-ray flares are probably connected with neutron star accreting winds from its supergiant companion. The actual accretion rates are dependent on the specific winds and the orbital velocity of such a system. This has been proposed to explain the observed flares in supergiant X-ray transients (Shakura et al. 2014). In this scenario, a large amount of plasma at a high accretion rate onto a neutron star is required to produce the bright X-ray flares and the Rayleigh–Taylor instability could occur in a quasi-spherical shell above the magnetosphere shell of the neutron star. This instability is produced by an instant increase during the accretion, sporadically given by the stellar winds of the optical OB-companion in supergiant evolutionary phase (Sidoli et al. 2019, 2021). Therefore, such instability can reproduce the observed flares, which is associated with a large energy released from the supergiant fast X-ray transients. When considering the orbital motion of the neutron star in the binary system, the flares accompanied with some smoothing variations could occur. More detailed descriptions can be found in Shakura et al. (2014) and Paizis & Sidoli (2014). As the discussion from Paizis & Sidoli (2014), their results suggested that SFXTs flares can be possibly considered as "avalanches" in self-organized criticality systems, which are triggered when a critical state is reached. In this case, accretion can be interpreted as the slow and steady driver toward the critical state required to the self-organized criticality system to produce the avalanche.
Similar distributions of X-ray flares for IGR J16328-4726 and IGR J18450-0435 are also appeared, respectively. Both sources show the similar power-law distributions for the whole sample and subsample. The rise times, decay times, duration times, waiting times, energies and luminosities distributions can be well described by the power-law model for X-ray flares from supergiant fast X-ray transients. We suggested that the power-law like behavior for those flares should be an indication of self-organized criticality, and the supergiant fast X-ray transients flares should be associated with avalanching resulting in a self-organized criticality system when an instability threshold is arrived. Our results are consistent with the interpretations for supergiant fast X-ray transients flares in Shakura et al. (2012, 2014) and Paizis & Sidoli (2014).
Furthermore, the characteristics of self-organized criticality systems are the scale-free power law distributions of various event parameters, such as the duration time, the isotropic energy or the peak luminosity of events. According to Aschwanden (2012), who provided a theoretical framework to quantitatively connect the concept of fractal dimensions to the cumulative frequency distributions of self-organized criticality avalanche systems. It is theoretically predicted that the power-law slope of cumulative frequency distribution for the self-organized criticality systems can be defined with the Euclidean space dimensions S = 1, 2, 3. Some theoretical indices, such as the duration frequency distribution (αT
), the isotropic energy distribution (αE
) and the peak luminosity distribution (αL
) of X-ray flares, have been provided by Aschwanden (2012) as  ,
,  and
and  , where S = 1, 2 and 3 are the Euclidean dimensions. It can be seen that the indices are αT
= αE
= αL
= 1 for S = 1, αE
= 1.29 and αT
= αL
= 1.5 for S = 2, αT
= 2, αE
= 1.5 and αL
= 1.67 for S = 3, respectively.
, where S = 1, 2 and 3 are the Euclidean dimensions. It can be seen that the indices are αT
= αE
= αL
= 1 for S = 1, αE
= 1.29 and αT
= αL
= 1.5 for S = 2, αT
= 2, αE
= 1.5 and αL
= 1.67 for S = 3, respectively.
Because the number of X-ray flares provided by Sidoli et al. (2019) for the three sources is limited, we simply take the three sources as the candidates and compare the fitting results with the theoretical indices. Basing on statistical analysis, the energy distribution power-law slopes are 1.47 ± 0.25 and 1.55 ± 0.24, which are well consistent with the theoretical index 1.5 for S = 3. The peak luminosity distribution power-law slopes are 1.59 ± 0.15 and 1.78 ± 0.22 for IGR J16418-4532, corresponding to αL = 1.67 for S = 3. The duration distributions are with the indices 1.94 ± 0.07 and 1.95 ± 0.07 for IGR J16418-4532, and also well correspond to the theoretical duration index αT = 2 for S = 3. The duration distributions for IGR J16328-4726 and IGR J18450-0435 are consistent with the theoretical slope αT = 2 for S = 3, and the energy distribution power-law slopes of the two sources also correspond to αE = 1.5 for S = 3 case. But it is not easy to determine which dimension for the peak luminosity distributions of two cases, because the theoretical indices are αp = 1.5 for S = 2 and αp = 1.67 for S = 3. Both of the two Euclidean space dimensions are appeared in IGR J16328-4726 and IGR J18450-0435 for the peak luminosity distributions. However, due to the small number of X-ray flares, it is difficult for us to further test the standard self-organized criticality models with X-ray flares from the supergiant fast X-ray transients. Therefore, much more X-ray flares are required for the further research. However, based on the present results, it is found that the derived power law slopes are consistent with the prediction of the the three-dimensional space (S = 3) for the selected events.
To obtain the power-law like distribution values for different astrophysical sources is our main motivation in this work. It should be mentioned that, although the power-law like distributions are the marks of the self-organized criticality systems, it does not mean that they have the same power-law values for one astrophysical source. For example, according to Sidoli & Paizis (2018), for the case of IGR J16418-4532, a power law slope of 2.28 ± 0.40 is obtained for the luminosity distribution with the public INTEGRAL observations, which is much steeper than our values and previous results of Paizis & Sidoli (2014) for the same source. This steeper slope of IGR J16418-4532 in Sidoli & Paizis (2018) has been studied by the most recent flares, which are not included in Paizis & Sidoli (2014) and Sidoli et al. (2019). Therefore, different X-ray flares should have distinctive cumulative power-law distribution values. Additionally, the different satellites have different operating modes and wavelengths. Furthermore, different bin sizes for the parameters of X-ray flares could also generate an exponential cut-off at the upper end of the size distribution on account of finite system-size effects, and thus the variation of the power-law distributions can also be occurred. Besides, the X-ray data used in our paper are all extracted and processed by Sidoli et al. (2019) through Bayesian blocks analysis, this is a segmentation technique, widely applied to astronomical time-series. However, the typical parameters of X-ray flare may vary when different extraction methods are adopted, and the statistical results for X-ray flares may also be different (the power law indexes) rather than the form. The most important insight should be related to the relationships among the power-law distribution slopes of different self-organized criticality parameters of X-ray flares, which is dependent on the nonlinear scaling laws among the self-organized criticality parameters.
4. Conclusions
X-ray flares from X-ray binary systems are the common astronomical phenomena. According to Sidoli et al. (2019), who provided the behavior of some essential flares extracted from EXTraS database, and a total of 144 X-ray flares from nine supergiant fast X-ray transients have been obtained. In this paper, we are focused on studying the statistical properties of X-ray flares from the supergiant fast X-ray transients obtained in Sidoli et al. (2019), including rise time, decay time, duration time, waiting time, peak luminosity, isotropic energy and the mean luminosity of X-ray flares for IGR J16418-4532, IGR J16328-4726 and IGR J18450-0435, respectively. We find that the cumulative distributions of those X-ray flare parameters show the similar power-law forms. These similar distributions can be well explained by the self-organized criticality model. Although supergiant fast X-ray transients are generally believed to have different physical mechanisms when compared with GRBs, the similar distribution still indicates that they likely reflect certain self-organized criticality behaviors in their different generation processes. Therefore, by applying the cumulative distribution method to the flare in the supergiant fast X-ray transients, we suggest that these features are connected with the accretion mechanism for the magnetized neutron stars, and that these special X-ray flares from high mass X-ray binaries can be a typical behavior of self-organized criticality systems.
Acknowledgments
We thank the anonymous referee for constructive and helpful comments. We thank Fa-Yin Wang and Yong Shao for helpful discussion. This work is supported by the National Natural Science Foundation of China (grant No. U2038106), and China Manned Spaced Project (CMS-CSST-2021-A12).