


ABSTRACT
A CO 2–1 line survey is performed toward a sample of 58 high Galactic latitude post-asymptotic-giant-branch (pAGB) stars. To complement the observations, a compilation of literature CO 2–1 line data of known pAGB stars is done. After combining the data sets, CO 2–1 line data are available for 133 pAGB stars (about 34% of known pAGB stars) among which 44 are detections. The CO line strengths are compared with infrared dust emission for these pAGB stars by defining a ratio between the integrated CO 2–1 line flux and IRAS 25 μm flux density (CO-IR ratio). We refer to the relationship between the CO-IR ratio and the IRAS color C23 (defined with the 25 and 60 μm flux densities) as the CO-IR diagram. The pAGB objects are found to be located between AGB stars and planetary nebulae (PNe), and are segregated into three distinctive groups (I, II, and III) on the CO-IR diagram. By analyzing their various properties such as chemical types, spectral types, binarity, circumstellar envelope expansion velocities, and pAGB sub-types on the CO-IR diagram, we argue that the group-I objects are mainly intermediate-mass C-rich pAGB stars in the early pAGB stage (almost all of the considered carbon-rich "21 μm" stars belong to this group), the group-II objects are massive or intermediate mass pAGB stars that already follow the profound trend of PNe, and the group-III objects are mainly low-mass binary pAGB stars with very weak CO 2–1 line emission (almost all of the considered RV Tau variables belong to this group). The CO-IR diagram is proven to be a powerful tool for investigating the co-evolution of circumstellar gas and dust during the short pAGB stage of stellar evolution.
Export citation and abstract BibTeX RIS
1. INTRODUCTION
After the super-wind has ceased, the evolution of the remnant circumstellar envelope (CSE) around a single post-asymptotic-giant-branch (post-AGB, or pAGB) star is dominated first by its expansion, and later by photochemical processes when the central star temperature quickly rises. The expansion of the remnant CSE produces a detached circumstellar shell and the object is usually characterized by a double peaked spectral energy distribution (SED) due to the lack of hot dust (Kwok 1993). CO molecules in the CSE are protected from photodissociation mainly by self-shielding and line shielding by atomic and molecular H2 (see e.g., Mamon et al. 1988).
Few works have been dedicated to the relationship between dust and CO in pAGB stars. Alcolea & Bujarrabal (1991) had noticed that some pAGB stars of RV Tauri type are usually very deficient in CO line emission and they proposed peculiar elemental abundances that prevent the formation of CO molecules as the possible interpretation of the phenomenon. Bujarrabal et al. (1992) observed 12CO and 13CO 1–0, 2–1 lines toward several young pAGB stars. Combined with literature data, their results revealed a correlation between CO 1–0 integrated intensity and IRAS 60 μm (F60) flux density. However, there are some exceptional pAGB stars that show either too strong or too weak CO 1–0 line intensities relative to F60 flux densities. They also noticed the trend that the CO line is stronger in some AGB carbon stars than in investigated pAGB stars. They compared the CO line of the young pAGB stars with other pAGB stars from literature and tentatively concluded that younger pAGB stars might have stronger CO lines. With more observational CO data having been accumulated to date, it is possible to extend such studies in a more systematic way.
Here we present a new observational study of the relationship between dust and CO in the evolving circumstellar envelopes of pAGB objects using the compilation of such objects from the Torun Catalog of pAGB stars (Szczerba et al. 2007, 2012). After describing our observations and data reduction in Section 2, we present the results in Section 3. To augment the data set for analysis, we have also performed as complete as possible a compilation of literature CO 2–1 data for all known pAGB stars in Section 4 (with details presented in Appendix A). Then, the observed relation between the integrated CO 2–1 line fluxes and IR dust emission flux densities is investigated and compared to that of AGB stars and planetary nebulae (PNe) in Section 5. To better understand the observed relationship between CO and dust emission, some other properties of the pAGB stars, such as CSE chemical types, spectral types, binarity, SED types, CSE expansion velocities, and pAGB sub-types, are discussed in Section 6. The main points of this work are summarized in Section 7.
2. SAMPLE SELECTION, NEW OBSERVATIONS, AND DATA REDUCTION
In order to explore the relationship between dust and CO in the pAGB circumstellar envelopes with smaller contamination from the interstellar CO emission, a sample of 58 high Galactic latitude pAGB stars (with |b| ⩾ 15°) that are accessible from the Arizona Radio Observatory 10 m submillimeter telescope (AROSMT; for objects with a declination ⩾ − 38°) were selected from the Torun Catalog of pAGB stars (Szczerba et al. 2007). However, the discussions in this paper will be based on the second version of the catalog (Szczerba et al. 2012).4 We note that, although great efforts have been made in building the catalog, the evolutionary status of some objects (such as RV Tau type and R CrB stars) is still uncertain in the catalog. Almost all of these pAGB objects have optical and/or infrared photometry and/or spectroscopy data, which provides a reliable basis for the analysis in this work.
The ALMA band 6 sideband-separating receiver on the AROSMT telescope was used for our 12CO J = 2–1 line survey from 2007 November to 2008 April. Sky subtraction was made using the beam-switch mode with a 2 arcmin throw at 1 Hz wobbling in the azimuth direction. Two filter banks (FFBs, 1 GHz width, 1024 channels) were used for the two linear polarizations. The beam width was about 32'' in this line. A nominal factor of 44.4 Jy K−1 can be used to derive line peak fluxes.
The GILDAS/CLASS package was used to reduce and analyze the data. The two polarizations were combined to improve the signal-to-noise ratio. An on-plus-off integration time of 20 min per object yielded a typical root mean square (rms) of about 15 mK at a spectral resolution of 1 MHz in the polarization-averaged spectral baseline. A linear baseline was removed from each spectrum.
3. RESULTS
The CO 2–1 lines were detected toward only 6 sources among the 58 observed in this survey. The baseline rms noise of all observed data and the line parameters for the detected sources are given in Tables 1 and 2, respectively. A main beam efficiency of 0.75 is used to convert the antenna temperature  into main beam temperature Tmb. Also given in Table 2 are the integrated line flux, Fint, and its ratio to the IRAS 25 μm flux density

Only good quality IRAS flux densities (with Q = 2 or 3) are used in this work. The IRAS 25 μm flux density is considered because it is the representative wavelength of the cool dust emission from the circumstellar envelopes of all evolved stars considered here: AGB stars, pAGB stars, and PNe. In addition, 25 μm flux densities have smaller interstellar contamination than 60 μm flux densities for low galactic latitude objects which will be compiled from the literature in the next section.
Table 1. The 58 Observed High Galactic Latitude Post-AGB Stars
| Namea | R.A. (2000) | Decl. (2000) | rms (Tmb) | Namea | R.A. (2000) | Decl. (2000) | rms (Tmb) |
|---|---|---|---|---|---|---|---|
| (hh:mm:ss.sss) | (dd:mm:ss.sss) | (mK) | (hh:mm:ss.sss) | (dd:mm:ss.sss) | (mK) | ||
| 01005+7910 | 01:04:45.514 | 79:26:46.312 | 12 | NGC 6254 | 16:57:11.743 | −04:03:59.670 | 9 |
| LX And | 02:19:44.091 | 40:27:22.208 | 22 | F17015+0503 | 17:04:00.085 | 04:59:00.816 | 8 |
| 05208−2035 | 05:22:59.424 | −20:32:53.116 | 11 | PG 1704+222 | 17:06:46.171 | 22:05:52.090 | 9 |
| RV Col | 05:35:44.206 | −30:49:35.490 | 13 | UZ Oph | 17:21:59.260 | 06:54:42.217 | 10 |
| 06338+5333 | 06:37:52.422 | 53:31:02.017 | 9 | V453 Oph | 17:26:49.115 | −02:23:36.146 | 12 |
| 07430+1115 | 07:45:51.390 | 11:08:19.626 | 8 | 17436+5003 | 17:44:55.470 | 50:02:39.465 | 14 |
| 09371+1212 | 09:39:53.963 | 11:58:52.604 | 13 | F17495+0757 | 17:52:01.248 | 07:56:29.194 | 10 |
| 10158−2844 | 10:18:07.590 | −28:59:30.840 | 22 | 17534+2603 | 17:55:25.182 | 26:02:59.964 | 16 |
| DN Leo | 10:38:55.230 | 10:03:48.500 | 18 | 18062+2410 | 18:08:20.083 | 24:10:43.323 | 11 |
| 11157+5257 | 11:18:33.583 | 52:40:54.606 | 8 | 18095+2704 | 18:11:30.670 | 27:05:15.547 | 15 |
| 11472−0800 | 11:49:48.040 | −08:17:20.420 | 17 | V443 Lyr | 18:29:31.508 | 33:58:40.897 | 12 |
| BD+13 2491 | 12:07:10.820 | 12:59:07.750 | 15 | V534 Lyr | 18:37:58.775 | 37:26:05.676 | 15 |
| CD−31 9638 | 12:20:44.940 | −32:33:26.190 | 20 | 19132−3336 | 19:16:32.759 | −33:31:20.434 | 30 |
| 12538−2611 | 12:56:30.140 | −26:27:36.950 | 19 | F19179−3336 | 19:21:07.327 | −31:23:50.323 | 22 |
| BPS CS 22877−0023 | 13:25:39.470 | −08:49:19.060 | 18 | 19437−1104 | 19:46:30.528 | −10:56:54.934 | 13 |
| 13467−0141 | 13:49:17.120 | −01:55:44.820 | 16 | 19500−1709 | 19:52:52.692 | −17:01:50.358 | 22 |
| F15160+0215 | 15:18:36.150 | 02:04:16.280 | 18 | 19590−1249 | 20:01:49.831 | −12:41:17.779 | 14 |
| F15240+1452 | 15:26:20.820 | 14:41:36.340 | 16 | 20023−1144 | 20:05:05.413 | −11:35:57.915 | 13 |
| BT Lib | 15:31:15.890 | −23:21:36.220 | 20 | RX Cap | 20:14:55.215 | −12:56:34.702 | 25 |
| 15465+2818 | 15:48:34.407 | 28:09:24.264 | 13 | V590 Aql | 20:17:08.554 | −04:03:06.991 | 22 |
| BD+33 2642 | 15:51:59.882 | 32:56:54.373 | 15 | FQ Aqr | 20:51:21.341 | 02:18:46.360 | 18 |
| BD+26 2763 | 15:58:58.275 | 26:08:04.646 | 15 | 20547+0247 | 20:57:16.284 | 02:58:44.554 | 30 |
| LSE 29 | 16:09:24.560 | −27:13:38.160 | 22 | PHL 1580 | 21:30:25.244 | −19:22:34.374 | 32 |
| V2205 OPH | 16:28:35.373 | −09:19:31.814 | 20 | NGC 7089 | 21:33:32.413 | 00:49:05.793 | 11 |
| F16277−0724 | 16:30:30.020 | −07:30:52.050 | 18 | PHL 174 | 21:50:48.657 | −19:42:00.270 | 20 |
| NGC 6205 | 16:41:33.680 | 36:26:07.706 | 14 | 22006−1652 | 22:03:19.699 | −16:37:35.245 | 34 |
| V652 Her | 16:48:04.693 | 13:15:42.282 | 16 | 22327−1731 | 22:35:27.528 | −17:15:26.956 | 32 |
| TT Oph | 16:49:35.888 | 03:37:54.242 | 9 | BD+39 4926 | 22:46:11.231 | 40:06:26.294 | 15 |
| LS IV −04 1 | 16:56:27.731 | −04:47:23.708 | 10 | DS Aqr | 22:53:17.037 | −18:35:30.984 | 32 |
Notes. Positions and baseline rms noise level of the observed CO 2–1 spectra. aIRAS or FIRAS prefix has been omitted.
Download table as: ASCIITypeset image
Table 2. CO Line Parameters of the Six Detected High Galactic Latitude Post-AGB Stars
| IRAS | Other | l | b | Sp.Type | Tmb a | Vexpa | Iinta | Finta | VLSR | RCO25b |
|---|---|---|---|---|---|---|---|---|---|---|
| Name | (deg) | (deg) | (mK) | (km s−1) | (K km s−1) | (Jy MHz) | (km s−1) | (MHz) | ||
| 07430+1115 | 208.9312 | +17.0670 | G5Ia | 74 (8) | 6.5 (0.6) | 1.03 (0.05) | 35.0 (1.7) | 15.7 | 1.17 (0.24) | |
| 09371+1212 | Frosty Leo | 221.8895 | +42.7269 | K7II | 166 (13) | 22.8 (0.8) | 8.04 (0.14) | 273.7 (4.8) | −15.6 | 59.62 (11.97) |
| 17436+5003 | V814 Her | 077.1331 | +30.8696 | F3Ib | 256 (14) | 8.6 (0.4) | 4.71 (0.10) | 160.3 (3.4) | −35.3 | 0.87 (0.18) |
| 17534+2603 | 89 Her | 051.4341 | +23.1876 | F2Ibe | 233 (16) | 3.5 (0.3) | 1.75 (0.07) | 59.6 (2.4) | −8.4 | 1.09 (0.22) |
| 19437−1104 | DY Aql | 029.1826 | −17.1308 | G5 | 122 (13) | 0.7 (1.3) | 0.17 (0.03) | 3.6 | ||
| 19500−1709 | V5112 Sgr | 023.9837 | −21.0361 | F2/F3Iab | 259 (22) | 10.4 (1.2) | 5.77 (0.24) | 196.4 (8.2) | 24.4 | 1.19 (0.24) |
Notes. aThe values in the parentheses are 1 σ noise level. bRCO25 is defined by Equation (1) in Section 3.
Download table as: ASCIITypeset image
Among the six detected sources, there is only one new detection of the CO 2–1 line in IRAS 07430+1115 (only its CO 1–0 line was detected previously). The CO 2–1 line was observed but not detected toward this object by Hrivnak & Bieging (2005), which was perhaps due to the authors' use of the wrong source position (the position they observed was away from the IRAS position by about 30'', comparable to the beam size). The very narrow CO 2–1 line toward IRAS 19437−1104 is also new, but it is possibly a contamination from a high Galactic latitude molecular cloud, because: (1) so narrow a CO line (Vexp = 0.7 km s−1) is very rare among pAGB stars, and (2) the LSR velocity of the narrow CO line (at VLSR = 3.58 km s−1) is the same as an interstellar cloud toward the same direction as measured by Dame et al. (2001). Therefore, this object will not enter our discussions hereafter.
The resulting CO line profiles of the six detected sources are shown in Figure 1. Here we give notes for some interesting spectral line features in these profiles.
- 1.A common feature of these CO 2–1 lines is the presence of high-velocity line wings. Four of the five detected circumstellar CO lines show evidence of such line wings (with the only exception being IRAS 07430+1115; see Figure 1). The Gaussian line wings are usually produced by fast (bipolar) winds from the central pAGB star.
- 2.The CO 2–1 line of IRAS 19500−1709 is a composite profile with a strong narrow feature superimposed at the center of a broader flat pedestal. Similar composite line profiles had been found in some other AGB or pAGB stars, such as RS Cnc (Gérard & Le Bertre 2003; Libert et al. 2010), EP Aquarii (Winters et al. 2007), and more such sources in Knapp et al. (1998) and Winters et al. (2003). The interpretation of such a profile is still controversial, however.
- 3.The sharp peak CO line profile of IRAS 17534+2603 had been nicely interpreted by Bujarrabal et al. (2007) on the basis of their CO line interferometry data with a bipolar hourglass-shaped outflow model.
- 4.A small narrow emission-like feature can be recognized around VLSR = 5 km s−1 on the top of the broad line profile of Frosty Leo. A plateau was seen near the same velocity in a better quality line profile obtained with IRAM (with a smaller beam) by Bujarrabal et al. (2001). The change in profile shape of this feature with different beam sizes indicates that it should originate from the circumstellar envelope instead of from interstellar clouds.
- 5.Absorption-like features are present in the CO 2–1 line profile of two objects. An absorption-like feature is seen in the blue line wing of IRAS 19500−1709 at VLSR = 14.4 km s−1, or at a Doppler shift of ≈ − 10 km s−1 with respect to the systemic velocity of 24.4 km s−1. The same object was observed with IRAM 30 m by Bujarrabal et al. (2001) and clearer absorption-like features had been seen around similar velocities on top of broad line wings in their better profile data. As argued by Bujarrabal et al. (1992), it could be the signpost of still deeply embedded small-size fast winds. Similar absorption-like features also appear in the blue line wing of IRAS 17436+5003 at Doppler shifts of −33, −23 and −14 km s−1 with respect to the systemic velocity of −35.3 km s−1 in Figure 1. The bluest of the three absorption features even shows negative strength. Although the three absorption features in this object are weak, their appearance can be nicely confirmed in this object by comparing our data with previous observations of the same line by Bujarrabal et al. (1992) with the IRAM 30 m telescope more than 16 yr ago. These absorption features were also briefly mentioned by Castro-Carrizo et al. (2004) with their more recent observations. Part of these weak but stable absorption features could be similarly interpreted by embedded small-size fast winds, as is the case for IRAS 19500−1709. The absorption with negative flux could also be interpreted similarly given that continuum emission is strong enough in the compact outflow regions. However, it is hard for this scenario to explain all the three absorption features in this line profile with simple CSE structures. Similar absorption line features have been found in the CO line profiles of other well-known AGB or pAGB stars, e.g., CRL 2688 (Kawabe et al. 1987; Cox et al. 2000; Bujarrabal et al. 2001), CRL 618 (Hajian et al. 1996; Sánchez Contreras et al. 2004), and some other sources from Castro-Carrizo et al. (2010).

Figure 1. Observed CO 2–1 line spectra of the detected high Galactic latitude post-AGB sample stars. Overplotted smooth curves are Gaussian fittings. The very narrow line of IRAS 19437−1104 is possibly a contamination from an interstellar cloud (see details in Section 3).
Download figure:
Standard image High-resolution image4. LITERATURE DATA
Because the detection rate of the CO 2–1 line in our high Galactic latitude pAGB star sample turns out to be low, we complement our sample with a compilation of literature CO 2–1 line data for all 393 known pAGB stars (including likely RCrB-eHe-LTP and RV Tau types) from the second version of the Torun Catalog (Szczerba et al. 2012). Here eHe means extreme helium stars, while LTP stands for Late Thermal Pulse objects. The details of the data compilation are given in Appendix A. Only the summary of the literature data is given here.
In total, the compilation up to 2011 October 26 includes 175 literature CO 2–1 line data entries (see Table 5 in Appendix A) of 87 pAGB stars. The repeated observations have been averaged together to yield the most representative CO 2–1 line flux for each of these 87 objects. They are presented in Table 6 in Appendix A, together with IRAS flux densities, IRAS colors, and the ratio between integrated CO 2–1 line flux and IRAS 25 μm flux density.
After combining this with our high Galactic latitude sample and removing duplicated objects, the total number of observed pAGB stars is 133, among which 44 objects were detected in CO 2–1 line. Thus, about 34% of the known pAGB stars have been observed in the CO 2–1 line, and the detection rate is also about 34%.
According to the analysis of the statistical properties of the observed sample (see Appendix B), it is found that the available CO 2–1 observations have the following bias effects: (1) pAGB stars in the Galactic Center direction are under-represented and (2) the available CO 2–1 line observations are biased to strong IR emitters and the detectability of CO 2–1 line is sensitivity limited.
In addition, 1117 CO 2–1 line data entries are collected for 751 other objects (AGB stars and PNe) from the following papers for the purpose of comparison with pAGB stars: the compilation of Loup et al. (1993); some S stars from Jorissen & Knapp (1998); Ramstedt et al. (2009); some PNe from Huggins et al. (2005, 1996); and some O-rich semiregular and irregular variables from Kerschbaum & Olofsson (1999). Among them are 569 AGB stars (28 OH/IR stars plus another 155 O-rich AGB stars, 56 S stars, and 330 C-rich AGB stars) and 182 PNe. Repeated CO observations for these objects are also averaged together, as was done for pAGB objects. We do not present the detailed data in this paper, however, since they are not complete compilations for any of these types of objects.
The IRAS point source flux densities of these objects are also extracted from the IRAS Point Source Catalog and in a few cases from the IRAS Faint Source Catalog. Only those good quality IRAS data (with a quality factor of Q > 1) are used in this work.
5. DATA ANALYSIS
5.1. CO-IR Relation of High and Low Galactic Latitude Post-AGB Stars
Although the relation between CO line strength and infrared dust emission strength has been studied before (e.g., Bujarrabal et al. 1992), there is still a lack of in-depth investigation. In this work, we do not try to compare the dust and gas mass loss rates. Instead, we directly compare the observed CO line fluxes with IRAS flux densities (RCO25 ratio—see Equation (1)). The greatest advantage of the direct comparison is that it allows us to exclude the uncertainties introduced by distances and empirical formulas for mass loss rate. The traditional IRAS color–color (C–C) diagram of the two colors,
is also used. Here, F12, F25, and F60 are the IRAS flux densities. The C23 color is a better tracer of the cool dust emission around pAGB stars than C12. Thus, we will concentrate on RCO25-C23 relationships of our sample stars.
Our new observational results of the high Galactic latitude (h.g.l.) pAGB stars are combined with literature data. The h.g.l. objects (we adopt |b| > 15°) should be mainly local stars or low mass halo stars statistically less massive than the low Galactic latitude (l.g.l.) counterparts. Thus, we plot their RCO25-C23 and IRAS C–C diagrams separately in Figure 2. Compared with our new observations, there are no CO 2–1 line detections in the literature toward other h.g.l. objects. However, the average literature CO line fluxes show clear discrepancies with our new measurements for Frosty Leo and 89 Her (see the two symbols linked to the same object names in the figure). The lower literature CO line flux of 89 Her could be due to the fact that it has been partially resolved by the small beam of the IRAM telescope which was used to obtain two of the three available literature CO data sets. For Frosty Leo, the literature data was obtained by a 12 m telescope (as in this work) more than 18 yr ago. The reason for the discrepancy is unclear. The 1σ upper limits of non-detection sources are estimated by assuming a typical CSE expansion velocity of 10 km s−1 (≈7.7 MHz). The RCO25-C23 diagram will be called the CO-IR diagram hereafter.

Figure 2. Integrated CO 2–1 line flux to IRAS 25 μm flux density ratios (RCO25—see Equation (1) in Section 3) are plotted against IRAS color C23 (the so-called CO-IR diagram defined in Section 5.1) for the observed high and low Galactic latitude pAGB stars in the left top and bottom panels, respectively. Also shown in the right panels are the traditional IRAS color–color diagrams for the same groups of pAGB objects. The error bars are the 20% nominal uncertainty of the CO line fluxes. The horizontal solid line and slant dashed line on the CO-IR diagrams represent the major trends of the pAGB star distribution. The short dashed line on the IRAS C–C diagrams is the blackbody (BB) line with integer numbers being the BB temperatures. The regions in the IRAS C–C are those defined by van der Veen et al. (1989) for evolved stars.
Download figure:
Standard image High-resolution imageShown in the upper panels of Figure 2 are h.g.l. pAGB stars. Both the literature data (gray circles) and our new observations (black dots for the detected objects) are shown, as indicated by double arrows in the figure. In the upper left panel, almost all the detected pAGB stars, excluding only the exceptional case of Frosty Leo, show very similar CO-IR flux ratios of

as delineated by the horizontal line in the figure. This relation is valid in the color range of −1.6 < C23 < 0.0 for the pAGB stars considered. The slant dashed line will be explained below.
On the IRAS C–C diagram in the upper right panel, Frosty Leo is not shown because of the poor quality of its IRAS 12 μm flux density data. The remaining four objects are distributed along an elongated region below the black body line. Particularly, the C12 colors vary more than the C23 colors. This trend of increasing colors could be the result of fast weakening of the 12 μm flux density when the inner CSE of the pAGB stars is gradually evacuated. Thus, the increasing IR color sequence of the detected h.g.l. pAGB stars could be an evolutionary sequence. Two special objects are commented on in the footnote.5 6
6
In the two lower panels of Figure 2, the l.g.l. pAGB stars are shown. The CO-IR diagram in the lower left panel shows that many stars with CO detection (gray circles) are crowded around a similar region as the high latitude stars (with RCO25 ≈ 1.04 and C23 < 0.0), while the rest objects seem to be located in an elongated region, extending from blue C23 color and small RCO25 ratio to red C23 color and large RCO25 ratio. The object names are marked out in the figure for the latter group of stars. We find that a slanted straight line (the dashed line) of

can represent this trend reasonably well. This log-linear trend holds in the color range of −1.2 < C23 < 1. Equation (3) is not a fit to the data, but a simple function recognized by eye. The lower right corner of this CO-IR diagram is devoid of objects, hinting that this log-linear trend could represent a border of pAGB star distribution on the CO-IR diagram.
The l.g.l. pAGB objects, which are distributed along the slanted line and have C23 < 0 are located on or below the BB line on the IRAS C–C diagram. On the other hand, the rest objects that have C23 > 0 (with the exception of IRAS 19475+3119) are located above the BB line (see the lower panels of Figure 2). In addition, it is seen that the l.g.l. pAGB stars, which appear in a similar region as the h.g.l. ones on the CO-IR diagram (compare the two left panels) also occupy a similar region on the IRAS C–C diagrams (compare the two right panels). This indicates that these h.g.l. and l.g.l. objects share a similar combination of dust and CO gas characteristics.
5.2. CO-IR Diagrams in the Context of AGB-pAGB-PN Sequence
Although some regularity has begun to emerge on the previously discussed RCO25-C23 diagrams of the pAGB stars, the discussed trends are still murky due to the limited number of objects involved. In this section, we try to verify these trends in a broader context of the AGB-pAGB-PN evolutionary sequence. The CO 2–1 line data collected from literature for some AGB stars and PNe make this comparison possible. Thus, the CO-IR diagrams of these AGB stars and PNe are plotted and compared with the pAGB stars (represented by the two straight lines that delineate the major trends) in Figure 3. The traditional IRAS C–C diagrams are also shown for them. For clarity, the C-rich and O-rich AGB stars are plotted in separate panels.
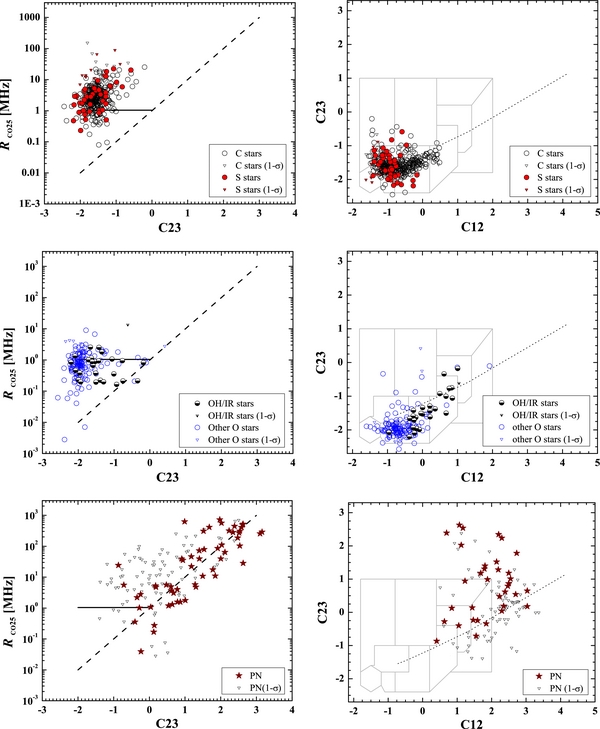
Figure 3. Same as Figure 2 but for C- and O-rich AGB stars and PNe. The trends of pAGB stars distribution are represented by the two lines on the CO-IR diagrams.
Download figure:
Standard image High-resolution image5.2.1. AGB Stars and PNe on the CO-IR Diagrams
We briefly discuss the distribution of AGB stars and PNe on the CO-IR and IRAS C–C diagrams, while more comparison among these objects is presented in Appendix C.
In the top left panel of Figure 3, C-rich AGB stars (empty circles) mainly concentrate in a compact region on the RCO25-C23 diagram, and S stars (gray filled circles) mainly scatter in a similar region as the C stars. On the IRAS C–C diagram (the top right panel), most of these stars are distributed slightly below the black body line (the dotted line) or in regions with red C23 but blue C12 colors. Their mean IR color is C23 = −1.54 ± 0.35 and their mean CO-IR flux ratio is log (RCO25) = 0.41 ± 0.40.
In the middle left panel of Figure 3, many O-rich AGB stars (empty circles) concentrate in another compact region different from that of C stars on the CO-IR diagram, while an extreme subsample of them—OH/IR stars (half-shaded black circles)—scatter in regions with similar or smaller RCO25 ratios but usually redder C23 colors than the other O-rich AGB stars. Their mean IR color is C23 = −1.70 ± 0.76 and their mean CO-IR flux ratio is log (RCO25) = −0.13 ± 0.58, which means that they are slightly bluer and have 3.5 times smaller mean RCO25 ratios than C-rich AGB stars on average. On the IRAS C–C diagram in the middle right panel of the figure, most of these O-rich AGB stars concentrate in a region below the black body line, while the OH/IR stars stretch out to much redder regions, as expected.
In the bottom left panel of Figure 3, PNe show a pronounced increasing log-linear trend on the CO-IR diagram. The trend spans more than 4 orders of magnitude of the RCO25 ratio and are in close agreement to the log-linear trend of pAGB stars (the dashed line). On the IRAS C–C diagram in the bottom right panel, most of the PNe appear in a very red region above the black body line, as expected for cold dusty CSEs.
5.2.2. The pAGB Trends on the CO-IR Diagram in the Context of AGB-pAGB-PN Evolution
By comparing the pAGB stars (represented by the two straight lines) with AGB stars and PNe in Figure 3, it is now clear that the pAGB stars are distributed in a transitional region between the AGB stars and PNe on the CO-IR diagram. The subgroup of pAGB stars represented by the horizontal solid line in the figure have similar CO-IR ratios (with a mean log (RCO25) = 0.02 ± 0.03) as AGB stars, but have redder IR colors (with C23 = −1.6 ∼ 0.0). The log-linear trend followed by the rest of the group of pAGB stars on the CO-IR diagram agrees quite well with the trend of PNe. Thus those pAGB stars with very red C23 colors (>0) could be the precursor of the shown PNe. The other end of the log-linear trend (with C23 < 0) is populated by some pAGB stars that have exceptionally small RCO25 (very weak CO line emission).
The distinctive characteristics of these pAGB stars allow us to divide them into three subgroups, which, as we show later, have different properties.
5.3. Grouping of post-AGB Stars
Our sample of pAGB stars aggregate in different regions on the CO-IR diagram, which is not so well seen on the traditional IRAS C–C diagram. As we will see below, the aggregation on the CO-IR diagram just reflects the different nature (e.g., mass, binarity, chemistry, etc.), and the stage of pAGB evolution of these stars through the contrast of dust and CO line emission. Here, we merge the h.g.l. and l.g.l. pAGB stars and divide them into three CO-IR groups, as shown in the upper panel of Figure 4. Only significant, from the point of view of performed source classification, CO non-detections are plotted in Figure 4.

Figure 4. Grouping of all pAGB stars on the CO-IR diagram and the resulting groups on the IRAS C–C diagram. The lines and regions are the same as in Figure 2. Object names are labeled for our five high Galactic latitude pAGB stars and the CO-detected pAGB stars that belong to groups-II and III.
Download figure:
Standard image High-resolution imageGroup-I—those pAGB stars with RCO25 > 1/3 and C23 < 0 (the red filled circles, or gray filled squares in Figure 4). They compose the largest group of pAGB stars, which is distributed in a horizontally elongated region on the CO-IR diagram, with a similar RCO25 ratio of ∼1 MHz (actually in the range of 0.42–5.2 MHz, with a median of ∼1 MHz). Their distribution can be roughly represented by the horizontal line that was determined for our h.g.l. pAGB stars in Section 5.1.
Group-II—those pAGB stars with C23 > 0 (the green filled circles and one gray filled square in Figure 4). They are the reddest group with usually enhanced CO 2–1 emission relative to their IR dust emission. They occupy the red part of the log-linear trend as delineated by the dashed line in the figure.
Group-III—those pAGB stars with RCO25 < 1/3 and C23 < 0 (the blue filled circles in Figure 4). They have exceptionally weak CO 2–1 line emission, although their C23 colors are similar to that of group-I stars. They occupy the blue part of the log-linear trend (the dashed line) and the region immediately above it. This group also includes some CO 2–1 non-detections whose 1σ upper limit of RCO25 ratios are smaller than 1/3 and thus they are also CO deficient pAGB stars. We did not plot the other non-detections, since they could be members of different groups.
All of the three CO-IR groups of pAGB stars are listed in Table 3, with different groups in separate sub-sections of the table. The vicinity of intersection between the solid and dashed lines in the top panel of Figure 4 do not allow us to be sure to which group a given object belongs. Therefore, the classification of the objects near the group borders (here we have assumed somewhat arbitrarily a rectangular border region as RCO25 > 1/3 and −0.5 < C23 < 0) is tentative, and we labeled them with a leading "*" symbol before their object names in Table 3. The table is organized in a way to enable easy comparison between the CO-IR and IRAS C–C diagrams in Figure 4. Objects in groups-I and II are sorted with increasing C23 colors, while those of group-III are ordered in decreasing C23 colors. Also listed in the table are some properties of the pAGB stars that will be explained and discussed later in Section 6.
Table 3. Properties of the Three CO-IR Groups of Post-AGB Stars
| Object | C23 | RCO25 | Vexp | SEDa | Binaritya | Chem.type | Spectralb | pAGBa | Chem.refc |
|---|---|---|---|---|---|---|---|---|---|
| Name | (km s−1) | */CSE | Type | Class | */CSE | ||||
| Group I | |||||||||
| 89 Her | −1.52 | 1.09b | 3.5b | 0 | B | O/O | F2Ibe | UU Her | 24/10 |
| AI Sco | −1.47 | 0.89 | 2.8 | 0 | B | C?/O | G4 | RV Tau | 9/8 |
| 22272+5435 | −1.24 | 1.62 | 10.1 | IVa | C/C | G5Ia | 21 μm | 1 | |
| 04296+3429 | −1.18 | 0.83 | 12.8 | IVa | C/C | F3I(s1) | 21 μm | 1 | |
| 07430+1115 | −1.12 | 1.17b | 6.5b | IVa | C/C | G5Ia | 21 μm | 1 | |
| 20000+3239 | −0.94 | 0.75 | 12.2 | IVa | C/C | G8Ia | 21 μm | 1 | |
| 07134+1005 | −0.92 | 1.97 | 9.9 | IVb | C/C | F7Ie(s2) | 21 μm | 1 | |
| 16594−4656 | −0.89 | 2.10 | 14.0 | III | C/C | Ae(s2) | 21 μm | 1 | |
| 19500−1709 | −0.88 | 1.19b | 10.4b | IVb | C/C | F0Ie(s2) | 21 μm | 1 | |
| 23304+6147 | −0.87 | 2.04 | 12.1 | IVa | C/C | F6I(s3) | 21 μm | 1 | |
| 14488−5405 | −0.80 | 0.62 | 15.0 | IVb | ?/? | A0Ie(s2) | possible | −/− | |
| 06530−0213 | −0.65 | 3.99 | 11.3 | IVa | C/C | G1I(s2) | 21 μm | 1 | |
| 17441−2411 | −0.63 | 0.73 | 12.5 | III | ?/? | F4I(s2) | IRASsel | −/− | |
| 08005−2356 | −0.60 | 5.20 | 100.0 | I | C/O | F5Ie(s2) | IRASsel | 2/15 | |
| 23541+7031 | −0.55 | 1.55 | 54.0 | II | ?/O | Be | hotpAGB | −/29 | |
| 22223+4327 | −0.55 | 1.87 | 14.0 | IVb | C/C | F7I(s2) | 21 μm | 1 | |
| 19454+2920 | −0.54 | 1.02 | 15.6 | III | ?/C | IRASsel | −/11 | ||
| * 19480+2504 | −0.49 | 1.31 | 17.5 | III | C/C | IRASsel | 7/19 | ||
| * 20028+3910 | −0.42 | 0.42 | 14.5 | III | ?/O | F3-7I(s1) | IRASsel | −/10 | |
| * 22574+6609 | −0.39 | 2.18 | 19.8 | II | C/C | 21 μm | 1 | ||
| * 09032−3953 | −0.34 | 1.02 | 25.0 | II | ?/? | IRASsel | −/− | ||
| * 23321+6545 | −0.32 | 2.56 | 16.1 | III | ?/C | IRASsel | −/11 | ||
| * 19114+0002 | −0.25 | 1.29 | 31.5 | IVa | O/O | F7I(s2) | IRexc | 24/15 | |
| * 17106−3046 | −0.21 | 0.57 | 1.0 | III | ?/O | F5I(s2) | IRASsel | −/28 | |
| * V814 Her | −0.21 | 0.87b | 8.6b | IVb | O/O | A7I(s2) | UU Her | 24/15 | |
| * 17150−3224 | −0.20 | 0.85 | 14.8 | III | ?/O | F3-7I(s1) | OHmaser | −/12 | |
| * 18276−1431 | −0.10 | 0.82 | 12.2 | IVa | ?/O | K2/K3:II/III: | OHmaser | −/30 | |
| * CRL 618 | −0.07 | 1.22 | 16.7 | II | C/C | B0 | refneb | 4 | |
| Group II | |||||||||
| 11385−5517 | 0.36 | 5.74 | 45.0 | 0 | B | C/O | F0Iape | IRexc | 24/31 |
| Water Fountain | 0.41 | 0.37 | 46.0 | II | ?/O | Water fountain | −/14 | ||
| 19475+3119 | 0.42 | 2.45 | 15.1 | IVb | O/O | F3Ib | IRASsel | 24/32 | |
| M 1−92 | 0.74 | 5.34 | 32.5 | III | B | ?/O | B0.5IV;F2 | refneb | −/26 |
| 10178−5958 | 0.75 | 2.61 | 13.0 | III | ?/C | BIe(s2) | hotpAGB | −/20 | |
| 17423−1755 | 0.88 | 3.17 | 26.5 | II/III | B | ?/O | Be | IRASsel | −/17 |
| OH 231.8+4.2 | 0.96 | 9.94 | 21.4 | II/III | O/O | M6 | possible | 16/18 | |
| Boomerang Neb | 0.99 | 33.60 | 25.5 | II | ?/? | refneb | −/− | ||
| Frosty Leo | 2.97 | 59.62b | 22.8b | IVb | B | ?/O | K7II | hglsg | −/32 |
| Group III | |||||||||
| 17245−3951 | −0.17 | 0.25 | 15.0 | III | ?/O | F6I(s2) | OHmaser | −/27 | |
| 19374+2359 | −0.35 | <0.15 | II | ?/O | B3-6I | IRASsel | −/13 | ||
| 19306+1407 | −0.66 | <0.16 | IVa | ?/C,O | B0-1I(s1) | IRASsel | −/10 | ||
| Roberts 22 | −0.67 | 0.16 | 31.0 | II | ?/C,O | A0Ie(s2) | OHmaser | −/10 | |
| 19477+2401 | −0.77 | <0.13 | II | C/C | G0I(s1) | 21 μm | 1 | ||
| 01005+7910 | −0.95 | <0.25 | IVb | ?/C | B2Iab:e | hglBsg | −/5 | ||
| 19386+0155 | −1.02 | <0.16 | I | O/O | F5I(s2) | IRASsel | 22 | ||
| Red Rectangle | −1.05 | 0.09 | 4.9 | II | B | C/C,O | B8V | refneb | 2/3,21 |
| RV Tau | −1.11 | <0.20 | 0 | B | C/? | K3pvar | RV Tau | 24/− | |
| V390 Vel | −1.13 | 0.25 | 5.6 | I | B | O/? | F3e | RV Tau | 24/− |
| AC Her | −1.21 | 0.05 | 1.5 | 0 | B | O/O | F4Ibpvar | RV Tau | 24/10 |
| U Mon | −1.30 | <0.09 | 0 | B | O/? | K0Ibpvar | RV Tau | 24/− | |
| DY Ori | −1.38 | <0.24 | 0 | B | O/O | RV Tau | 24/8 | ||
| AR Pup | −1.39 | <0.25 | III | B | O/? | F0Iab:... | RV Tau | 24/− | |
| AI CMi | −1.41 | <0.10 | I | O/O | K3/5I(s2) | RV Tau | 23/19 | ||
| V887 Her | −1.64 | <0.03 | IVa | O/O | F3Ib | OHmaser | 25/6 | ||
| V886 Her | −2.07 | <0.26 | IVb | O/O | B3e(s2) | IRASsel | 24/5 | ||
| 20004+2955 | −2.25 | <0.16 | 0 | ?/O | G7Ia | IRexc | −/33 | ||
Notes. * These objects appear near the joint region between the three CO-IR groups and thus their group identities are tentative. (Objects are sorted by C23 color within each group.) aSED types, binarity and the sub-types of post-AGB stars are taken from the Torun Catalog. bThese values are preferentially taken from this work, instead of from literature. cThe circumstellar/central star chemical types were originally compiled from the CO data papers and SIMBAD database, but are later refined with dedicated literature study. Here is the list of the dedicated references and relevant comments: (1) Carbon rich star with 21 μm dust feature; (2) Bakker et al. (1997; optical spectrum); (3) Waters et al. (1998; ISO spectrum); (4) Stephenson (1989); (5) Cerrigone et al. (2009; Spitzer: PAH/Silicates); (6) Eder et al. (1988; OH maser); (7) Alksnis et al. (2001); (8) Gielen et al. (2011; Spitzer: Silicate); (9) Giridhar et al. (2005; optical spectrum); (10) Hodge et al. (2004; ISO spectrum); (11) Hony et al. (2002; 30 μm feature); (12) Hu et al. (1993; OH maser); (13) Kwok et al. (1987; CFHT IR photometry); (14) Likkel & Morris (1988; OH & H2O masers); (15) Likkel (1989; OH maser); (16) Spectral type of M6 in SIMBAD; (17) Manteiga et al. (2011; Spitzer: Silicate & H2O ice absorption); (18) Morris & Bowers (1980; OH maser); (19) Omont et al. (1993; IR + HCN/CO); (20) Parthasarathy et al. (2001; ISO: PAH); (21) Peeters et al. (2002; ISO: PAH); (22) Pereira et al. (2004; optical and IR spectra); (23) Rao et al. (2012; optical spectrum); (24) Stasińska et al. (2006; abundance compilation); (25) Şahin et al. (2011; optical spectrum); (26) Seaquist et al. (1991; OH maser); (27) Sevenster (2002; OH maser); (28) Silva et al. (1993; OH maser); (29) Volk & Kwok (1987; IRAS/LRS); (30) te Lintel Hekkert (1991; OH maser); (31) te Lintel Hekkert et al. (1992; OH maser); (32) te Lintel Hekkert & Chapman (1996; OH maser); (33) Vandenbussche et al. (2002; ISO spectrum). sThe central star spectral types are mostly obtained from SIMBAD database, while several of them are updated with following literature: (s1) = Sánchez Contreras et al. (2008); (s2) = Suárez et al. (2006); (s3) = Pereira & Miranda (2007).
In the lower panel of Figure 4, the three groups are displayed also on the traditional dust emission diagnostic tool, the IRAS C–C diagram. Group-II pAGB stars are clearly separated from the other stars by their large C23 colors. However, the groups-I and III pAGB stars are well mixed on the IRAS C–C diagram, which demonstrates that the involvement of gas emission (the CO 2–1 line) in the grouping has brought us new information about the pAGB stars.
Group-I pAGB stars distribute in an elongated region on the IRAS C–C diagram, with their C23 colors varying only by a factor of about 1.5, while their C12 colors varying by a larger factor of about 4.0. The larger variation range of the C12 colors may be the natural consequence of fast weakening of the 12 μm dust emission in the expanding detached CSE. Thus, group-I pAGB stars are possibly still in the early pAGB stage when the detached CSE is still actively developing, which is also supported by the fact that their RCO25 ratios are similar to that of AGB stars. Their similar RCO25 ratios hint that the thermal balance in the gas (represented by the CO 2–1 line) and dust (represented by the 25 μm emission) might still be tightly coupled during the early pAGB stage.
The red C23 color and richness of CO 2–1 emission of the group-II stars indicate that they could have massive and cool CSEs. By contrast, the weakness of CO 2–1 emission and the blue C23 colors of the group-III stars suggest that they could be lower-mass pAGB stars with a more transparent spherical component in their CSEs where CO molecules have been partially or totally destroyed by penetrating UV photons. The well known low-mass binary disk system Red Rectangle (Men'shchikov et al. 2002; Witt et al. 2009) which shows a narrow CO line (Jura et al. 1995; Dayal & Bieging 1996) is such a member of group-III. However, it is not clear why the groups II and III share the same log-linear relationship on the CO-IR diagram.
6. DISCUSSION
As we showed in Section 5, the AGB, pAGB, and PN CO-emitters are segregated into different regions on the CO-IR diagram, which sets up a new platform for discussing the various aspects of the pAGB stars evolution. In this section, we consider chemical and central star spectral types, SED types, binarity, CSE expansion velocities of the pAGB stars, and their pAGB sub-types to investigate evolution and diversity of these objects using CO-IR diagram.
To facilitate the discussion, we collect the important properties of the three groups of pAGB stars in Table 3. Altogether, excluding 32 non-detections with upper limit of RCO25 > 1/3, we have gathered information for 55 objects. The following columns are in the table: Object name, C23—IRAS color, RCO25—CO to IR flux ratio, Vexp—CSE expansion velocity, SED—spectral energy distribution type, Binarity, Chem.type (*/CSE)—central star and CSE chemical type, Spectral type—central star spectral type, pAGB class, and Chem.ref (*/CSE)—literature for chemical type of the star and CSE. The references for chemical and spectral types are given in footnotes to Table 3. Most of the data are already collected in the Torun Catalog, but not yet for the chemistry of central stars and their circumstellar envelopes. Therefore, we have performed a dedicated literature study to determine chemical types (but also to fine-tune spectral types) of pAGB objects, so credits to the original works or compilations are given below Table 3. Note that the chemistry of CSE is also inferred from dust features seen in Infrared Space Observatory (ISO) spectra (if available in several cases) which can be found in the Torun catalog.
6.1. Chemical and Spectral Types of post-AGB Objects
For discussion in this paper, we assume that the chemical type of a pAGB object is C-rich if it has a C-rich central star and/or C-rich dust in its CSE. Also stars with dual dust chemistry in their CSE (simultaneous presence of C- and O-rich dust features and/or molecules) are treated as having a C-rich chemical type. Knowledge of the chemical type is important since it allows us to roughly estimate mass of the progenitor. Single carbon stars are formed only in a limited progenitor mass range. For solar metallicity this happens for ∼1.5 M☉ < MZAMS < ∼ 5 M☉, and the mass range shrinks and shifts toward somewhat smaller values for lower metallicities (Piovan et al. 2003). For progenitor masses lower and higher than the above mass range a star will remain O-rich. Note, however, that in close binary systems, mass transfer to a companion star may reduce the star's AGB lifetime and the star may remain O-rich even if its progenitor was of intermediate mass.
The distribution of the chemical types from Table 3 is visualized together with central star spectral types on the CO-IR diagram in Figure 5. C-rich and O-rich pAGB stars are plotted in separate rows, while those with late and early spectral types in different columns.
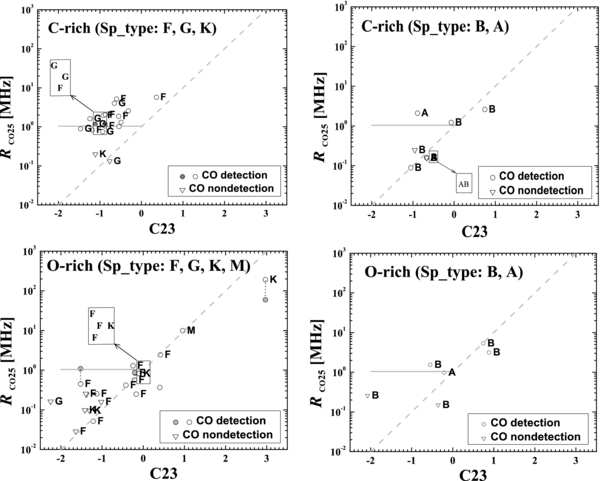
Figure 5. Distribution of chemical types and central star spectral types for pAGB stars on the RCO25-C23 diagram. The C- and O-rich pAGB objects are plotted in upper and lower panels, while central stars of late spectral types (F, G, K, and M) and of early ones (B and A) are plotted in the left and right panels, respectively. The solid and dashed lines are the same as in the left panels of Figure 2. Crowded regions have been enlarged in rectangles. Gray filled circles are new results from this work. They are connected with the corresponding literature CO data by a vertical line if their differences are obvious.
Download figure:
Standard image High-resolution imageIn the left two panels of Figure 5, the C- and O-rich pAGB stars with late spectral types (F, G, K, and M) show distinctive distributions. C-rich pAGB stars of late spectral types are mostly group-I sources, with only few objects, like Red Rectangle, Roberts 22, and IRAS 19477+2401,7 belonging to group-III. On the other hand, O-rich pAGB stars with similar spectral types belong predominantly to group-III8 and to the transition region between different groups. Group-II objects with late spectral types are not numerous, in general, but among them there is only one C-rich star (IRAS 11385−5517) with SiC emission at 11.3 μm seen in its ISO spectrum, but also with OH emission detected from its shell (see Torun catalog and references in Table 3).
Post-AGB stars of earlier spectral types (right panels of Figure 5) are also not numerous in our sample but are located mostly along the log-linear track (dashed line in the figure), with a clear exception being V886 Her (C23 = −2.07), a massive (Ryans et al. 2003) fast-evolving O-rich pAGB star (Arkhipova et al. 1999).
From point of view of the progenitor mass, a feasible interpretation of the discussed trends is that group-I objects, being predominantly C-rich, are intermediate mass pAGB stars; the group-III sources that are CO-deficient objects are the lowest mass pAGB stars; and the group-II sources are intermediate or high mass stars, which already follow the PNe trend on the CO-IR diagram (see bottom left panel in Figure 3). This simplified interpretation is supported by the significantly large percentage of O-rich sources (about 70%; see Table 3) among groups-III and II. On the other hand, the paucity of O-rich pAGB stars in group-I region (see the two bottom panels of Figure 5) seems to suggest that O-rich pAGB stars do not evolve into this region.
From the point of view of single-star evolution, we expect that during the pAGB stage, the C23 color almost continuously increases with time, while F25 flux generally decreases after a short-lasting increase at the transition phase between AGB and pAGB (see, e.g., Szczerba & Marten 1993; Steffen et al. 1998). Such behavior is due to cooling of the circumstellar shell, which is moving away from the central star. However, evolution of the CO 2–1 line flux, another key factor determining the position of a source on the CO-IR diagram, is neither simple nor investigated theoretically to our knowledge. In this respect the CO-IR diagram serves as an observational tool that allows us to put constraints on the CO 2–1 line flux behavior during pAGB phase of stellar evolution.
PNe are well concentrated along the log-linear region (see bottom left panel in Figure 3) to which pAGB stars (with exception of the low-mass ones that could disperse their circumstellar shells before the onset of photoionization) should ultimately evolve. In the frame of single-star evolution, the existence of such a trend can be understood if the CO 2–1 line flux does not change much during the late pAGB (pre-PNe) and PNe phases of evolution, while the F25 μm flux density monotonically decreases. However, in the earlier stages of pAGB evolution, the F25 continuum (see above) and probably also CO 2–1 line fluxes could change non-monotonically, resulting in a relatively complex distribution in Figure 5 (e.g., the lack of O-rich pAGB sources in group-I and the presence of C-rich ones among group-III).
6.2. SED and Binarity
The SEDs of pAGB stars have been classified according to the scheme introduced by van der Veen et al. (1989), with the addition of a type 0 (Szczerba et al. 2012). There are six SED types in total: types 0, I, and II, which show significant near infrared (NIR) excess, and types III, IVa, and IVb showing cold dust emission together with a second peak at shorter wavelengths from central star emission. de Ruyter et al. (2006) proposed that the NIR excess, which is seen in the first three SED types (0, I, and II) is a signature of gravitationally bounded circumbinary disks perhaps formed during strong binary interaction (van Winckel et al. 2009). The other three SED types (III, IVa, and IVb), are signatures of detached shells and/or expanding tori, which are formed due to mass loss on the AGB, or by interaction of an AGB star with its companion (Zijlstra 2007), respectively.
Among our CO-IR group-I sources, three quarters (13 out of 17) have SED types of III, IVa, or IVb, indicating that their dust emission is dominated by a detached shell/expanding torus. On the other hand, two-thirds (12 out of 18) of the CO-IR group-III pAGB stars have SED types of 0, I, or II, showing that they have excess emission from hot dust, a signature of a disk. It is natural to expect that formation of a disk is due to interaction among the stars when the primary star was a giant. It is also interesting to note that most of the pAGB sources (8 out of 11) that are located in the transition region (those marked by "*" in Table 3), are showing emission from cold (detached) CSEs (with SEDs of type III, IVa, and IVb). The situation in the CO-IR group-II is less evident, as about the same fraction of sources show a presence of hot+cold or only cold dust.
Information about binarity is directly obtained from the Torun Catalog of pAGB stars. Although such information is by no means complete in the catalog, some interesting features still can be recognized in the distribution of known binary pAGB stars on the CO-IR diagram, as shown in Figure 6. First, known binaries appear in all three regions of pAGB stars on the CO-IR diagram. However, most of them appear in the CO-deficient region of group-III. In the current sample, about 39% (7 out of 18) group-III pAGB stars are known binaries. Among the six C-rich stars that belong to group-III, two are known binary systems (Red Rectangle and RV Tau). Binaries are also common in the group-II region (about 40%). What is also striking on Figure 6 is dichotomy in C23 color distribution of binaries. One, more numerous group, have blue C23 colors (no cold dust), while the second group have red C23 colors (significant amount of cold dust, with Frosty Leo being the most extreme example).
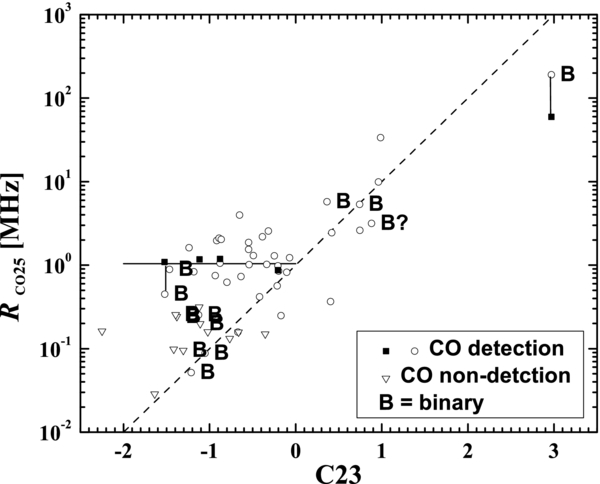
Figure 6. Distribution of binary pAGB stars (marked as "B") on the CO-IR diagram. Only group-III contains some CO non-detections. The solid and dashed lines represent the distribution trends of groups-I, II, and III.
Download figure:
Standard image High-resolution image6.3. CSE Expansion Velocity
The CSE expansion velocity of all the 42 pAGB stars with detection of CO 2–1 lines show a profound trend: Vexp is smallest among group-III pAGB stars, intermediate among group-I stars, and largest among group-II objects. Excluding a few exceptional objects, which will be discussed below, we obtain average velocities from the CO line widths for each group: 12 ± 2 km s−1 for group-I, 28 ± 12 km s−1 for group-II, and 4 ± 2 km s−1 for group-III. Note that the vast majority of objects located in the transition region (those marked with "*" in Table 3) have velocities in between those characteristic for group-I and group-II, with the clear exception being IRAS 17106−3046, which has a very low Vexp that is more typical of group-III objects. Because the AGB wind velocity is expected to be higher for more massive AGB stars (see, e.g., the discussions of Nyman et al. 1992), the trend we found suggests that group-II objects are statistically more massive than group-I pAGB stars. On the other hand, such low expansion velocities for group-III objects suggest that CO is observed from circumstellar disks (rotating and/or expanding) rather than from outflows (Bujarrabal et al. 2005, 2013). It is very likely that such disks are formed in binary systems (e.g., van Winckel 2003).
There are two objects in group-I (89 Her and AI Sco), which have very low expansion velocities for their CSE derived from CO lines. Both of them are known to be binaries with 0-type SEDs, O-rich chemistry, and a blue C23 color close to that typical of O-rich AGB stars. They share characteristics of group-III pAGB objects, but at the same time have a relatively strong CO 2–1 emission in comparison with their 25 μm continuum flux.
The other two group-I objects (IRAS 08005−2356 and IRAS 23541+7031), on the other hand, have very high expansion velocities, much larger even than those typical for group-II pAGB objects. IRAS 08005−2356 has a broad CO line, which was only tentatively detected by Hu et al. (1994). However, similarly high velocities are also detected in the optical spectrum of this star by Slijkhuis et al. (1991), and Sánchez Contreras et al. (2008), which may be interpreted as a signature of an ongoing fast wind (or jet) from this source. Its type-I SED indicates significant near-infrared emission, which may be interpreted as emission from hot dust in a disk, but its RCO25 = 5.20 is the largest among group-I pAGB stars. IRAS 23541+7031 has a disk or torus of molecular gas, which seems to be expanding (Castro-Carrizo et al. 2002). It has very rich and complex wind activity and rapidly evolving shocked material (Sánchez Contreras et al. 2010). In this respect, a broad CO 2–1 line detected by Hajian et al. (1996) is not surprising.
Roberts 22 and IRAS 17245−3951 (Walnut Nebula) are two other special objects with normal or high CSE expansion velocities (31 and 15 km s−1, respectively), but this time being members of our group-III objects (RCO25 = 0.16 and 0.25, respectively). Again, the broad CO lines may be interpreted by the contribution from bipolar outflows, because both show typical bipolar nebulae. We note that Roberts 22 was known to show broadened Hα emission line and was thus suspected to be a Wolf–Rayet star (Roberts 1962).
6.4. Post-AGB Sub-types
Finally, we would like to call attention to the fact that, among sources from Table 3, there are two pAGB classes (Szczerba et al. 2007) that are the most abundant. They are "21 μm" sources (12 objects) and RV Tau stars (8 sources). These two groups have quite well defined properties. The "21 μm" sources are a group of C-rich intermediate mass stars with the still unidentified 21 μm dust feature (Kwok et al. 1989), which also show s-process element enhancement (Van Winckel & Reyniers 2000), and have periodic variability well correlated with their effective temperature (Hrivnak et al. 2010). RV Tau stars are luminous variable stars, which show alternating deep and shallow minima with periods between 30 and 150 days, and spectral types F, G, and K (e.g., Preston et al. 1963). Most of them show IR excess, which is interpreted as a remnant of AGB mass loss (Jura 1986). RV Tau stars with near-IR excess (very likely due to radiation from disks) are probably binaries (de Ruyter et al. 2005).
These two groups have well established positions on the CO-IR diagram. Almost all members of the "21 μm" type sources from our sample are in our group-I, with one belonging to the transition region and only one to group-III (IRAS 19477+2401). It is remarkable that 10 objects (out of 17, or 59%) in group-I are "21 μm" sources. Their IR colors are in the range −1.3 < C23 < −0.55. All but one have a G or F spectral type, 9 (among 12) have an SED of IVa or IVb type, none of them is known to be binary, and their outflow velocities are around 10 km s−1 (with an average of 12 ± 3 km s−1).
On the other hand, 7 (out of 8) RV Tau stars from our sample belong to group-III objects, with only one source (AI Sco) being a member of group-I on the CO-IR diagram. This is not so surprising since RV Tau variables are well-known to be CO-deficient stars (Alcolea & Bujarrabal 1991). RV Tau stars from our sample consist of the majority of the blue part of the group-III objects, with IR colors in a narrow range of −1.5 < C23 < −1.1. They have O-rich chemistry, 7 (out of 8) have SEDs classified as 0 or I (with AR Pup being the only exception with an SED of type-III), 7 of them are also known binaries (with the only exception being AI CMi, which does not have near-IR excess; see, e.g., SED in the Torun catalog), and the three RV Tau variables with detected CO 2–1 lines all show very narrow CO lines (with Vexp = 1.5 ∼ 5.6 km s−1).
6.5. Overall Properties of the CO-IR Groups of Post-AGB Stars
We summarize below the properties of the different groups of pAGB objects, as inferred from the above discussion. The key features of each CO-IR group are collected in Table 4 and illustrated in Figure 7.

Figure 7. Cartoon illustrates the main regions and the key features of the three pAGB CO-IR groups. Observed pAGB stars are shown as gray points.
Download figure:
Standard image High-resolution imageTable 4. Summary of the Bulk Properties of the Three CO-IR Groups
| Group | C23 | RCO25 | Chemistry | Sp.Type | Binary | SED.Type | Vexp | Special Objects |
|---|---|---|---|---|---|---|---|---|
| km s−1 | ||||||||
| I | −1.52 ∼ −0.5 | 0.42 ∼ 5.2 | C | F, G | 7% | III, IVa, IVb | 12 ± 2 | 21 μm objects |
| II | +0.36 ∼ +2.97 | 0.37 ∼ 59.62 | O or C | K to B | 44% | 0, II, III, IVb | 28 ± 12 | |
| III | −2.25 ∼ −0.17 | <0.26 | O | M to B | 39% | 0, I, II | 4 ± 2 | RV Tau variables |
Download table as: ASCIITypeset image
6.5.1. Group-I
The group-I pAGB stars have a relatively narrow range of RCO25 ratios from 0.42 to 5.2 MHz, with a median of ∼1 MHz and C23 color varying between −1.5 and −0.5. They represent the early pAGB stage of intermediate mass pAGB stars, because of their F to G spectral types and C-rich chemistry. This group contains almost all of the considered "21 μm" objects.
6.5.2. Group-II
The group-II pAGB stars are the reddest objects in our sample. They are distributed along a log-linear trend on the CO-IR diagram, which coincides with a similar trend of PNe. On average, group-II objects are more massive pAGB stars than group-I sources, due to their higher Vexp. However, this region should also contain evolved intermediate mass pAGB stars that are approaching the PNe phase.
6.5.3. Group-III
The group-III pAGB objects are those with C23 colors similar to those of group-I objects but with much weaker CO 2–1 lines. They are probably the lowest mass pAGB stars, predominantly O-rich, with very high percentage of known binaries, which is in agreement with their type-0, I, and II SED (near-IR excess). Most of the RV Tau variables are in this group.
6.5.4. Transition Region
The objects in this region have C23 colors intermediate between groups-I and II. They are predominantly O-rich like group-II objects, but have RCO25 ratios similar to group-I objects. Their CSE expansion velocities are also intermediate between the two groups.
7. SUMMARY
A survey of the CO 2–1 line has been performed toward 58 known high Galactic latitude pAGB stars. Circumstellar CO lines were detected only toward five of these objects, with one new detection. The detected line profiles show various features such as line wings, absorption features, and a triangular peak.
To complete our survey, we performed a compilation of the literature reporting on single-dish CO 2–1 line observations for all 393 pAGB stars (likely, RCrB-eHe-LTP and RV Tau types from the Torun Catalog of pAGB stars). We found observations for 133 pAGB stars (34% of all objects in the Torun Catalog). The CO 2–1 line has been detected in 44 objects among them. The CO 2–1 line data for AGB stars and PNe were also compiled for comparison.
CO-IR flux ratio RCO25 is defined using the integrated CO 2–1 line flux and IRAS 25 μm flux density. This ratio is compared with IR color C23 that is defined with the IRAS 60 to 25 μm flux ratio. So constructed CO-IR diagram is used to investigate the pAGB phase of stellar evolution.
Post-AGB stars are segregated into three groups on the CO-IR diagram: group-I pAGB stars show a narrow range of RCO25 ratios that are independent of the C23 colors (Equation (2)), groups-II pAGB stars have redder C23 colors and usually larger RCO25 ratios, and group-III pAGB stars have significantly smaller RCO25 ratios (weak CO lines).
Comparison of the pAGB stars with AGB stars and PNe on the CO-IR diagram reveals that post AGB objects are really located between the AGB stars and PNe. PNe show a profound trend on the CO-IR diagram which agrees well with the trend of group-II pAGB stars.
Combining these features with various properties such as chemical types, central star spectral types, binarity, SED types, CSE expansion velocities, and pAGB sub-types (defined in the Torun Catalog) of the pAGB stars, the three pAGB CO-IR groups are found to have distinctive characteristics related to mass, evolutionary stage, and binarity.
The CO-IR diagram is proven to be a powerful tool for discriminating the different effects of stellar mass, evolution, and binarity of pAGB stars and to investigate the co-evolution of circumstellar gas and dust during the fast post-AGB stage.
This research has intensively made use of NASA's Astrophysics Data System Bibliographic Services and SIMBAD database, operated at CDS, Strasbourg, France. We thank the ARO telescope operators for their assistance in remote observations. The SMT is operated by the Arizona Radio Observatory (ARO), Steward Observatory, University of Arizona. J.H. thanks Dr. T. M. Dame for kindly offering additional information from their Galactic CO 1–0 line survey to help us identify possible interstellar contamination.
This work benefited from the collaboration among the co-authors funded by the Marie Curie Actions International Research Staff Exchange Scheme (project No. 269193) of the European Union. J.H. also thanks the projects (No. 11173056 and 11033008) of the National Natural Science Foundation of China. R.Sz. and M.S. acknowledge the support from grants 2011/01/B/ST9/02031 and 2011/01/B/ST9/02229. T.I. acknowledges the support from NSC grant NSC 96-2112-M-001-018-MY3.
Facility: HHT - Heinrich Hertz Submillimeter Telescope.
APPENDIX A: COMPILATION OF LITERATURE CO 2–1 LINE DATA FOR AGB STARS, pAGB STARS, AND PNE
Refereed papers that contain original single-dish observations of the CO 2–1 line have been searched for in the ADS database using object position (with a search radius of 1') for all 393 known pAGB stars in version 2 of the Torun Catalog of pAGB stars (Szczerba et al. 2012). The search was completed by 2011 October 26. Both single pointing observations and single-dish mapping are considered. Interferometer data are not considered due to the missing flux issue.
CO line parameters such as line peak temperature (Tmb or  or
or  ), line area, line center velocity, and CSE expansion velocity are compiled, if available. The rms noise level in the baseline are used as the 1 σ upper limit of undetected lines. The information about the telescopes, e.g., conversion factor to obtain main beam temperature from other antenna temperature scales, the telescope response (Jy K−1) for conversion of main beam temperature into line flux (Jy), and the beam size of the telescopes at CO 2–1 line frequency are also collected. The telescope responses are adopted as nominal values for all involved telescopes: 7.33 Jy K−1 for the 13'' beam of the IRAM 30 m, 21 Jy K−1 for the 22'' beam of the JCMT 15 m, 25 Jy K−1 for the 24'' beam of the SEST 15 m, 44.4 Jy K−1 for the 32'' beam of the AROSMT 10 m, 39 Jy K−1 for the 30'' beam of both the NRAO 12 m and the CSO 10.4 m telescopes, and 29.4 Jy K−1 for the 26'' beam of the old 10 m Caltech OVRO telescope.
Here we give the list of all 175 CO 2–1 data records for 87 pAGB stars in Table 5, in which data records are sorted in increasing alphabetic order of object names and increasing observation dates. When available, we also collect the information about the chemistry of the observed circumstellar shells (see Table 5).
Table 5. Literature CO 2–1 Line Data of Post-AGB Stars
| IRAS | Other Name | Chem | Tp(σ) | NoteTa | I(σ) | Vsys (σ) | Vexp (σ) | Telb | Tscale | Obs.modec | Obs.Date | Literature |
|---|---|---|---|---|---|---|---|---|---|---|---|---|
| (mK) | (K km s−1) | (km s−1) | (km s−1) | yyyy-mm-dd | ||||||||
| CRL 2688 | 1300 | −28 (3) | 31 | OVRO | TA* | S | 1978-03,04 | Wannier et al. (1979) | ||||
| CRL 2688 | C | 2300 (500) | OVRO | TA* | MapC | 1978-11 to 12,1979-11 to 12 | Knapp et al. (1982) | |||||
| CRL 2688 | 4200 | ARO12m | TA* | S | 1985-02,04 | Wannier & Sahai (1987) | ||||||
| CRL 2688 | 185 (2) | −36.0 | 17.9(2.3) | IRAM30m | Tmb | S | 1988-08 | Kahane et al. (1992) | ||||
| CRL 2688 | 312.5 (1.3) | −35.6 | 60 | IRAM30m | Tmb | S | 1991-06 | Bachiller et al. (1997) | ||||
| CRL 2688 | 5890 (20) | 151.7 | −35.7 | 31 | JCMT | TA* | S | 1995-05 | Greaves & Holland (1997) | |||
| CRL 2688 | 312.5 | IRAM30m | Tmb | S | 1996-11,1997-05 | Palla et al. (2000) | ||||||
| CRL 2688 | C | 16670 | Jy K−1 | IRAM30m | Tmb | S | 2000-09 | Herpin et al. (2002) | ||||
| HD 107369 | (200) | SEST | Tmb | S | 1989-05,1990-07 | van der Veen et al. (1993) | ||||||
| V4334 Sgr | (23) | JCMT | TA* | S | 1997-06-29 | Evans et al. (1998) | ||||||
| 01005+7910 | (50) | IRAM30m | Tmb | S | 1989-01 | Omont et al. (1993) | ||||||
| 01005+7910 | C | (16) | SMT10m | Tmb | S | 1999-12-03 to 2000-02-04 | Hrivnak & Bieging (2005) | |||||
| 02143+5852 | (248) | cont | IRAM30m | Tmb | S | 1989-01 | Omont et al. (1993) | |||||
| 02143+5852 | (14) | cont | SMT10m | Tmb | S | 1999-12-03 to 2000-02-04 | Hrivnak & Bieging (2005) | |||||
| 04166+5719 | TW Cam | O | (50) | IRAM30m | Tmb | S | 1989-04 to 06 | Alcolea & Bujarrabal (1991) | ||||
| 04296+3429 | 400 | −62.3 | 15.6 | JCMT | TR* | S | 1988-12 | Woodsworth et al. (1990) | ||||
| 04296+3429 | C | 450 (128) | 8.3 | −66 | 12.0 | IRAM30m | Tmb | MapC | 1989-01 | Omont et al. (1993) | ||
| 04296+3429 | C | 70 (17) | 1.12 | −64.8 | 10.8 | SMT10m | Tmb | S | 1999-12-03 to 2000-02-04 | Hrivnak & Bieging (2005) | ||
| 04395+3601 | CRL 618 | C | 2100 (800) | −29.0 (3) | 17.0 (2) | OVRO | TA* | MapC | 1978-11 to 12,1979-11 to 12 | Knapp et al. (1982) | ||
| 04395+3601 | CRL 618 | 2000 | ARO12m | TA* | S | 1985-02,04 | Wannier & Sahai (1987) | |||||
| 04395+3601 | CRL 618 | 2200 (150) | 53.9 | −22 | 18 | ARO12m | Tmb | S | 1985-12 to 1988-01 | Huggins & Healy (1989) | ||
| 04395+3601 | CRL 618 | 3500 (90) | −21.7 (0.3) | 18.6 (0.4) | ARO12m | TA* | S | 1987-01-13 to 16 | Wannier et al. (1990) | |||
| 04395+3601 | CRL 618 | 9300 (160) | 250.0 | −21.9 | 11.6 | IRAM30m | Tmb | MapC | 1987-02 | Bachiller et al. (1988) | ||
| 04395+3601 | CRL 618 | 161 (1) | −21.4 | 18.5 (1.7) | IRAM30m | Tmb | S | 1988-08 | Kahane et al. (1992) | |||
| 04395+3601 | CRL 618 | 8640 | 2C | 270.0 (3.4) | −21.9 (0.2) | 18.2 (0.5) | IRAM30m | Tmb | S | 1988-08 | Cernicharo et al. (1989) | |
| 04395+3601 | CRL 618 | 5160 (200) | 2C | −22.6 (1.0) | 19.1 (0.8) | CSO | Tmb | S | 1988-08,1989-11 | Gammie et al. (1989) | ||
| 04395+3601 | CRL 618 | 182.2 (1.1) | −21.5 | 40 | IRAM30m | Tmb | S | 1991-06 | Bachiller et al. (1997) | |||
| 04395+3601 | CRL 618 | 46.2 (5.1) | ARO12m | Tmb | MapC | 1994-11-30 | Meixner et al. (1998) | |||||
| 04395+3601 | CRL 618 | 182.2 | IRAM30m | Tmb | S | 1996-11,1997-05 | Palla et al. (2000) | |||||
| 04395+3601 | CRL 618 | C | 2400 (90) | 60.0 (0.8) | −22.0 | 23.9 | ARO12m | Tmb | S | 1997-05,1997-12 | Balser et al. (2002) | |
| 04395+3601 | CRL 618 | C | 11190 | Jy K−1 | IRAM30m | Tmb | S | 2000-09 | Herpin et al. (2002) | |||
| 04440+2605 | RV Tau | (37) | ARO12m | TA* | S | 1987-01-13 to 16 | Wannier et al. (1990) | |||||
| 04440+2605 | RV Tau | (60) | IRAM30m | Tmb | S | 1988-06 | Bujarrabal et al. (1988) | |||||
| 04440+2605 | RV Tau | O | (30) | IRAM30m | Tmb | S | 1989-04 to 06 | Alcolea & Bujarrabal (1991) | ||||
| 05338−3051 | RV Col | (200) | SEST | Tmb | S | 1989-05,1990-07 | van der Veen et al. (1993) | |||||
| 06034+1354 | DY Ori | (30) | IRAM30m | Tmb | S | 1989-04 to 06 | Alcolea & Bujarrabal (1991) | |||||
| 06072+0953 | CT Ori | (40) | IRAM30m | Tmb | S | 1989-04 to 06 | Alcolea & Bujarrabal (1991) | |||||
| 06108+2743 | SU Gem | (26) | ARO12m | TA* | S | 1987-01-13 to 16 | Wannier et al. (1990) | |||||
| 06108+2743 | SU Gem | O | (100) | IRAM30m | Tmb | S | 1989-04 to 06 | Alcolea & Bujarrabal (1991) | ||||
| 06176−1036 | Red Rectangle | (160) | ARO12m | Tmb | S | 1984-12 | Zuckerman & Dyck (1986a) | |||||
| 06176−1036 | Red Rectangle | 1500 | hand | 6.6 | +0.5 | 2.2 | IRAM30m | Tmb | S | 1993-04 | Jura et al. (1995) | |
| 06176−1036 | Red Rectangle | (18) | 1.36 | −1 | 11 | ARO12m | Tmb | S | 1994-01 | Dayal & Bieging (1996) | ||
| 06176−1036 | Red Rectangle | 260 (20) | 1.80 | +0.2 | 9 | JCMT | TA* | S | 1995-05 | Greaves & Holland (1997) | ||
| 06530−0213 | 610 (110) | 7.0 | +33 | 10 | SEST | Tmb | S | 1991-04 | Hu et al. (1994) | |||
| 06530−0213 | C | 120 (12) | 2.47 | +31.4 | 12.5 | SMT10m | Tmb | S | 1999-12-03 to 2000-02-04 | Hrivnak & Bieging (2005) | ||
| 07134+1005 | HD 56126 | C | 3210 (97) | 43.9 | +73 | 10.2 | IRAM30m | Tmb | S | 1989-01 | Omont et al. (1993) | |
| 07134+1005 | HD 56126 | C | 2200 (100) | 28 | +73 | IRAM30m | Tmb | MapC | 1990-04 to 06,1991-01 | Bujarrabal et al. (1992) | ||
| 07134+1005 | HD 56126 | C | 640 (70) | 9.2 (0.9) | +73.0(0.8) | 10.7(1.1) | CSO | Tmb | S | 1996-12-28 to 1997-01-02 | Knapp et al. (1998) | |
| 07134+1005 | HD 56126 | C | 630 (5) | 9.03 | +73.5 | 10.6 | SMT10m | Tmb | S | 1999-12-03 to 2000-02-04 | Hrivnak & Bieging (2005) | |
| 07284−0940 | U Mon | (33) | ARO12m | TA* | S | 1987-01-13 to 16 | Wannier et al. (1990) | |||||
| 07284-0940 | U Mon | (150) | IRAM30m | Tmb | S | 1988-06 | Bujarrabal et al. (1988) | |||||
| 07284−0940 | U Mon | O | (70) | IRAM30m | Tmb | S | 1989-04 to 06 | Alcolea & Bujarrabal (1991) | ||||
| 07331+0021 | AI CMi | O | (56) | IRAM30m | Tmb | S | 1989-01 | Omont et al. (1993) | ||||
| 07399−1435 | OH231.8+4.2 | O | 3600 | hand | +33 | 30 (5) | SEST | Tmb | MapC | 1996-11 | Sánchez Contreras et al. (1997) | |
| 07399−1435 | OH231.8+4.2 | O | 580 (20) | +36.2(2.6) | 41.6(2.6) | SMT10m | TA* | S | 2003-10 to 2007-06 | Milam et al. (2009) | ||
| 07430+1115 | (90) | IRAM30m | Tmb | S | 1989-01 | Omont et al. (1993) | ||||||
| 07430+1115 | C | (13) | SMT10m | Tmb | S | 1999-12-03 to 2000-02-04 | Hrivnak & Bieging (2005) | |||||
| 08005−2356 | 120 (60) | 14 | +50 | 100 | SEST | Tmb | S | 1991-04 | Hu et al. (1994) | |||
| 08011−3627 | AR Pup | O | (200) | IRAM30m | Tmb | S | 1989-04 to 06 | Alcolea & Bujarrabal (1991) | ||||
| 08187−1905 | HD 70379 | (18) | SMT10m | Tmb | S | 1999-12-03 to 2000-02-04 | Hrivnak & Bieging (2005) | |||||
| 08544−4431 | V390 Vel | C | 140 (10) | 1.2 | +45.6 | 8.0 | SEST | Tmb | S | 1999-10,2001-03 | Groenewegen et al. (2002) | |
| 08544−4431 | V390 Vel | 3.0 | +61.3 | 6.4 | SEST | Tmb | S | 1999-10-02,2000-07-28 | Maas et al. (2003) | |||
| 09032−3953 | 180 (60) | 6.7 | +36 | 25 | SEST | Tmb | S | 1991-04 | Hu et al. (1994) | |||
| 09370−4826 | (160) | SEST | Tmb | S | 1991-04 | Hu et al. (1994) | ||||||
| 09371+1212 | FROSTY LEONIS | 176 (7) | −5.6 (0.4) | 36.6(0.5) | ARO12m | TA* | S | 1987-01-13 to 16 | Wannier et al. (1990) | |||
| 10158−2844 | HR 4049 | (200) | SEST | Tmb | S | 1989-05,1990-07 | van der Veen et al. (1993) | |||||
| 10158−2844 | HR 4049 | C | (40) | IRAM30m | Tmb | S | 1990-04 to 06,1991-01 | Bujarrabal et al. (1992) | ||||
| 10178−5958 | Hen 3-401 | 190 (30) | 5.2 | −29.0 | 15 | SEST | Tmb | S | 19??-09-01 to 04 | Bujarrabal & Bachiller (1991) | ||
| 10194−5625 | (160) | SEST | Tmb | S | 1991-04 | Hu et al. (1994) | ||||||
| 10197−5750 | Roberts 22 | 150 (40) | 9.0 | −0.1 | SEST | Tmb | S | 19??-09-01 to 04 | Bujarrabal & Bachiller (1991) | |||
| 11000−6153 | HD 95767 | (200) | SEST | Tmb | S | 1989-05,1990-07 | van der Veen et al. (1993) | |||||
| 11381−6401 | (190) | SEST | Tmb | S | 1991-04 | Hu et al. (1994) | ||||||
| 11385−5517 | HD 101584 | O | 300 | 41.3 | +44 | 145. | SEST | Tmb | MapC | 1997-08 | Olofsson & Nyman (1999) | |
| 11544−6408 | (140) | SEST | Tmb | S | 1991-04 | Hu et al. (1994) | ||||||
| 12067−4508 | HD 105578 | (200) | SEST | Tmb | S | 1989-05,1990-07 | van der Veen et al. (1993) | |||||
| 12222−4652 | HD 108015 | (200) | SEST | Tmb | S | 1989-05,1990-07 | van der Veen et al. (1993) | |||||
| 12419−5414 | Boomerang Nebula | 160 | hand | −10 | 35 | SEST | Tmb | MapC | 1994-08,1995-08 to 1995-10 | Sahai & Nyman (1997) | ||
| 12419−5414 | Boomerang Nebula | 150 (20) | 5.0 | −3.5 | SEST | Tmb | S | 19??-09-01 to 04 | Bujarrabal & Bachiller (1991) | |||
| 14488−5405 | CPD −53 5736 | 90 | 2.07 | −10 | 10.0 | SEST | Tmb | S | 1998 to 2002 | Woods et al. (2005) | ||
| 14524−6838 | HD 131356 | (200) | SEST | Tmb | S | 1989-05,1990-07 | van der Veen et al. (1993) | |||||
| 15465+2818 | R CrB | (100) | ARO12m | Tmb | S | 1984-12 | Zuckerman & Dyck (1986a) | |||||
| 15465+2818 | R CrB | (41) | ARO12m | TA* | S | 1987-01-13 to 16 | Wannier et al. (1990) | |||||
| 16342−3814 | OH 344.1 +5.8 | O | 29 (7) | 2.14 (0.14) | +44 (1) | 46 (1) | SMT10m | Tmb | S | 2008-05-09 | He et al. (2008) | |
| 16594−4656 | 1750 | 32.60 | −25 | 10.0 | SEST | Tmb | S | 1998 to 2002 | Woods et al. (2005) | |||
| 17106−3046 | 300 | 1.84 | 0 | 2 | SEST | Tmb | S | 1998 to 2002 | Woods et al. (2005) | |||
| 17150−3224 | RAFGL 6815 | 1000 (300) | 18.6 | +15 | 15 | JCMT | Tmb | S | 1990-11,12 | Hu et al. (1994) | ||
| 17150−3224 | RAFGL 6815 | O | 1000 | +15 | 15 | JCMT | Tmb | S | 1990-12 | Hu et al. (1993) | ||
| 17150−3224 | RAFGL 6815 | 650 | 12.84 | +15 | SEST | Tmb | S | 1998 to 2002 | Woods et al. (2005) | |||
| 17245−3951 | OH348.8-2.8 | 40 | 0.58 | 0 | 15 | SEST | Tmb | S | 1998 to 2002 | Woods et al. (2005) | ||
| 17423−1755 | Hen 3-1475 | 280 (40) | 15.9 (0.5) | +47.5(0.9) | 53 (2) | IRAM30m | Tmb | S | 1997-09 | Huggins et al. (2004) | ||
| 17436+5003 | V814 Her | 370 | −37.5 | 7.7 | ARO12m | Tmb | S | 1986-04,1987-04 | Zuckerman & Dyck (1989) | |||
| 17436+5003 | V814 Her | 1800 | 33 | −35.5 | 13.2 | IRAM30m | Tmb | S | 1987-10 | Likkel et al. (1991) | ||
| 17436+5003 | V814 Her | O | 2000 (40) | 36.1 | −35 | IRAM30m | Tmb | MapC | 1990-04 to 06,1991-01 | Bujarrabal et al. (1992) | ||
| 17436+5003 | V814 Her | O | 1500 | 29.3 | −34.7 | 11.7 | IRAM30m | Tmb | S | 1993-08 | Neri et al. (1998) | |
| 17436+5003 | V814 Her | O | 230 (6) | 4.24 | −34.8 | 13.8 | SMT10m | Tmb | S | 1999-12-03 to 2000-02-04 | Hrivnak & Bieging (2005) | |
| 17441−2411 | AFGL 5385 | 670 (160) | 8.3 | +5 | 15 | SEST | Tmb | S | 1991-04 | Hu et al. (1994) | ||
| 17441−2411 | AFGL 5385 | 570 | 6.24 | +110 | SEST | Tmb | S | 1998 to 2002 | Woods et al. (2005) | |||
| 17530−3348 | AI Sco | (600) | IRAM30m | Tmb | S | 1988-06 | Bujarrabal et al. (1988) | |||||
| 17530−3348 | AI Sco | O | 300 (100) | 1.8 | −37 | IRAM30m | Tmb | S | 1989-04 to 06 | Alcolea & Bujarrabal (1991) | ||
| 17534+2603 | 89 Her | 600 | 4.1 | −7.9 | 3.2 | IRAM30m | Tmb | S | 1987-10 | Likkel et al. (1991) | ||
| 17534+2603 | 89 Her | 1000 (70) | 4.6 | −7.9 | 4 | IRAM30m | Tmb | S | 1989-04 to 06 | Alcolea & Bujarrabal (1991) | ||
| 17534+2603 | 89 Her | 200 (50) | −8.0 (1.3) | 8.8 (1.3) | SMT10m | TA* | S | 2003-10 to 2007-06 | Milam et al. (2009) | |||
| 18025−3906 | (130) | SEST | Tmb | S | 1991-04 | Hu et al. (1994) | ||||||
| 18095+2704 | O | (30) | IRAM30m | Tmb | S | 1990-04 to 06,1991-01 | Bujarrabal et al. (1992) | |||||
| 18276−1431 | OH17.7-2.0 | (100) | CSO | TA* | S | 1987-07 | Knapp et al. (1989) | |||||
| 18276−1431 | OH17.7-2.0 | O | 1000 (170) | 19.2 (1.0) | +61.6 | 12.2 | IRAM30m | Tmb | S | 1988-02 | Heske et al. (1990) | |
| 18281+2149 | AC Her | (20) | ARO12m | TA* | S | 1987-01-13 to 16 | Wannier et al. (1990) | |||||
| 18281+2149 | AC Her | 200 | 0.7 | IRAM30m | Tmb | S | 1988-06 | Bujarrabal et al. (1988) | ||||
| 18281+2149 | AC Her | C | 100 (300) | 0.5 | −10 | IRAM30m | Tmb | S | 1989-04 to 06 | Alcolea & Bujarrabal (1991) | ||
| 18372−2257 | V348 Sgr | (150) | SEST | Tmb | S | 1989-05,1990-07 | van der Veen et al. (1993) | |||||
| 18415−2100 | MV Sgr | (200) | SEST | Tmb | S | 1989-05,1990-07 | van der Veen et al. (1993) | |||||
| 19114+0002 | AFGL 2343 | 380 | +94.3 | 33.7 | ARO12m | Tmb | S | 1986-04,1987-04 | Zuckerman & Dyck (1989) | |||
| 19114+0002 | AFGL 2343 | O | 2520 (107) | 126.8 | +99 | 33.7 | IRAM30m | Tmb | S | 1989-01 | Omont et al. (1993) | |
| 19114+0002 | AFGL 2343 | 470 (70) | 22.8 (0.5) | +99.0(0.2) | 28.1(0.2) | SEST | Tmb | S | 1989-05,1990-07 | van der Veen et al. (1993) | ||
| 19114+0002 | AFGL 2343 | O | 3400 (100) | 171 | +99 | IRAM30m | Tmb | MapC | 1990-04 to 06,1991-01 | Bujarrabal et al. (1992) | ||
| 19114+0002 | AFGL 2343 | O | 3450 (80) | 172.4 | +97 | 37 | IRAM30m | Tmb | MapC | 1999-08 | Josselin & Lèbre (2001) | |
| 19132−3336 | RY Sgr | (300) | SEST | Tmb | S | 1989-05,1990-07 | van der Veen et al. (1993) | |||||
| 19306+1407 | (77) | IRAM30m | Tmb | S | 1989-01 | Omont et al. (1993) | ||||||
| 19343+2926 | PN M1-92 | O | 1100 | 56.6 | +0.3 | 32.5 | IRAM30m | Tmb | S | 1990-10 | Neri et al. (1998) | |
| 19374+2359 | (123) | cont | IRAM30m | Tmb | S | 1989-01 | Omont et al. (1993) | |||||
| 19374+2359 | (200) | JCMT | Tmb | S | 1990-11,12 | Hu et al. (1994) | ||||||
| 19386+0155 | (63) | IRAM30m | Tmb | S | 1990-07 | Omont et al. (1993) | ||||||
| 19454+2920 | 730 | 14.3 | +21.4 | 14.5 | IRAM30m | Tmb | S | 1988-01 | Likkel et al. (1991) | |||
| 19454+2920 | C | 730 (41) | 14.3 | +21 | 14.5 | IRAM30m | Tmb | MapC | 1989-01 | Omont et al. (1993) | ||
| 19454+2920 | 210 | 3.8 | +19.7 | 17.8 | JCMT | TA* | S | 1991-10-25 to 27 | Volk et al. (1993) | |||
| 19475+3119 | HD 331319 | 770 | 15 | +17.7 | 14.6 | IRAM30m | Tmb | S | 1989-01 | Likkel et al. (1991) | ||
| 19475+3119 | HD 331319 | 720 (62) | 14.9 | +18 | 14.5 | IRAM30m | Tmb | MapC | 1989-01 | Omont et al. (1993) | ||
| 19475+3119 | HD 331319 | O | 160 (7) | 3.51 | +18.4 | 16.2 | SMT10m | Tmb | S | 1999-12-03 to 2000-02-04 | Hrivnak & Bieging (2005) | |
| 19477+2401 | (10) | cont | SMT10m | Tmb | S | 1999-12-03 to 2000-02-04 | Hrivnak & Bieging (2005) | |||||
| 19480+2504 | 600 | 13 | +41.7 | 15.4 | IRAM30m | Tmb | S | 1989-01 | Likkel et al. (1991) | |||
| 19480+2504 | C | 610 (54) | 12.8 | +42 | 12.3 | IRAM30m | Tmb | S | 1989-01 | Omont et al. (1993) | ||
| 19480+2504 | C | 470 (94) | 9.8 | +41 | 15.4 | IRAM30m | Tmb | MapC | 1990-07 | Omont et al. (1993) | ||
| 19480+2504 | 170 | 5.8 | +42.0 | 27.0 | JCMT | TA* | S | 1991-10-25 to 27 | Volk et al. (1993) | |||
| 19486+1350 | TW Aql | O | (60) | IRAM30m | Tmb | S | 1989-04 to 06 | Alcolea & Bujarrabal (1991) | ||||
| 19500−1709 | HD 187885 | 300 (70) | 3.8 (0.3) | +25 | 8 | CSO | TA* | S | 1987-07 | Knapp et al. (1989) | ||
| 19500−1709 | HD 187885 | 1230 (45) | 27.7 | +25 | 12.0 | IRAM30m | Tmb | MapC | 1989-01 | Omont et al. (1993) | ||
| 19500−1709 | HD 187885 | 390 (40) | 7.0 (0.2) | +26.0(0.3) | 13.2(0.5) | SEST | Tmb | S | 1989-05,1990-07 | van der Veen et al. (1993) | ||
| 19500−1709 | HD 187885 | C | 1900 (100) | 48 | +24 | IRAM30m | Tmb | MapC | 1990-04 to 06,1991-01 | Bujarrabal et al. (1992) | ||
| 19500−1709 | HD 187885 | 1360 (51) | 23.1 | +24 | 12.8 | IRAM30m | Tmb | S | 1990-07 | Omont et al. (1993) | ||
| 19500−1709 | HD 187885 | 1100 | 22.0 | +25.0 | IRAM30m | Tmb | S | 1990-10 | Neri et al. (1998) | |||
| 19500−1709 | HD 187885 | C | 190 (6) | 4.41 | +25.0 | 17.2 | SMT10m | Tmb | S | 1999-12-03 to 2000-02-04 | Hrivnak & Bieging (2005) | |
| 19590−1249 | LS IV −12 111 | O | (17) | SMT10m | Tmb | S | 1999-12-03 to 2000-02-04 | Hrivnak & Bieging (2005) | ||||
| 20000+3239 | 700 | 9.4 | +13.5 | 12.3 | IRAM30m | Tmb | S | 1989-01 | Likkel et al. (1991) | |||
| 20000+3239 | C | 550 (64) | cont | 9.5 | +14 | 12.0 | IRAM30m | Tmb | MapC | 1989-01 | Omont et al. (1993) | |
| 20004+2955 | V1027 Cyg | O | (50) | IRAM30m | Tmb | S | 1990-04 to 06,1991-01 | Bujarrabal et al. (1992) | ||||
| 20028+3910 | PN PM 2-43 | 160 | +4.2 | 10.5 | ARO12m | Tmb | S | 1984-12 | Zuckerman & Dyck (1986a) | |||
| 20028+3910 | PN PM 2-43 | 750 | 14.9 | +5.9 | 16.0 | IRAM30m | Tmb | S | 1989-01 | Likkel et al. (1991) | ||
| 20028+3910 | PN PM 2-43 | 700 (40) | 15.1 | +6 | 17.5 | IRAM30m | Tmb | MapC | 1989-01 | Omont et al. (1993) | ||
| 20028+3910 | PN PM 2-43 | 900 | 17.7 | +4.0 | 15.6 | IRAM30m | Tmb | S | 1993-08 | Neri et al. (1998) | ||
| 20028+3910 | PN PM 2-43 | 130 (11) | 2.53 | +6.2 | 13.0 | SMT10m | Tmb | S | 1999-12-03 to 2000-02-04 | Hrivnak & Bieging (2005) | ||
| 20117+1634 | R Sge | O | (100) | IRAM30m | Tmb | S | 1989-04 to 06 | Alcolea & Bujarrabal (1991) | ||||
| 20343+2625 | V Vul | O | (30) | IRAM30m | Tmb | S | 1989-04 to 06 | Alcolea & Bujarrabal (1991) | ||||
| 20462+3416 | LS II +34 26 | (15) | SMT10m | Tmb | S | 1999-12-03 to 2000-02-04 | Hrivnak & Bieging (2005) | |||||
| 20572+4919 | (14) | cont | SMT10m | Tmb | S | 1999-12-03 to 2000-02-04 | Hrivnak & Bieging (2005) | |||||
| 21537+6435 | (180) | JCMT | Tmb | S | 1990-11,12 | Hu et al. (1994) | ||||||
| 22023+5249 | (80) | IRAM30m | Tmb | S | 1989-01 | Omont et al. (1993) | ||||||
| 22223+4327 | (300) | IRAM30m | Tmb | S | 1988-01 | Likkel et al. (1991) | ||||||
| 22223+4327 | C | 640 (32) | 12.3 | −30 | 14.0 | IRAM30m | Tmb | MapC | 1989-01 | Omont et al. (1993) | ||
| 22272+5435 | HD 235858 | 3100 | −28.0 | 9.6 | JCMT | TR* | S | 1988-12 | Woodsworth et al. (1990) | |||
| 22272+5435 | HD 235858 | C | 6270 (55) | 80.5 | −28 | 11.8 | IRAM30m | Tmb | MapC | 1989-01 | Omont et al. (1993) | |
| 22272+5435 | HD 235858 | C | 6030 (119) | 76.3 | −29 | 9.5 | IRAM30m | Tmb | MapC | 1990-07 | Omont et al. (1993) | |
| 22272+5435 | HD 235858 | C | 5300 | 125.6 | −28.4 | 10.4 | IRAM30m | Tmb | S | 1991-05 | Neri et al. (1998) | |
| 22272+5435 | HD 235858 | C | 1120 (8) | 13.6 | −28.1 | 9.1 | SMT10m | Tmb | S | 1999-12-03 to 2000-02-04 | Hrivnak & Bieging (2005) | |
| 22327−1731 | HD213985 | C | (70) | IRAM30m | Tmb | S | 1990-04 to 06,1991-01 | Bujarrabal et al. (1992) | ||||
| 22574+6609 | 500 | 11 | −64.0 | 15 | IRAM30m | Tmb | S | 1988-01 | Likkel et al. (1991) | |||
| 22574+6609 | C | 60 (18) | 1.95 | −61.7 | 24.6 | SMT10m | Tmb | S | 1999-12-03 to 2000-02-04 | Hrivnak & Bieging (2005) | ||
| 23304+6147 | 1600 | 25 | −16.1 | 11.5 | IRAM30m | Tmb | S | 1988-01 | Likkel et al. (1991) | |||
| 23304+6147 | 700 | −15.9 | 15.5 | JCMT | TR* | S | 1988-12 | Woodsworth et al. (1990) | ||||
| 23304+6147 | C | 200 (8) | 2.92 | −16.6 | 9.2 | SMT10m | Tmb | S | 1999-12-03 to 2000-02-04 | Hrivnak & Bieging (2005) | ||
| 23321+6545 | PN PM 2-48 | 270 (110) | 7.5 (0.6) | −59 | 15 | CSO | TA* | S | 1987-07 | Knapp et al. (1989) | ||
| 23321+6545 | PN PM 2-48 | 1200 | 28 | −55.2 | 17.0 | IRAM30m | Tmb | S | 1989-01 | Likkel et al. (1991) | ||
| 23321+6545 | PN PM 2-48 | C | 1400 | 27.0 | −53.7 | 14.3 | IRAM30m | Tmb | S | 1991-05 | Neri et al. (1998) | |
| 23321+6545 | PN PM 2-48 | 370 | 7.1 | −55.3 | 18.2 | JCMT | TA* | S | 1991-10-25 to 27 | Volk et al. (1993) | ||
| 23541+7031 | PK 118+08.1 | 470 | 25.3 | −27 | 54 | IRAM30m | Tmb | S | 1989-10 to 1993-05 | Hajian et al. (1996) | ||
| Z02229+6208 | C | 480 (6) | 6.96 | +24.1 | 10.7 | SMT10m | Tmb | S | 1999-12-03 to 2000-02-04 | Hrivnak & Bieging (2005) |
Notes. Repeated observations of the same object are listed as separate entries. Our observations of high Galactic latitude pAGB objects are not included. acont = interstellar contamination; Jy K−1 = line peak temperature converted back from line peak flux in Jy; hand = line peak temperature measured by hand from published spectral plots; 2C = line peak temperature as the sum of a two components fit. bTelescopes for CO observations: ARO12m = ARO 12 m telescope at Kitt Peak; CSO = the 10.4 m Robert B. Leighton telescope of the Caltech Submillimeter Observatory on Mauna Kea, Hawaii; IRAM30m = IRAM 30 m telescope at Pico Veleta; JCMT = 15 m James Clerk Maxwell Telescope on Mauna Kea, Hawaii; OVRO = the Caltech 10 m telescope at the Owens Valley Radio Observatory; SEST = the 15 m Swedish-ESO Submillimetre Telescope on La Silla, Chile; SMT10m = the 10 m Sub-Millimeter Telescope on Mt. Graham, AZ. cObservation modes: S = single point; Map = single dish map center.
Duplicated CO 2–1 observations were averaged to give a mean line strength. Before averaging, we convert all antenna temperature scales into velocity-integrated line flux in Jy MHz, so that the measured line strengths by different telescopes can be directly compared to check consistency. In the case where only line peak temperature is given in the papers, the line width Vexp is used to estimate the line area by assuming a Gaussian line profile. In very few cases when the Vexp is also not given, a fixed value of 10 km s−1 is assumed. The repeated observations usually agree with each other within a factor of two to three, which is significantly larger than the usually accepted flux calibration uncertainty of 20%. The reason for the large variation could be attributed to pointing error, bad weather, or a technical problem during the observations. Weights are used in the averaging, which are set as follows: a weight of unity is set for most of the data entries, while a weight of 0.5 is given to those line area data estimated from line peak temperature and Vexp, and a weight of 2 is given to those single-dish mapping data because these observations have less problems with pointing and are more reliable for nearby extended objects.
The average quantities for all the 87 pAGB objects (the velocity-integrated CO 2–1 line flux, and CSE expansion velocity Vexp), as well as IRAS flux densities, IRAS colors (defined in Section 5.1), and CO-IR flux ratio RCO25 (defined by Equation (1) in Section 3) are collected in Table 6.
Table 6. Observed Properties from Literature for all the 87 Considered Post-AGB Stars
| Object | Other Name | FCO2-1(σ) | NoteCOa | Vexp | F12 | F25 | F60 | C12 | C23 | RCO25(σ) |
|---|---|---|---|---|---|---|---|---|---|---|
| (or IRAS) | (Jy MHz) | (km s−1) | (Jy) | (Jy) | (Jy) | (MHz) | ||||
| CRL 2688 | EGG NEBULA | 2220.96 (964.73) | 17.6 | |||||||
| HD 107369 | CD-31 9638 | (81.86) | Tp | |||||||
| V4334 Sgr | SAKURAI'S OBJECT | (11.63) | Tp | |||||||
| 01005+7910 | (6.00) | Tp | 3.905 | 24.23 | 10.07 | 1.98 | −0.95 | (0.248) | ||
| 02143+5852 | GLMP 26 | (10.18) | 5.897 | 18.06 | 5.395 | 1.22 | −1.31 | (0.564) | ||
| 04166+5719 | TW Cam | (6.00) | Tp | 8.252 | 5.602 | 1.84 | −0.42 | −1.21 | (1.071) | |
| 04296+3429 | GLMP 74 | 38.24 | 12.8 | 12.74 | 45.94 | 15.45 | 1.39 | −1.18 | 0.832 | |
| 04395+3601 | CRL 618 | 1354.12 (255.78) | 16.7 | 470.8 | 1106. | 1036. | 0.93 | −0.07 | 1.224 (0.231) | |
| 04440+2605 | RV Tau | (3.60) | 22.52 | 18.05 | 6.502 | −0.24 | −1.11 | (0.199) | ||
| 05338−3051 | RV Col | (81.86) | Tp | 0.349 | ||||||
| 06034+1354 | DY Ori | (3.60) | Tp | 12.43 | 14.89 | 4.182 | 0.20 | −1.38 | (0.242) | |
| 06072+0953 | CT Ori | (4.80) | Tp | 6.145 | 5.545 | 1.24 | −0.11 | −1.63 | (0.866) | |
| 06108+2743 | SU Gem | (12.00) | 7.905 | 5.684 | 2.193 | −0.36 | −1.03 | (2.111) | ||
| 06176−1036 | Red Rectangle | 40.25 (2.30) | 4.9 | 421.6 | 456.1 | 173.1 | 0.09 | −1.05 | 0.088 (0.005) | |
| 06530−0213 | PN PM 1-24 | 109.45 (25.12) | 11.3 | 6.114 | 27.41 | 15.05 | 1.63 | −0.65 | 3.993 (0.916) | |
| 07134+1005 | HD 56126 | 229.47 (61.58) | 9.9 | 24.51 | 116.7 | 50.13 | 1.69 | −0.92 | 1.966 (0.528) | |
| 07284−0940 | U Mon | (8.40) | 124.3 | 88.43 | 26.59 | −0.37 | −1.30 | (0.095) | ||
| 07331+0021 | AI CMi | (6.72) | Tp | 15.32 | 68.11 | 18.51 | 1.62 | −1.41 | (0.099) | |
| 07399−1435 | OH231.8+4.2 | 2248.50 | 21.4 | 18.98 | 226.3 | 548.3 | 2.69 | 0.96 | 9.936 | |
| 07430+1115 | GLMP 192 | (9.45) | 7.685 | 29.93 | 10.67 | 1.48 | −1.12 | (0.316) | ||
| 08005−2356 | V510 Pup | 269.15 | 100.0 | 17.96 | 51.8 | 29.83 | 1.15 | −0.60 | 5.196 | |
| 08011−3627 | AR Pup | (24.00) | Tp | 131.3 | 94.32 | 26.12 | −0.36 | −1.39 | (0.254) | |
| 08187−1905 | HD 70379 | (13.08) | Tp | 0.714 | 17.62 | 12.31 | 3.48 | −0.39 | (0.742) | |
| 08544−4431 | V390 Vel | 40.37 (17.30) | 5.6 | 180.3 | 158.8 | 56.25 | −0.14 | −1.13 | 0.254 (0.109) | |
| 09032−3953 | PN PM 2-9 | 128.81 | 25.0 | 20.38 | 125.9 | 92.31 | 1.98 | −0.34 | 1.023 | |
| 09370−4826 | GLMP 255 | (65.49) | Tp | 10.82 | 30.14 | 14.16 | 1.11 | −0.82 | (2.173) | |
| 09371+1212 | FROSTY LEONIS | 875.07 | Tp | 36.6 | 4.594 | 70.7 | 2.97 | 190.481 | ||
| 10158−2844 | HR 4049 | (4.80) | 48.25 | 9.553 | 1.77 | −1.76 | −1.83 | (0.502) | ||
| 10178−5958 | Hen 3-401 | 99.97 | 13.0 | 4.124 | 38.33 | 76.14 | 2.42 | 0.75 | 2.608 | |
| 10194−5625 | GLMP 271 | (65.49) | Tp | 16.75 | 57.02 | 27.78 | 1.33 | −0.78 | (1.149) | |
| 10197−5750 | Roberts 22 | 173.02 | 31.0 | 200. | 1092. | 588.3 | 1.84 | −0.67 | 0.158 | |
| 11000−6153 | HD 95767 | (81.86) | Tp | 22.13 | 15.65 | 10.9 | −0.38 | −0.39 | (5.231) | |
| 11381−6401 | (77.76) | Tp | 5.41 | 27.76 | 17.02 | 1.78 | −0.53 | (2.801) | ||
| 11385−5517 | HD 101584 | 793.98 | 45.0 | 92.6 | 138.3 | 193. | 0.44 | 0.36 | 5.741 | |
| 11544−6408 | GLMP 315 | (57.30) | Tp | 12.49 | 29.81 | 12.52 | 0.94 | −0.94 | (1.922) | |
| 12067−4508 | HD 105578 | (81.86) | Tp | 5.321 | 10.96 | 5.652 | 0.78 | −0.72 | (7.469) | |
| 12222−4652 | HD 108015 | (81.86) | Tp | 32.46 | 33.23 | 7.993 | 0.03 | −1.55 | (2.463) | |
| 12419−5414 | Boomerang Nebula | 184.84 (62.73) | 25.5 | 4.173 | 5.502 | 13.65 | 0.30 | 0.99 | 33.595 (11.401) | |
| 14488−5405 | CPD −53 5736 | 39.80 | 15.0 | 6.587 | 63.74 | 30.54 | 2.46 | −0.80 | 0.624 | |
| 14524−6838 | HD 131356 | (81.86) | Tp | 13.23 | 10.26 | 4.107 | −0.28 | −0.99 | (7.979) | |
| 15465+2818 | R CrB | (55.70) | 38.86 | 17.06 | 3.936 | −0.89 | −1.59 | (3.265) | ||
| 16342−3814 | OH 344.1 +5.8 | 73.07 (4.78) | 46.0 | 16.2 | 199.8 | 290.2 | 2.73 | 0.41 | 0.366 (0.024) | |
| 16594−4656 | WATER LILY NEBULA | 626.73 | 14.0 | 44.92 | 298. | 131.4 | 2.05 | −0.89 | 2.103 | |
| 17106−3046 | PN PM 2-23 | 35.37 | 1.0 | 4.007 | 62.38 | 51.19 | 2.98 | −0.21 | 0.567 | |
| 17150−3224 | RAFGL 6815 | 273.61 (26.76) | 14.8 | 57.92 | 322.3 | 268.3 | 1.86 | −0.20 | 0.849(0.083) | |
| 17245−3951 | OH348.8-2.8 | 11.15 | 15.0 | 3.356 | 44.73 | 38.23 | 2.81 | −0.17 | 0.249 | |
| 17423−1755 | Hen 3-1475 | 89.62 (2.82) | 26.5 | 7.052 | 28.31 | 63.68 | 1.51 | 0.88 | 3.166 (0.100) | |
| 17436+5003 | V814 Her | 180.62 (22.78) | 11.5 | 6.122 | 183.5 | 151.7 | 3.69 | −0.21 | 0.984(0.124) | |
| 17441−2411 | AFGL 5385 | 139.76 (19.80) | 12.5 | 42.78 | 191.1 | 106.5 | 1.63 | −0.63 | 0.731 (0.104) | |
| 17530−3348 | AI Sco | 10.15 | 2.8 | 17.59 | 11.38 | 2.95 | −0.47 | −1.47 | 0.892 | |
| 17534+2603 | 89 Her | 24.52 (1.41) | 3.9 | 97.52 | 54.49 | 13.42 | −0.63 | −1.52 | 0.450 (0.026) | |
| 18025−3906 | PN PM 2-34 | (53.21) | Tp | 4.295 | 41.2 | 30.11 | 2.45 | −0.34 | (1.292) | |
| 18095+2704 | V887 Her | (3.60) | Tp | 45.09 | 125.7 | 27.83 | 1.11 | −1.64 | (0.029) | |
| 18276−1431 | OH17.7-2.0 | 108.22 (5.64) | 12.2 | 22.65 | 132. | 120. | 1.91 | −0.10 | 0.820 (0.043) | |
| 18281+2149 | AC Her | 3.38 (0.56) | 1.5 | 41.43 | 65.33 | 21.37 | 0.49 | −1.21 | 0.052 (0.009) | |
| 18372−2257 | V348 Sgr | (61.39) | Tp | 5.533 | 2.999 | 2.876 | −0.66 | −0.05 | (20.470) | |
| 18415−2100 | MV Sgr | (81.86) | Tp | 0.597 | 1.565 | 0.777 | 1.05 | −0.76 | (52.307) | |
| 19114+0002 | AFGL 2343 | 837.39 (201.00) | 31.5 | 31.33 | 648.3 | 515.9 | 3.29 | −0.25 | 1.292 (0.310) | |
| 19132−3336 | RY Sgr | (122.78) | Tp | 77.17 | 26.25 | 5.433 | −1.17 | −1.71 | (4.677) | |
| 19306+1407 | GLMP 923 | (9.24) | Tp | 3.584 | 58.65 | 31.83 | 3.03 | −0.66 | (0.158) | |
| 19343+2926 | PN M1-92 | 319.13 | 32.5 | 17.52 | 59.76 | 118.4 | 1.33 | 0.74 | 5.340 | |
| 19374+2359 | (14.76) | Tp | 23.62 | 98.18 | 70.87 | 1.55 | −0.35 | (0.150) | ||
| 19386+0155 | V1648 Aql | (7.56) | Tp | 17.38 | 47.44 | 18.56 | 1.09 | −1.02 | (0.159) | |
| 19454+2920 | GLMP 950 | 91.14 (18.24) | 15.6 | 17.27 | 89.56 | 54.43 | 1.79 | −0.54 | 1.018 (0.204) | |
| 19475+3119 | HD 331319 | 93.09 (15.45) | 15.1 | 0.537 | 37.99 | 55.83 | 4.62 | 0.42 | 2.450(0.407) | |
| 19477+2401 | CLOVERLEAF NEBULA | (7.27) | Tp | 11.24 | 54.92 | 27.13 | 1.72 | −0.77 | (0.132) | |
| 19480+2504 | GLMP 953 | 88.65 (49.96) | 17.5 | 20.81 | 67.89 | 43.16 | 1.28 | −0.49 | 1.306(0.736) | |
| 19486+1350 | TW Aql | (7.20) | Tp | 5.232 | 11.25 | 0.83 | (1.376) | |||
| 19500−1709 | HD 187885 | 173.63 (53.58) | 11.3 | 27.82 | 165. | 73.4 | 1.93 | −0.88 | 1.052(0.325) | |
| 19590−1249 | LS IV −12 111 | (12.36) | Tp | 0.293 | 10.26 | 6.45 | 3.86 | −0.50 | (1.205) | |
| 20000+3239 | GLMP 963 | 53.36 (0.27) | 12.2 | 15.03 | 70.97 | 29.99 | 1.69 | −0.94 | 0.752(0.004) | |
| 20004+2955 | V1027 Cyg | (6.00) | Tp | 31.72 | 36.96 | 4.656 | 0.17 | −2.25 | (0.162) | |
| 20028+3910 | PN PM 2-43 | 88.11 (5.98) | 14.5 | 41.78 | 210.8 | 143.1 | 1.76 | −0.42 | 0.418(0.028) | |
| 20117+1634 | R Sge | (12.00) | Tp | 10.6 | 7.543 | 2.123 | −0.37 | −1.38 | (1.591) | |
| 20343+2625 | V Vul | (3.60) | Tp | 12.35 | 5.688 | 1.294 | −0.84 | −1.61 | (0.633) | |
| 20462+3416 | LS II +34 26 | (10.90) | Tp | 0.287 | 13.68 | 12.12 | 4.20 | −0.13 | (0.797) | |
| 20572+4919 | V2324 Cyg | (10.18) | Tp | 4.335 | 10.97 | 9.696 | 1.01 | −0.13 | (0.928) | |
| 21537+6435 | PN PM 1-334 | (61.88) | Tp | 6.913 | 26.1 | 13.34 | 1.44 | −0.73 | (2.371) | |
| 22023+5249 | GLMP 1051 | (9.60) | Tp | 1.017 | 24.69 | 14.52 | 3.46 | −0.58 | (0.389) | |
| 22223+4327 | V448 Lac | 69.33 | 14.0 | 2.121 | 37.1 | 22.4 | 3.11 | −0.55 | 1.869 | |
| 22272+5435 | HD 235858 | 490.04 (98.40) | 10.1 | 73.88 | 302.4 | 96.59 | 1.53 | −1.24 | 1.621(0.325) | |
| 22327−1731 | HD213985 | (8.40) | Tp | 5.569 | 4.664 | 2.107 | −0.19 | −0.86 | (1.801) | |
| 22574+6609 | 64.29 (2.29) | 19.8 | 9.003 | 29.47 | 20.64 | 1.29 | −0.39 | 2.182(0.078) | ||
| 23304+6147 | PN PM 2-47 | 120.31 (20.61) | 12.1 | 11.36 | 59.07 | 26.6 | 1.79 | −0.87 | 2.037(0.349) | |
| 23321+6545 | PN PM 2-48 | 218.78 (74.04) | 16.1 | 13.66 | 85.61 | 63.96 | 1.99 | −0.32 | 2.556(0.865) | |
| 23541+7031 | PK 118+08.1 | 142.61 | 54.0 | 91.36 | 92.28 | 55.7 | 0.01 | −0.55 | 1.545 | |
| Z02229+6208 | 237.64 | 10.7 |
Notes. The CO 2–1 line quantities are the average values from literature. New observations from this work are not included. a"Tp" means the line area is estimated from line peak temperature and line width and thus is not as reliable as those values directly given in literature.
APPENDIX B: STATISTICAL PROPERTIES OF THE pAGB STAR SAMPLE
Statistical properties of the pAGB star sample are discussed here to assess if any selection effects would have biased the conclusions drawn from the sample. We discuss in this section the completeness of the Torun Catalog of pAGB stars, our compilation of CO 2–1 observations, and the detection rates of CO 2–1 lines among the observed objects.
First of all, the Torun Catalog of pAGB stars was created with various object selection criteria (Szczerba et al. 2007). It is still unknown whether the objects in this catalog are representative of all pAGB stars in the Galaxy. Version 2 of the catalog (Szczerba et al. 2012) is now divided into several sub-catalogs: likely, possible, RV Tau, R CrB/LTP/eHe, and unlikely. Here we plot the histograms of the Galactic position and IRAS 25 μm flux densities of the three most important sub-catalogs: likely, RV Tau and R CrB/LTP/eHe, to check if the catalogs have any obvious bias. As shown in Figure 8, all three sub-catalogs show decreasing trends from Galactic Center (GC) to anti-GC and from Galactic disk to high latitude and from 25 μm-weak to 25 μm-strong objects. Although the detailed comparison of these distributions with that of pAGB star model prediction for the Milky Way Galaxy is beyond the scope of this work, the trends roughly agree with the distribution of Galactic zero age main sequence stars. Thus, it is concluded that no severe bias can be seen in the three sub-catalogs from their Galactic position and IR flux density distributions.
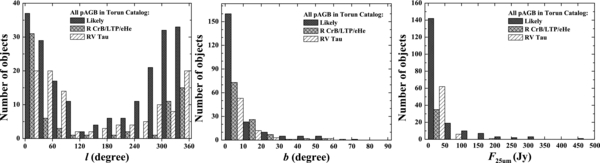
Figure 8. Histograms of the Galactic positions and IRAS 25 μm flux density distributions of the pAGB stars in the Torun Catalog. Only the three most important sub-catalogs: likely, R CrB/LTP/eHe, and RV Tau, are considered.
Download figure:
Standard image High-resolution imageSecond, the pAGB stars with CO 2–1 observations in the literature and in our survey (this work) are compared with all pAGB stars in the Torun Catalog in Figure 9. The left and middle column of panels show that pAGB stars toward the GC and the Galactic disk have the lowest percentage of CO 2–1 observations, while most of the high Galactic latitude pAGB stars have been observed in the CO 2–1 line. In the right column of Figure 9, the CO observations of all three sub-groups of pAGB stars are clearly biased toward IR strong objects. Conversely, the CO observations of the R CrB/LTP/eHe types of pAGB stars in the third row of the figure are the most incomplete, because observers usually do not expect them to show CO line emission.
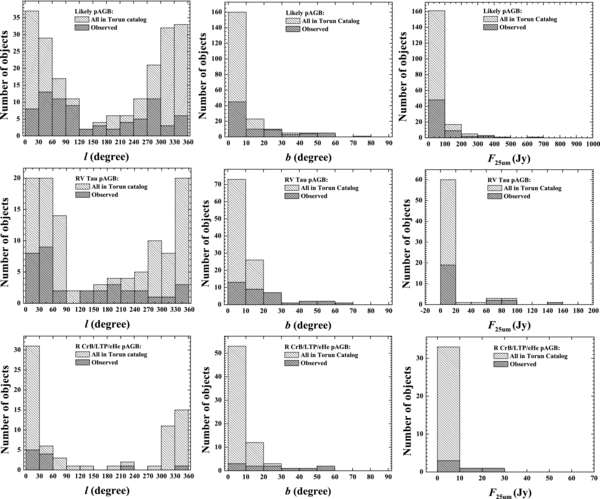
Figure 9. Comparison of the histograms of the pAGB stars observed in CO 2–1 with that of all pAGB stars in the Torun Catalog. Galactic positions and IRAS 25 μm flux density distributions are shown in different columns of panels, while the three most important sub-groups of pAGB stars: likely, R CrB/LTP/eHe, and RV Tau, are shown in different rows of panels.
Download figure:
Standard image High-resolution imageThird, the detection rates of the CO 2–1 line among the "Likely" and RV Tau type pAGB stars are plotted in Figure 10. The R CrB/LTP/eHe type pAGB stars are not shown, because none of them have been detected in CO 2–1. Although there is no obvious trend along the Galactic longitude in the left panel of the figure, one can see in the middle panel that the CO 2–1 line detection rate in the Galactic disk is more than two times higher than at higher Galactic latitudes. This could be due to the higher masses of the pAGB stars in the Galactic disk, because more massive pAGB stars have thicker relic circumstellar envelopes and thus have CO lines that are more easily detected. In the right panel of the figure, there is a clear decreasing trend of CO 2–1 line detection rates toward IR-weaker objects, which indicates that the CO 2–1 line observations are sensitivity limited.
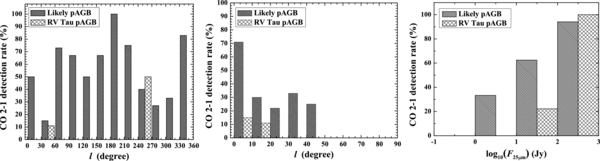
Figure 10. Comparison of the CO 2–1 line detection rates of "Likely" and RV Tau type pAGB stars as a function of Galactic positions and IRAS 25 μm flux densities.
Download figure:
Standard image High-resolution image
In a summary, the major bias effects found in the CO observations of pAGB stars are as follows. (1) pAGB stars in the GC direction are not adequately observed in the CO 2–1 line. (2) The CO line observations in the literature and in our work are biased to IR-strong sources and are sensitivity limited. (3) The CO line observations of R CrB/LTP/eHe type pAGB stars are very incomplete.
APPENDIX C: COMPARING AGB STARS ON THE CO-IR DIAGRAMS
Because this work is concentrated on pAGB stars, we only briefly mention some interesting points about the distribution of AGB stars and PNe on the new CO-IR diagram. Given below are more details not mentioned in Section 5.2.1 of the main text.
C.1. O- and C-rich AGB Stars
Although the majority of the O-rich AGB stars (empty blue circles in the second row of Figure 3) are concentrated in a small region on both the CO-IR and IRAS C–C diagrams, some objects show significantly smaller RCO25 ratios (CO-weak) or significantly redder C23 colors. The redder objects could be either post-thermal pulse objects with detached CSEs (see, e.g., Steffen et al. 1998), OH/IR star candidates, or mis-identified pAGB stars. Many of the CO-weak objects are semi-regular variables of which the CSEs are probably optically thinner and thus CO molecules could have been partially destroyed by photodissociation.
The 28 OH/IR stars (half-shaded black circles) scatter in a larger region with similar or smaller CO-IR flux ratios but redder C12 and C23 colors than the other O-rich AGB stars. This can be explained by cooler CO gas and lower average dust temperatures in the very thick CSEs of the OH/IR stars (Heske et al. 1990; Kastner 1992).
The O-rich AGB stars have slightly bluer C23 colors and about three times smaller RCO25 ratios than the C stars on average. The redder C23 color of C stars was previously determined (e.g., in the study of IRAS C–C diagram by van der Veen & Habing 1988) to be due to the shallower emissivity of carbon-rich dust in the 12–100 μm region (Zuckerman & Dyck 1986b). The stronger CO line in C stars have been recognized since the CO line survey of Nyman et al. (1992). The most possible explanation is higher CO abundance in carbon stars than in O-rich AGB stars, because only part of the oxygen atoms are used to make CO molecules in the latter.
C.2. S Stars Against O- and C-rich AGB Stars
S stars on the RCO25-C23 diagram (red filled circles in the top row of Figure 3) scatter in the similar regions as the C stars, indicating that the gas and dust properties of the CSE of S stars are closer to those of C stars than O-rich AGB stars. However, because S stars are expected to have much less dust in their CSEs due to the lock of most C and O atoms into gaseous CO molecules, their CO-IR flux ratios are intuitively expected to be even larger than that of typical C stars, which is not true in our Figure 3. The lower than expected CO-IR ratios of S stars could be explained by assuming that the CO molecules are not efficiently formed through ideal equilibrium chemistry (as discussed for C stars by Papoular 2008) and by assuming dust grains such as the recently proposed solid SiO dust (Wetzel et al. 2013) may still be efficiently formed around S stars.
Comparing the IRAS C–C diagrams in the upper right and middle right panels of Figure 3, one can see that the S stars also have different IRAS colors than the C- and O-rich AGB stars. Their C12 colors are generally bluer than the latter, while their C23 colors are similar to C stars but redder than O-rich AGB stars. Again, the solid SiO dust proposed by Wetzel et al. (2013) has the potential to naturally explain these color differences. The solid SiO grains have the 10 μm feature as normal silicates, but not the 18 μm feature. Compared with the silicate dust in O-rich AGB stars, the lack of the 18 μm feature of SiO dust in S stars results in a weaker IRAS 25 μm flux density, and thus bluer C12 and redder C23 colors of S stars than O-rich AGB stars, as shown above. Compared with the C-rich dust in C stars, the most salient feature of the SiO dust is the appearance of the emission feature at 10 μm which naturally causes the enhancement of the IRAS 12 μm flux density, and thus bluer C12 and comparable C23 colors of the S stars against C stars.
Footnotes
- *
The observation project was funded by Academia Sinica, Institute of Astronomy and Astrophysics, Taiwan.
- 4
The Torun pAGB star catalog is publicly available at: http://www.ncac.torun.pl/postagb2.
- 5
Frosty Leo stands out with its very red C23 color and very high RCO25 ≈ 60 in the upper left panel of Figure 2. Although the very red C23 color can be partially attributed to its very strong water ice emission band around 46 μm (Forveille et al. 1987), the very large RCO25 ratio requires other mechanisms or a different explanation. This object also has other peculiar properties such as a high initial stellar mass of 4.23 M☉ (Murakawa et al. 2008), a massive compact expanding ring seen in CO 2–1 and 1–0 lines and in near-IR polaro-imaging data (Castro-Carrizo et al. 2005; Dougados et al. 1990) around a binary system (Roddier et al. 1995), and frenzied equatorial jets (Sahai et al. 2000).
- 6
- 7
This object shows the "21 μm" feature, but its RCO25 is uncertain due to interstellar contamination of the CO 2–1 emission (Hrivnak & Bieging 2005).
- 8
As we show in the next subsection this group contains a significant number of known binary systems.