


ABSTRACT
We present the results of a multi-wavelength campaign targeting the blazar 1ES 1218+30.4 with observations with the 1.3 m McGraw-Hill optical telescope, the Rossi X-ray Timing Explorer (RXTE), the Fermi Gamma-Ray Space Telescope, and the Very Energetic Radiation Imaging Telescope Array System (VERITAS). The RXTE and VERITAS observations were spread over a 13 day period and revealed clear evidence for flux variability, and a strong X-ray and γ-ray flare on 2009 February 26 (MJD 54888). The campaign delivered a well-sampled broadband energy spectrum with simultaneous RXTE and VERITAS very high energy (VHE, >100 GeV) observations, as well as contemporaneous optical and Fermi observations. The 1ES 1218+30.4 broadband energy spectrum—the first with simultaneous X-ray and VHE γ-ray energy spectra—is of particular interest as the source is located at a high cosmological redshift for a VHE source (z = 0.182), leading to strong absorption of VHE gamma rays by photons from the optical/infrared extragalactic background light (EBL) via γVHE + γEBL → e+e− pair-creation processes. We model the data with a one-zone synchrotron self-Compton (SSC) emission model and with the extragalactic absorption predicted by several recent EBL models. We find that the observations are consistent with the SSC scenario and all the EBL models considered in this work. We discuss observational and theoretical avenues to improve on the EBL constraints.
Export citation and abstract BibTeX RIS
1. INTRODUCTION
The source 1ES 1218+30.4 is a BL Lac object with a redshift of z = 0.182 (Bade et al. 1998). Observations with the Cherenkov telescopes of the MAGIC and Very Energetic Radiation Imaging Telescope Array System (VERITAS) collaborations performed between 2005 and 2007 established 1ES 1218+30.4 as a source of very high energy (VHE) gamma rays with an energy spectrum compatible with a power law dN/dE∝E−Γ with photon index Γ ∼ 3 (Albert et al. 2006; Acciari et al. 2009). Follow-up observations performed in 2008 and 2009 with VERITAS led to the discovery of significant flux variability (Acciari et al. 2010). Due to its rather high redshift (for VHE γ-ray sources), hard X-ray and VHE spectra, and high X-ray and VHE γ-ray flux levels with detectable flux variations, the source has been a popular target of X-ray and VHE γ-ray observations, and has played an important role in several recent analyses. Sato et al. (2008) and Moraitis & Mastichiadis (2011) used the observations of an X-ray flare of 1ES 1218+30.4 on 2006 May 20 and 21 to constrain the average strength of the magnetic field of the plasma radiating the X-rays as synchrotron emission. Rüger et al. (2010) modeled X-ray and VHE γ-ray energy spectra with a time-dependent synchrotron self-Compton (SSC) model in which the observed radio to X-ray continuum is explained as synchrotron emission and the VHE γ-ray emission is posited to be the inverse-Compton emission from the same electrons responsible for the observed synchrotron emission scattering the synchrotron photons. The strong flare of 1ES 1218+30.4 detected on 2009 January 30 (MJD 54861) excluded an explanation of the VHE emission as the result of inverse-Compton emission of electrons in the kiloparsec-scale jet scattering photons of the cosmic microwave background (Acciari et al. 2010). Taylor et al. (2011) used the combined Fermi and VERITAS observations of 1ES1218+30.4 to set a lower limit on the strength of extragalactic magnetic fields (see also Neronov & Semikoz 2009; Dolag et al. 2011; Dermer et al. 2011; Tavecchio et al. 2011, and references therein for a discussion of this interesting technique).
In this paper, we present the results of a dedicated 1ES1218+30.4 multi-wavelength campaign during February and March 2009. The campaign included for 1ES 1218+30.4 unprecedented coverage in frequency space, including optical, X-ray, high-energy γ-ray, and VHE γ-ray observations. Importantly, we present here for the first time a broadband spectral energy distribution (SED) with simultaneously acquired X-ray and VHE γ-ray observations and contemporaneous optical and high-energy γ-ray (Fermi) observations. The main objectives of this paper are to test the consistency of SSC models and extragalactic extinction models based on current models of the optical to infrared extragalactic background light (EBL) with the observed broadband spectral energy distribution, and to evaluate the possibility of using the observations to evaluate which EBL models are consistent with the data. The EBL originates from both direct and dust-reprocessed starlight and emission from active galactic nuclei (AGNs; see, e.g., Hauser & Dwek 2001; Schirber & Bullock 2003; Kashlinsky 2005; Cooray et al. 2012) and attenuates high-energy photons in γVHE + γEBL → e+e− pair-creation processes (Nikishov 1962; Jelley 1966; Gould & Schréder 1967). Although the absorption of gamma rays by the EBL limits the volume of the universe accessible to γ-ray studies, it also offers possibilities to use absorption features in γ-ray energy spectra to constrain the energy spectrum of the EBL (Stecker et al. 1992). The latter is of considerable interest, as it is difficult to measure the EBL directly owing to foreground radiation (Hauser & Dwek 2001), and EBL measurements can be used to constrain contributions from galaxy clusters (Chelouche et al. 2007), unresolved AGNs (Matute et al. 2006), Population III stars (Santos et al. 2002; Raue et al. 2009; Gilmore 2012b), and more exotic sources, such as massive particle decays after the epoch of recombination.
Various groups have developed techniques to predict the energy spectrum of the EBL on theoretical grounds. The methods used for this purpose include (1) semi-analytical models of the formation and evolution of galaxies and their luminosity forward in time starting from cosmological initial conditions (e.g., Somerville & Primack 1999; Gilmore et al. 2012a), (2) backward evolution of galactic emissivity models (Malkan & Stecker 1998; Stecker et al. 2006; Franceschini et al. 2008), and (3) a combination of information about galaxy evolution and observed properties of galaxy spectra (Kneiske et al. 2002; Finke et al. 2010; Kneiske & Dole 2010; Domínguez et al. 2011). Following the realization that VHE observations can be used to constrain the EBL (Stecker et al. 1992) and the detection of the first extragalactic source at VHE energies (Mrk 421) with the Whipple 10 m telescope (Punch et al. 1992), the derivation of EBL upper limits has received considerable attention. Significant milestones include the limits from VHE observations of Mrk 421 at z = 0.0300 (Stecker & de Jager 1993), from the spectacular 1997 flare of Mrk 501 at z = 0.03364 (Aharonian et al. 1999), from the blazar H 1426+428 at z = 0.129 (Aharonian et al. 2003), and from the more distant blazars 1ES 1101−232 at z = 0.186, H 2356−309 at z = 0.1651 (Aharonian et al. 2006), 1ES 0229+200 at z = 0.1396 (Aharonian et al. 2007), and 3C 279 at z = 0.534 (Albert et al. 2008). Most of the papers cited above derive limits on the EBL by comparing the observed energy spectra with theoretically motivated expectations. Mazin & Raue (2007) and Meyer et al. (2012) consider trial EBL energy spectra and test the consistency of these trial energy spectra with the observed γ-ray energy spectra of a sample of VHE sources. 1ES 1218+30.4 was one of the most important sources of the second study (which altogether used 23 energy spectra from 20 different sources): combining the Fermi and VERITAS energy spectra of this source leads to the exclusion of ∼65% of all 1,920,000 considered EBL trial energy spectra.
More recently, the Fermi and H.E.S.S. collaborations reported positive evidence for EBL absorption. The Fermi collaboration scrutinized the energy spectra of 150 BL-Lac-type γ-ray bright blazars for absorption in the 10–500 GeV energy range (Ackermann et al. 2012). While the combined energy spectrum of the z < 0.2 sources does not show evidence for a high-energy absorption feature, those of the 0.2 < z < 0.5 and 0.5 < z < 1.6 sources do show high-energy cutoffs. The dependence of the high-energy cutoff on redshift is consistent with the expectations from EBL models and inconsistent with a redshift evolution of the sources themselves. The H.E.S.S. collaboration found some evidence for EBL absorption in the energy spectra of seven BL Lac objects (H.E.S.S. Collaboration et al. 2013). The Fermi and H.E.S.S. results rest on assumptions of the inherent (unabsorbed) γ-ray energy spectra. It is highly desirable to cross-check the results based on the analysis of more sources and qualitatively different sources (e.g., test with other types of γ-ray bright AGNs and/or with starburst galaxies).
In this paper, we will follow the approach of Coppi & Aharonian (1999a, 1999b) and Krawczynski et al. (2000, 2002) to test EBL models. These authors proposed using the information from the energy spectrum at energies below the VHE band, and—if available—additional information (e.g., from time resolved observations) to predict the emitted γ-ray energy spectrum. The comparison of the predicted and observed γ-ray energy spectrum can, in principle, be used to infer the extragalactic absorption and thus the EBL. The interested reader can find a similar analysis — based on the analysis of 15 blazars detected with Fermi satellite—in Domínguez et al. (2013).
The rest of the paper is structured as follows. After describing the SSC model and EBL absorption in Section 2, we present the data sets and analysis methods in Section 3. The observational results and the analysis of their consistency with SSC and EBL models will be presented in Section 4. We conclude the paper with a summary and discussion of the results in Section 5.
All errors in the text, tables, and figures are given on 1σ confidence level (including the bow-tie contours that show the results of spectral power-law fits).
2. SYNCHROTRON SELF-COMPTON MODEL AND EXTRAGALACTIC γ-RAY ABSORPTION
We model the emission with the phenomenological SSC code described by Krawczynski et al. (2004). The code assumes a spherical emission volume of radius R moving such that the relativistic jet Doppler factor is δj. The jet Doppler factor is defined as  with Γj being the bulk Lorentz factor of the emitting plasma, β its bulk velocity in units of the speed of light, and θ the angle between the jet axis and the line of sight as measured in the observer frame. The volume is uniformly filled with a tangled magnetic field of co-moving strength B, and an isotropic population of non-thermal electrons. The differential electron distribution is described by a broken power law with a low-energy (high-energy) differential electron number index p1 (p2) from Emin to Eb (Eb to Emax). The code calculates the synchrotron and SSC emission. It accounts for the effects of synchrotron self-absorption and γ-γ-absorption inside the source and for the cosmological redshift.
We use the EBL models of Stecker et al. (2006), Franceschini et al. (2008), Kneiske & Dole (2010), and Domínguez et al. (2011) in this study. The absorbed differential VHE spectrum dN/dε at observed energy ε is then given by
where dN0/dε is the energy spectrum that would be observed without absorption, τγ is the optical depth due to pair-creation processes on the EBL, and z is the redshift of the source. The expression for the optical depth reads (Gould & Schréder 1967):
The first integral runs over the redshift and dl is the proper distance corresponding to the redshift interval dz. The second integral runs over the cosine of the pitch angle μ, and the third runs over the target photon energies. The threshold energy of target photons is
where me and c denote the electron mass and the speed of light, respectively. The expression nγ(ε', z) is the EBL photon density at energy ε' at redshift z. The pair-creation cross section is:
with  .
.
Figure 1 presents the optical depth for the EBL models used in this paper. The models of Franceschini et al. (2008), Kneiske & Dole (2010), and Domínguez et al. (2011) predict very similar optical depths. Only the model of Stecker et al. (2006) deviates strongly, predicting less absorption below 150 GeV and above 8 TeV and more absorption between 150 GeV and 8 TeV. The optical depths can be understood by noting that most of the absorption of VHE gamma rays of energy ε comes from a narrow EBL region around the wavelength

The low absorption of the model of Stecker et al. (2006) below 150 GeV and above 8 TeV thus comes from the low intensity of their EBL model below ∼200 nm and above ∼10 μm, respectively.

Figure 1. Optical depth τγ(ε, z = 0.182) for VHE gamma rays coming from 1ES 1218+30.4 as function of the observed energy of the gamma rays ε for the four different EBL models utilized in this study.
Download figure:
Standard image High-resolution image3. DATA SETS AND ANALYSIS METHODS
3.1. Optical Observations
1ES 1218+30.4 was observed in the optical UBVRI bands at the 1.3 m McGraw-Hill Telescope at the MDM Observatory on the southwest ridge of Kitt Peak, Arizona, during the periods 2009 February 19–24, and May 14–18. Exposure times ranged between 60 and 120 s, depending on filter. Raw frames were reduced using standard routines in IRAF, and instrumental magnitudes of 1ES 1218+30.4 and comparison stars A and B of Smith et al. (1991) were extracted using the "phot" routine of the DAOPHOT package in IRAF. Physical UBVRI magnitudes were calculated by comparison with the calibrated magnitudes of the two comparison stars. For the purpose of calculating fluxes, the measured magnitudes were corrected for Galactic extinction using the extinction coefficients as given by the NASA/IPAC Extragalactic Database. The observations did not allow us to identify and subtract out the light from the host galaxy of the blazar.
3.2. X-Ray Observations
The X-ray analysis is based on data from the proportional counter array (PCA) (Jahoda et al. 1996) on board the Rossi X-ray Timing Explorer (RXTE) satellite taken in the framework of a VERITAS-led target of opportunity observation proposal. The PCA comprises an array of proportional counter units (PCUs) covering a nominal energy range of 2–60 keV. Data between the energies of 3 keV and 15 keV were used in this analysis. We discard the 2–3 keV data on account of relatively large systematic uncertainties of the detector response function in this energy range. We also do not use the >15 keV data from the PCA, nor the hard X-ray data from the High-Energy X-ray Timing Experiment (Rothschild et al. 1998) owing to the poor signal-to-noise-ratio. The PCA data were taken as part of a multi-wavelength observation proposal and comprise 23 exposures between 2009 February and 2009 March with a total net exposure time of 50.42 ks. The observations had a typical exposure of 10–70 minutes per pointing and—weather permitting—were accompanied with VERITAS VHE γ-ray observations. The data were filtered following the standard criteria advised by the NASA Guest Observer Facility (GOF). Standard-2 mode PCA data gathered with the top layer (X1L and X1R) of the operational PCUs were analyzed using the HEAsoft 6.5 package. Background models were generated with the tool pcarsp, based on the RXTE GOF calibration files for a "faint" source with less than 40 counts s−1. Response matrices for the PCA data were created with the script pcarsp. The saextrct tool was used to extract all PCA energy spectra. The analysis used a neutral hydrogen column density of 1.94× 1020 cm−2 from the weighted average of the Leiden/Argentine/Bonn Survey of Galactic H i (Kalberla et al. 2005).
3.3. High-energy Gamma-Ray Observations
The Large Area Telescope (LAT) aboard the Fermi satellite is a pair-conversion γ-ray detector sensitive to photons in the energy range from 20 MeV to 300 GeV (Atwood et al. 2009). The Fermi satellite started taking scientific data on 2008 August 4. The following analysis uses the published results from the Fermi LAT first source catalog (Abdo et al. 2010) based on the data from the first 11 months of the science phase of the mission.
3.4. Very High Energy Gamma-Ray Observations
The VERITAS array (Weekes et al. 2002) of imaging atmospheric Cherenkov telescopes is located in southern Arizona (1270 m.a.s.l., 31°40'30"N, 110°57'07"W) and began regular observations with the four-telescope array in 2007 September (Maier et al. 2007). The array is composed of 4 12 m diameter telescopes, each with a Davies–Cotton tessellated mirror structure of 345 hexagonal mirror facets (12 m focal length) giving a total mirror area of 110 m2 per telescope. Each telescope focuses Cherenkov light from particle showers onto its 499 pixel photomultiplier camera. Each pixel has a field of view of 0 15, resulting in a camera field of view of 35. VERITAS has the capability to detect and measure gamma rays in the ∼100 GeV to ∼30 TeV energy regime with an energy resolution of 15–20% and an angular resolution of 01 on an event-by-event basis.
The VERITAS collaboration planned to complement the RXTE observations with simultaneous VERITAS gamma-ray observations. Unfortunately, the weather was rather poor, and VERITAS could only observe 1ES 1218+30.4 8 out of 20 nights with RXTE coverage. After applying quality-selection criteria, the total VERITAS exposure is 4.8 hr live-time. Data-quality selection requires clear atmospheric conditions, based on infrared sky temperature measurements, and normal hardware operation.
All data were taken during moon-less periods with the center of the camera pointing 05 north, south, east, or west from 1ES 1218+30.4 to enable the simultaneous acquisition of source and background data (Aharonian et al. 2001). The data reduction follows the methods described by Acciari et al. (2008). Signals in each event are first calibrated (Holder et al. 2006), and the images are then parameterized (Hillas 1985).
The γ-ray direction and air shower impact parameter on the ground are then reconstructed using stereoscopic techniques (Hofmann et al. 1999; Krawczynski et al. 2006). The background of cosmic rays is rejected with a very high efficiency using event-by-event cuts on the arrival direction (θ2), mean scaled width and length, integrated charge (size), and location of the image centroids in the camera (distance). The "medium cuts" applied here are optimized a priori for a source strength of 10% of the Crab Nebula flux and a similar photon index to the Crab Nebula. The energy of each event is reconstructed using lookup tables from Monte Carlo simulations of gamma rays (Acciari et al. 2008). An independent VERITAS analysis package (Daniel 2007) yields results that are consistent with those presented here. Using on–off regions with an area ratio of 0.125, the source 1ES 1218+30.4 was detected with a significance level of 11.1 standard deviations (σ) in the entire data set. Using this entire VERITAS data set, we derive an average photon index of Γ = 3.15 ± 0.23 (see Figure 2). The VERITAS flux data points are given in Table 1.
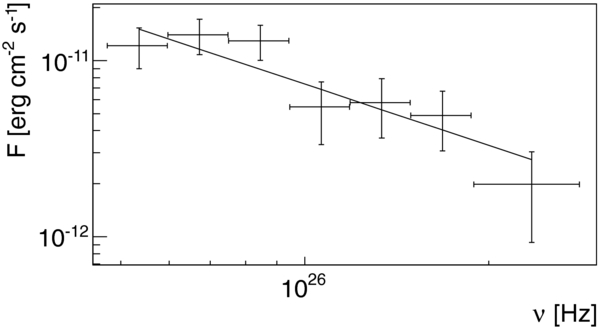
Figure 2. Gamma-ray energy spectrum of 1ES1218+30.4 measured with VERITAS during the observation campaign. The 1 TeV energy flux is (2.6 ± 0.7)× 10−12 erg cm−2 s−1 and the photon index is Γ = 3.15 ± 0.23.
Download figure:
Standard image High-resolution imageTable 1. VERITAS Time-averaged Energy Spectrum of 1ES 1218+30.4
| Frequency | νFν–Fluxa |
|---|---|
| (Hz) | (10−12 erg cm−2 s−1) |
| 5.36 × 1025 | 12.2 ± 3.1 |
| 6.72 × 1025 | 14.0 ± 3.2 |
| 8.46 × 1025 | 13.0 ± 2.9 |
| 1.06 × 1026 | 5.5 ± 2.1 |
| 1.34 × 1026 | 5.8 ± 2.1 |
| 1.68 × 1026 | 4.9 ± 1.8 |
| 2.35 × 1026 | 2.0 ± 1.1 |
Note. a Errors are given on 1σ confidence level.
Download table as: ASCIITypeset image
Table 2. Parameters of the Reference SSC Model
| δj | B | R | Emin | Eb | Emax | p1 | p2 |  |
Lj, min |
|---|---|---|---|---|---|---|---|---|---|
| (G) | (cm) | (eV) | (eV) | (eV) | (CGS) | (CGS) | |||
| 38 | 0.0145 | 2.87 × 10¹⁶ | 511× 103 | 100× 109 | 1.26× 10¹² | 1.9 | 3.36 | 0.0025 | 2 × 1044 |
Download table as: ASCIITypeset image
4. RESULTS
Figure 3 shows the X-ray fluxes, γ-ray fluxes, and X-ray photon indices measured during the campaign. The excellent signal-to-noise-ratio of the X-ray observations reveals a steadily changing flux level on top of a steady increase and decrease of the flux before and after the strong flare on 2009 February 26 (MJD 54888), respectively. At VHE energies the signal-to-noise-ratio is not good enough to detect flux changes other than the strong flare on 2009 February 26 during which the flux clearly exceeded the mean flux level measured before and after the flare. The X-ray photon indices show a trend of hardening at higher flux levels.

Figure 3. Top panel shows the >200 GeV γ-ray light curve measured with VERITAS, and the middle panel shows the 2 keV–10 keV X-ray light curve measured with RXTE. The filled circles in the X-ray light curve highlight the RXTE observations which were simultaneously taken with the VERITAS observations. The lower panel shows the X-ray photon indices from fitting a power-law model to the 2–10 keV data as a function of time. Note that the error bars on the RXTE fluxes are smaller than the symbols.
Download figure:
Standard image High-resolution imageThe left panel of Figure 4 shows the X-ray photon indices plotted versus the X-ray flux and demonstrates that low (high) flux levels are associated with soft (hard) energy spectra. The right panel of the same figure plots the VHE γ-ray fluxes versus the X-ray fluxes and shows that the evidence for an X-ray/VHE γ-ray flux correlation only comes from the detection of the flare on 2009 February 26.

Figure 4. Left panel shows the 2–10 keV photon power-law index vs. the 2–10 keV flux for the entire set of RXTE observations. The right panel shows the 2–10 keV fluxes vs. the >200 GeV γ-ray fluxes measured with VERITAS for all simultaneous RXTE/VERITAS observations.
Download figure:
Standard image High-resolution imageThe X-ray photon index exhibited values between Γ ≈ 2 and Γ ≈ 2.5 during the campaign. We infer that the spectral index of the segment of the electron energy spectrum responsible for the X-rays exhibited values between p ≈ 3 and p ≈ 4 (Ginzburg & Syrovatskii 1965). The spectral variability can be explained by a time-dependent high-energy cutoff of accelerated electrons (see the related discussions by Krawczynski et al. 2002; Garson et al. 2010). Note that diffusive particle acceleration at mildly relativistic superluminal shocks can produce soft electron energy spectra with p ≈ 3 (see Baring & Summerlin 2009) that can soften to p ≈ 4 owing to radiative cooling (Kardashev 1962). However, time-dependent SSC simulations show that this scenario predicts only rather small photon index changes on the order of ΔΓ ∼ 0.1 (Krawczynski et al. 2002).
We explored the timescales of X-ray flux variability by calculating the e-folding times t0 from adjacent X-ray flux data points (t0 = (t2 − t1)/(ln (f2) − ln (f1)) with t1, t2, and f1, f2 the times and fluxes of the two measurements, respectively). The shortest e-folding times are about ∼2 days (Figure 5), indicating that the emission region has a spatial extent smaller than δj c ×2 days.
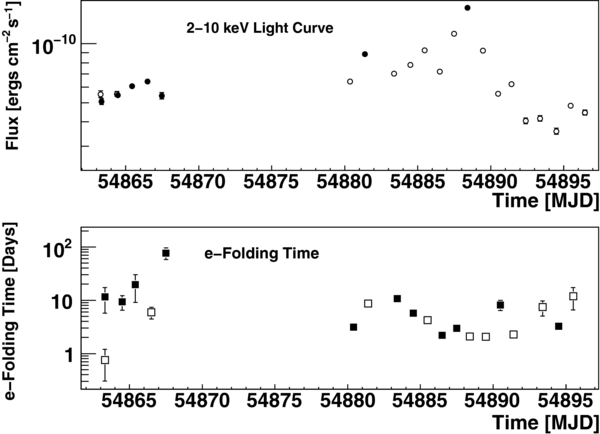
Figure 5. Top panel shows the 2–10 keV X-ray light curve for reference (same symbols as in Figure 3). Solid markers highlight X-ray observations simultaneous with TeV observations. The bottom panel presents the e-folding times t0 determined from successive pairs of RXTE measurements (t0 = (t2 − t1)/(ln (f2) − ln (f1)) with t1, t2, and f1, f2 the times and fluxes of the two measurements, respectively). We only show data points with 1σ errors smaller than the value of the data points. The solid (open) markers show positive (negative) e-folding times. We plotted the rise or decay time at the time of the first flux measurement. For days with more than one RXTE pointing, each successive pair of measurements gives one e-folding time t0.
Download figure:
Standard image High-resolution imageWe present the broadband SED measured during the campaign in Figure 6. Only the X-ray data taken contemporaneously with VHE observations (filled dots in Figure 3) entered the X-ray energy spectrum. The Fermi LAT spectrum was derived from the first 11 months of the Fermi science operations which included the time of the campaign described in this paper. We justify the use of the spectrum here by the absence of detectable flux and spectral variability of 1ES 1218+30.4 in the Fermi LAT data (Abdo et al. 2010). Note that the optical and X-ray observations constrain the low-energy (presumably synchrotron) emission component and the Fermi LAT and VERITAS γ-ray observations constrain the high-energy (presumably SSC) emission component.
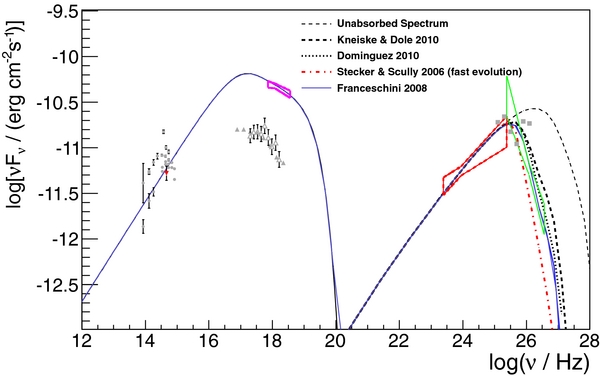
Figure 6. Broadband spectral energy distribution of 1ES 1218+30.4 with the optical (red inverted triangle), X-ray (RXTE, magenta bow-tie), high-energy γ-ray (Fermi LAT, red bow-tie), and VHE γ-ray (VERITAS, green bow-tie) data from the observation campaign described in this paper. The gray data points show archival data from Sato et al. (2008 and references therein). The lines show the results of an SSC model without extragalactic absorption (blue line at low energies and dashed thin black line at high energies), and with the extragalactic absorption predicted by the EBL models of Kneiske & Dole (2010; dashed thick black line), Domínguez et al. (2011; dotted black line), Franceschini et al. (2008; solid blue line), and Stecker et al. (2006; dash-dotted red line). The SSC model parameters are given in Table 2.
Download figure:
Standard image High-resolution imageFigure 6 shows also a theoretical model of the SED (see Table 2 for a compilation of the model parameters). We model the data with a SSC model with a jet Doppler factor of δj = 38, a magnetic field B = 0.0145 G, and a radius R = 2.87 × 1016 cm of the emission region. The electron energy spectrum follows a power law with a differential electron number index p1 = 1.9 ( ) from Emin = 511 keV to Eb = 100 GeV, and p2 = 3.36 from Eb to Emax = 1.26 TeV. The electron (and possibly also positron) energy density is
  erg cm−3, and the ratio of magnetic field energy density uB = B2/8π to electron (and possibly positron) energy density is 3× 10⁻³. The minimum jet luminosity
  is 2 × 1044 erg s−1. The optical and X-ray data and our model imply a break of the electron spectrum by Δp = p2 − p1 ≈ 1.46, larger than Δp ≈ 1 expected from radiative cooling in the synchrotron and inverse-Compton regimes. The result indicates that the acceleration mechanism contributes to this spectral break (see also Garson et al. 2010). The observer-frame light crossing time (1 + z)R/(cδj) ≈ 8 hr is comparable to the shortest observed e-folding time of 1.7 days. The observer-frame synchrotron cooling time of the electrons with E = Eb is given by the expression

with σT being the Thomson cross section. The cooling time of ts ≈ 2.6 minutes indicates very efficient radiative cooling of the electrons.
The comparison of the observed and predicted γ-ray energy spectra can be used to test models of the extragalactic extinction. However, one must be aware of the fact that the SSC model predicts the shape of the γ-ray energy spectrum, but not the absolute flux level. The latter can be changed over very wide margins by increasing or reducing the radius of the emission region (which is poorly constrained observationally) by rather small amounts while adjusting the density of emitting electrons to assure that the model fits the radio to X-ray data (see Krawczynski et al. 2000).
When accounting for this indeterminacy, we find that all the EBL models considered in this paper are consistent with the data. This is exemplified in Figures 6 and 7. We normalized the data and all the models in Figure 7 to the same value at 1 TeV to account for the aforementioned fact that the SSC model does not predict the absolute flux level. For the reference SSC model (Figures 6 and 7, upper panel), the predicted γ-ray energy spectrum is too steep when the EBL model of Stecker et al. (2006) is adopted. However, the apparent discrepancy can be reduced by adjusting some of the SSC model parameters that impact the shape of the predicted energy spectrum. The ratio of the peak energies of the unabsorbed synchrotron and inverse-Compton SEDs scales approximately as δj/B (Krawczynski et al. 2000). Choosing a stronger magnetic field and/or a smaller Doppler factor and adjusting the parameters of the electron spectrum to recover a good model of the optical to X-ray data leads to a softer γ-ray energy spectrum. Jet Doppler factors are generally believed to be smaller than ∼50 (e.g., Ajello et al. 2012). However, mini-jets in a jet could lead to very large Doppler factors while not conflicting with the observed numbers of VHE bright blazars (Giannios et al. 2009). Furthermore, the magnetic field should not be much weaker than the fiducial value of 0.0145 G as the radiative cooling efficiency drops drastically otherwise (see Equation (6)). The center and lower panels of Figure 7 show that a factor of two larger Doppler factor or a factor of four weaker magnetic field does result in a softer γ-ray energy spectrum. However, the impact on the predicted γ-ray energy spectrum is small.

Figure 7. Agreement between various SSC+EBL models and the VERITAS VHE data. In each panel, we adjusted the parameters to normalize all the models to the VERITAS 1 TeV flux (the normalization of the SSC model can be adjusted by choosing appropriate combinations of the normalization of the electron density in the emitting volume and the radius of the emission volume). The upper left panel uses the same model parameters as Figure 6 (i.e., δj = 38, B = 0.0145 G) and shows a good agreement of the models and the data—except for the EBL model of Stecker et al. (2006) which seems to predict a γ-ray energy spectrum that is too soft. The upper right panel and the lower panel show that the SSC model parameters can be adjusted to predict somewhat softer energy spectra (middle panel: δj = 76, B = 0.0145 G; lower panel: δj = 38, B = 0.0036 G).
Download figure:
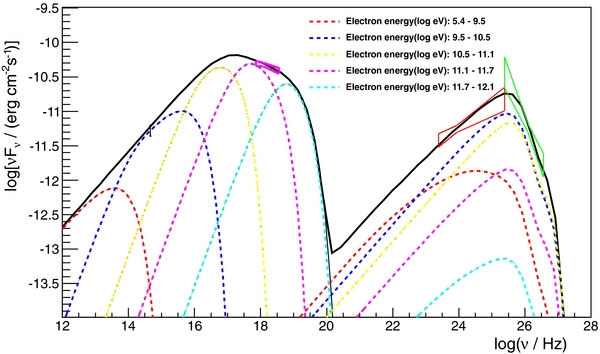
Standard image High-resolution imageIn the SSC model, the same electrons produce synchrotron and inverse-Compton emission. Figure 8 shows the synchrotron and inverse-Compton emission from different sections of the electron energy spectrum (same model parameters as in Figures 6 and 7, upper panel). The gamma rays observed by the Fermi LAT and VERITAS are mostly up-scattered by electrons that produce synchrotron emission in the IR to soft X-ray bands.
Figure 8. Data point and bow-ties show the energy spectra from the observation campaign described in this paper (the same as in Figure 6). The thick black line shows the SSC model with the EBL model of Franceschini et al. (2008). In the case of the low-energy (synchrotron) component, the dashed lines show the synchrotron emission produced by different sections of the electron energy spectrum. In the case of the high-energy (SSC) component, the dashed lines show the inverse-Compton emission produced by the same sections of the electron energy spectrum up-scattering the synchrotron emission produced by all electrons. All inverse-Compton spectra are shown for the EBL absorption predicted by Franceschini et al. (2008). The results show that the inverse-Compton emission in the Fermi LAT and VERITAS bands is produced by electrons up-scattering synchrotron emission in the IR to soft X-ray bands.
Download figure:
Standard image High-resolution image
Rüger et al. (2010) modeled X-ray and VHE γ-ray observations of 1ES 1218+30.4 with a time-dependent synchrotron SSC code. Their model of the broadband SED gives a magnetic field of B = 0.04 G for a Doppler factor of δj = 80. Our analysis results should be more reliable as they are based on a more tightly constrained SED.
5. SUMMARY AND DISCUSSION
In this paper, we present a two-week multi-wavelength observation campaign of the BL Lac object 1ES 1218+30.4. The observations reveal continuous X-ray flux variability on ∼day timescales, and evidence for an X-ray and VHE γ-ray flare on 2009 February 26 (MJD 54888). Our analysis shows that the data are consistent with the SSC scenario and with the considered EBL models. The model of Stecker et al. (2006) requires some fine tuning, but cannot be excluded. The results are consistent with those recently published by the Fermi and H.E.S.S. collaborations (Ackermann et al. 2012; H.E.S.S. Collaboration et al. 2013). In particular, the Fermi detection of EBL absorption is consistent with the models of Franceschini et al. (2008); Kneiske & Dole (2010); Domínguez et al. (2011). The H.E.S.S. collaboration showed that their detection is consistent with the model of Franceschini et al. (2008).
Our SSC modeling shows that the VERITAS γ-ray energy spectrum can be predicted based on the observations of the synchrotron emission in the IR to soft X-ray bands. The sensitivity of the EBL test presented in this paper is largely limited by the following. (1) The incomplete sampling of the synchrotron emission, in particular in the UV and soft-X-ray bands. (2) The statistical errors on the γ-ray energy spectra, and (3) the uncertainties of the SSC model parameters. Contemporaneous soft X-ray observations (e.g., with the Swift X-ray telescope) could be used to constrain the SED more tightly. Gamma-ray observations with better sensitivity and/or of brighter flares would reduce the statistical errors on the γ-ray energy spectra. Various methods can be used to constrain the SSC model parameters better. Coppi & Aharonian (1999a, 1999b); Krawczynski et al. (2002) proposed to combine time-resolved observations with time-dependent SSC modeling to this end. Unfortunately, snapshot observations like the ones presented in this paper are not well suited to carry out such a program. Long observations with dense sampling are better suited because (1) individual flares can be identified, and (2) the rising and falling edges of the flares give information about the particle acceleration and radiative cooling mechanisms. The latter make it possible to infer additional information about the jet magnetic field. Suitable observations have already been taken on 1ES1218+30.4 by Sato et al. (2008). The team used the Suzaku X-ray satellite for an almost two-day long observation of 1ES 1218+30.4 on 2006 May 20 and 21. The observations revealed a flare with good coverage of the rising and falling portions. Interpreting the hard-soft lag as a consequence of radiative cooling, the authors estimate a magnetic field strength of B ∼ 0.047 G for an assumed jet Doppler factor of δj = 20. Moraitis & Mastichiadis (2011) performed a more detailed analysis of the same data with a time-dependent two-zone particle acceleration and synchrotron emission model and inferred a similar magnetic field of B ∼ 0.06 (δj/10)−1/3 G. Such a strong magnetic field in the radiation zones responsible for the emission studied in this paper would strongly favor low-intensity EBL models like the model of Kneiske & Dole (2010) over high-intensity models like the model of Stecker et al. (2006).
This research is supported by grants from the U.S. Department of Energy Office of Science, the U.S. National Science Foundation, and the Smithsonian Institution, by NSERC in Canada, by Science Foundation Ireland (SFI 10/RFP/AST2748), and by STFC in the U.K. We acknowledge the excellent work of the technical support staff at the Fred Lawrence Whipple Observatory and at the collaborating institutions in the construction and operation of the instrument.