


ABSTRACT
The fast transitions of type-B and type-A quasi-periodic oscillations (QPOs) are rarely found, and they are observed at the peak of the outburst in black hole transient (BHT) sources. The associated spectral variations during such events are crucial to understand the origin and location of such QPOs in the accretion disk. During the 1999 outburst of XTE J1859+226, on four occasions a rapid transition of type-B/A QPOs was noted. We performed broadband spectral analysis on these four observations to unveil the responsible spectral parameter causing the rapid transitions. After invoking simple spectral models, it was observed that disk parameters were consistently varying along with disk and power-law fluxes, and almost no change was noted in the power-law index parameter. Though using a complex physical model showed consistent results, the spectral parameter variations across the transitions were not significant. It was observed that the type-B QPO was always associated with an inner disk front which is closer to the BH. In one observation, a type-A QPO appeared as the source count rate suddenly dropped, and the power-law index as well as disk normalization parameter considerably changed during this transition. The spectral changes in this particular observation were similar to the changes observed in XTE J1817-330, indicating a common underlying mechanism. We have also examined a similar observation of BHT source GX 339-4, where a sudden transition of a type-A/B QPO was noted. Similar spectral study again revealed that the disk parameters were changing. We discuss the results in the framework of a truncated disk model and conclude that the movement of the coupled inner disk-corona region is responsible for such rapid transitions of type-B QPOs.
Export citation and abstract BibTeX RIS
1. INTRODUCTION
The low-frequency quasi-periodic oscillations (LFQPOs) in black hole X-ray binaries (BHXBs) are a characteristic property whose origin is still not properly understood (see van der Klis 2004). In general, most LFQPOs start at a few millihertz during the onset of an outburst and reach to ∼10 Hz at the peak of the outburst. The enormous and pivotal observations made with the Rossi X-ray Timing Explorer (RXTE) have given an inconceivable understanding of BHXBs explicitly in the temporal domain. The study of spectral and timing properties of these sources shows that LFQPOs and the associated spectral properties are closely related to each other and form the basis of the three state classifications, namely, low-hard (LH) state, steep power-law (SPL) state, and high-soft (HS) state (McClintock & Remillard 2004; Remillard & McClintock 2006). Later an elaborate study of a hardness intensity diagram (HID) clearly showed that these sources follow a "q"-shaped pattern (during a complete outburst) across which the spectral and timing properties systematically vary (Homan & Belloni 2005; Belloni et al. 2005, 2011; Belloni 2010). In the HID scheme of classification, the complex SPL state was further classified into two other states, namely, hard-intermediate state (HIMS) and soft-intermediate state (SIMS).
The first scheme of classification for LFQPOs, called type-A, B, and C, was made for the BH source XTE J1550-564 (Wijnands et al. 1999; Homan et al. 2001; Remillard et al. 2002) and was later established by Casella et al. (2005) based on the QPO properties of two other BH sources, GX 339-4 and XTE J1859+226. It is observed that as the sources traverse from HIMS to SIMS, the type-C QPO often changes to type-B and then to type-A (Belloni 2010; Motta et al. 2011). Rapid shifting from type-B to type-A or type-B to type-C was observed in GRS 1915+105 as it moved from SIMS to HIMS (Soleri et al. 2008). In the case of GX 339-4, a low-frequency type-B QPO was found to be associated with a low power-law index as the source traverses from soft to hard state of SIMS (Stiele et al. 2011). It is observed that type-C to B transitions are more frequent than type-A to B, and the reversed transitions are often observed at the peak of the outburst (Motta et al. 2011). They have also shown that type-B QPOs were found to be at lower frequency and spread over a limited frequency domain (∼5–7 Hz) when compared to the type-C/A QPOs, and type-B QPO observations follow a different pattern in the QPO frequency versus hard flux plane (Motta et al. 2011). The HIMS to SIMS transition is considered to be associated with the onset of jets as the jet-line falls across the transition (Fender et al. 2004, 2009; Migliari & Fender 2006). The context of emission and collimation of jets were discussed to explain the fast transitions of type-B to A and type-B to C QPOs in GRS 1915+105 (Soleri et al. 2008). These studies indicate that the changeover of different types of QPOs is linked with the hard X-ray emitting region in the accretion disk, close to the BH.
Rapid transitions among different (type-C, B, and A) QPOs or a sudden appearance of a type-A QPO are rare events. Miyamoto et al. (1991) reported such sudden flip-flops in GX 339-4 using Ginga observations and elaborately reported by Motta et al. (2011) based on RXTE data. Similar rapid transitions were seen in GS 1124–68 (Takizawa et al. 1997), and Wijnands et al. (2001) reported a sudden appearance of a 5 Hz QPO in GRS 1739–278. The variations in the disk and power-law flux were noted during a transient type-B 6 Hz QPO in GX 339-4 (Nespoli et al. 2003). Sriram et al. (2012) reported a fast transition of a ∼6 Hz type-B QPO in another BH source XTE 1817-330 and found it to be associated with a change in the power-law index.
XTE J1859+226 was discovered on 1999 October 9 by the All-Sky Monitor on board RXTE (Wood et al. 1999), which is located at a distance of ∼11 kpc (Zurita et al. 2002). It was also detected in the radio band (Pooley & Hjellming 1999), and a radio–X-ray correlation was observed (Brocksopp et al. 2002). The source was also detected in γ-ray band (McCollough & Wilson 1999; dal Fiume et al. 1999). Soon after its discovery, a 15th magnitude optical counterpart was identified (Garnavich et al. 1999). The optical spectrum revealed weak emission lines at Hα, Hβ, He ii λ4686, and C iii/N iii λλ4640–4650 over the strong blue continuum, a common observed feature in BH X-ray transients during an outburst (Garnavich et al. 1999; Wagner et al. 1999). A broad range of orbital periods (6.7–18.7 hr) were reported (Uemura et al. 1999; Garnavich et al. 1999; McClintock et al. 2000; Zurita et al. 2002). Based on radial velocity measurements, Filippenko & Chornock (2001) reported an orbital period of 11.2 hr and a mass function f(M) = 7.4 ± 1.1 M☉, known to be the highest among BH binaries. A more recent optical photometry and spectroscopy observations revealed an orbital period of 6.58 ± 0.05 hr, a mass function f(M) = 4.5 ± 0.6 M☉, and an upper limit of inclination of i = 70° (Corral-Santana et al. 2011).
XTE J1859+226 shows both low- and high-frequency QPOs (Markwardt et al. 1999; Cui et al. 2000), and a detailed study of the evolution of power density spectrum (PDS) was reported by Casella et al. (2004). Rapid transitions among different types of QPOs were observed in a few observations along with the presence of Cathedral QPOs in one particular observation (Rodriguez & Varniere 2011). Such transitions are a rare event, and understanding the astrophysics of the accretion disk during such transitions is important to know the underlying scenario of its production and evolution. In-depth spectral studies were performed for two such events in two transient BH sources, namely, GX 339-4 (Nespoli et al. 2003) and XTE J1817-330 (Sriram et al. 2012). In this work, we present the results of the broadband X-ray spectroscopy during such rapid transitions in the BH source XTE J1859+226 and make a detailed comparison with the spectral results obtained for GX 339-4 and XTE J1817-330.
2. DATA REDUCTION AND ANALYSIS
We analyzed four observations obtained by the RXTE satellite (Bradt et al. 1993). Casella et al. (2004) have presented an extensive timing analysis of the source XTE J1859+226. In three observations, rapid transitions of QPO properties were reported which always involved a type-B QPO. In another observation (ObsID 40124-01-38-01), a sudden dip was observed during which the power density spectrum was found to be varying. We have made a detailed spectral study of these four observations, and the details of the observations or sections are listed in Table 1 and shown in Figure 1. The data reduction and analysis were made using HEASOFT v6.8. We used the single bit data having a time resolution of 1/1024 s to obtain the PDS in the energy band 2–15 keV (0–35). For spectral analysis, proportional counter array (PCA; Jahoda et al. 2006) PCU2 unit data were used (3–25 keV) and 0.5% systematic errors were added to the spectra. We also used HEXTE (High-Energy X-ray Timing Experiment; Rothschild et al. 1995) cluster A data to obtain the 15–150 keV energy band spectrum. The hxtback command was used to extract the source and background data. The spectra were obtained using a rocking interval of 32 s, and dead-time corrections were applied using the command hxtdead (see, e.g., Sriram et al. 2007). The spectra were unfolded using the various spectral models available in XSPEC v12.7.1 (Arnaud 1996).
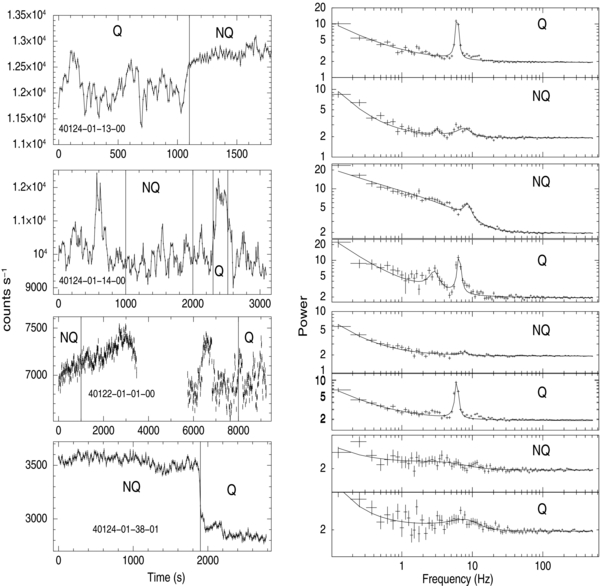
Figure 1. Left panels: the 2–15 keV light curves are shown for the four observations. The vertical lines separate out the sections (Q, type-B QPO and NQ, without type-B QPO) used for obtaining the PDS and spectra. Right panels: the corresponding PDSs for the section Q and NQ of each observation. In the last panels (ObsID 40124-01-38-01), NQ corresponds to no-QPO and Q represents type-A QPO. The solid lines represent the best-fit model power-law+Lorentzian+const.
Download figure:
Standard image High-resolution imageTable 1. Observations Analyzed for the Source XTE J1859+226
| ObsID | MJD (Date) | Duration (s) | ||
|---|---|---|---|---|
| Total Observation | Section Q | Section NQ | ||
| 40124-01-13-00 | 51467 (1999 Oct 16) | 1810 | 1100 | 710 |
| 40124-01-14-00 | 51468 (1999 Oct 17) | 3100 | 180 | 1000 |
| 40122-01-01-00 | 51469 (1999 Oct 18) | 9200 | 1000 | 1000 |
| 40124-01-38-01 | 51485 (1999 Nov 3) | 2800 | 900 | 1900 |
Download table as: ASCIITypeset image
2.1. Temporal Analysis
Casella et al. (2004) studied the timing behavior of the source XTE J1859+226 and found three interesting observations during which rapid variations in PDS were observed. They presented the dynamic PDS for the respective observations and noted that a type-B ∼6 Hz QPO was always involved. Figure 1 shows the X-ray light curves (2–15 keV, left panels) and corresponding PDSs (right panels) for the marked sections (Q, type-B QPO and NQ, non type-B QPO) of the light curves. To fit the PDS, a model consisting of power-law + Lorentzian + constant was used along with another Lorentzian component if it was necessary. In the first observation, a type-B QPO at 6 Hz varied to a type-A QPO at 8.5 Hz in a few seconds, whereas in the second observation, a type-C QPO at ∼8.5 Hz (section Q) transformed to a type-B QPO at ∼6.5 Hz along with a sub-harmonic at ∼3 Hz (similar to the results obtained by Casella et al. 2004). In the third observation, a type-A QPO at 7.6 Hz was converted into a type-B QPO at ∼6 Hz. In the fourth observation, at a high count rate (section NQ), no QPO was detected, but as the source count rate decreases (section Q) in a few tens of seconds, a weak type-A QPO at 7.6 Hz with an rms of ∼4.2% appeared with a significance of 2σ and hence this data set was included for detailed spectral analysis. During this dip, both the hard and soft colors decreased (Casella et al. 2004). For more details of the PDSs of the respective observations, see Casella et al. (2004).
2.2. Spectral Analysis
The spectra for sections Q and NQ were obtained (see Figure 1), and a model consisting of a multi-color disk component (Makishima et al. 1986) and a power-law component was used to fit the spectra, i.e., wabs(diskbb+power-law) in XSPEC. The equivalent hydrogen column density (NH), measured to be in the range of (0.3–0.8) × 1022 cm−2, was fixed at NH = 0.6 × 1022 cm−2 in the present study (Markwardt et al. 1999; dal Fiume et al. 1999). Since there was a line-like residuals' structure around ∼6.0 keV, we added a Gaussian component to the model where the centroid energy was fixed at 6.4 keV. Before constraining the spectral parameter values, we first confirmed a spectral variation between sections Q and NQ by applying a model-independent method, i.e., the best-fit parameter values of the first section spectrum were taken as the initial values to the corresponding second section spectrum. As we expected, the high Δχ values in Figure 2 strongly indicated a change in the spectra during the rapid transitions. The best-fit results for PCA (3–25 keV) and PCA+HEXTE (3–150 keV) spectra are summarized in Table 2, and the unfolded spectra are shown in Figure 3. For the second observation, the fit to the joint PCA+HEXTE spectra was not performed due to the small time window of section NQ (180 s).
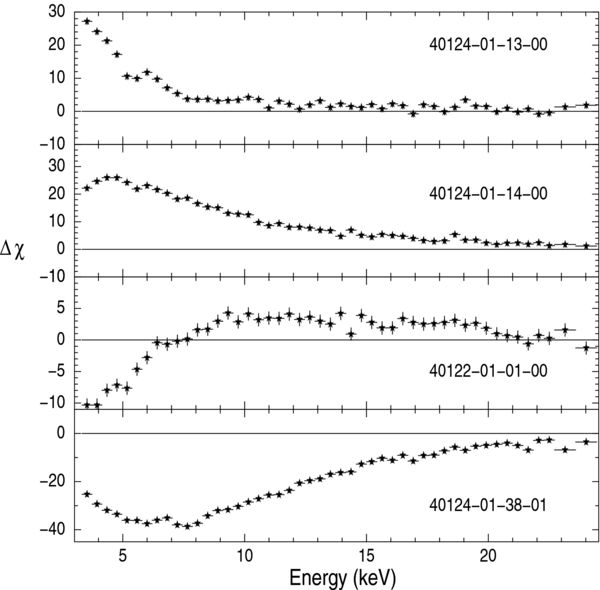
Figure 2. Residuals of the second section spectra based on the best-fit parameters of the first section spectra (see the text).
Download figure:
Standard image High-resolution image
Figure 3. Unfolded spectra along with their best-fit spectral components for the sections Q and NQ. The ObsID is shown in the respective panel.
Download figure:
Standard image High-resolution imageTable 2. The Best-fit Result of the Energy and Power Spectra for the Sections Q and NQ (See the Text)
| Parameters | 40124-01-13-00 | 40124-01-14-00 | 40122-01-01-00 | 40124-01-38-01 | ||||
|---|---|---|---|---|---|---|---|---|
| Q | NQ | NQ | Q | NQ | Q | NQ | Q | |
| For PCA | ||||||||
| kTin (keV)a | 1.05 ± 0.01 | 1.02 ± 0.01 | 1.01 ± 0.02 | 1.06 ± 0.02 | 1.03 ± 0.02 | 1.04 ± 0.02 | 0.90 ± 0.01 | 0.87 ± 0.01 |
| Ndiskbbb | 917 ± 82 | 1210 ± 100 | 1043 ± 120 | 804 ± 135 | 1212 ± 108 | 991 ± 100 | 1578 ± 120 | 1817 ± 140 |
| N*diskbbc | 917 ± 40 | 1210 ± 51 | 1043 ± 37 | 804 ± 66 | 1212 ± 30 | 991 ± 24 | 1578 ± 32 | 1817 ± 38 |
| Γd | 2.54 ± 0.03 | 2.55 ± 0.03 | 2.46 ± 0.02 | 2.47 ± 0.04 | 2.50 ± 0.02 | 2.51 ± 0.02 | 2.40 ± 0.03 | 2.27 ± 0.05 |
| ΓNorme | 13.78 ± 1.23 | 15.10 ± 1.27 | 9.83 ± 0.71 | 12.17 ± 1.85 | 12.17 ± 0.55 | 12.30 ± 0.58 | 3.62 ± 0.33 | 1.79 ± 0.27 |
| diskbb flux | 7.03 | 7.44 | 5.52 | 6.56 | 7.85 | 6.88 | 4.83 | 4.55 |
| Power-law flux | 15.59 | 16.38 | 13.01 | 15.72 | 14.15 | 14.63 | 5.34 | 3.43 |
| χ2/dof | 40/42 | 41/42 | 42/42 | 26/42 | 26/42 | 35/42 | 58/42 | 51/42 |
| For PCA+HEXTE | ||||||||
| kTin (keV) | 1.06 ± 0.02 | 1.02 ± 0.02 | 1.03 ± 0.02 | 1.03 ± 0.02 | 0.90 ± 0.01 | 0.87 ± 0.01 | ||
| Ndiskbb | 931 ± 125 | 1210 ± 152 | 1216 ± 110 | 1007 ± 100 | 1582 ± 122 | 1817 ± 138 | ||
| N*diskbb | 931 ± 40 | 1210 ± 47 | 1216 ± 28 | 1007 ± 21 | 1582 ± 30 | 1817 ± 31 | ||
| Γ | 2.52 ± 0.03 | 2.53 ± 0.03 | 2.50 ± 0.02 | 2.51 ± 0.02 | 2.43 ± 0.03 | 2.27 ± 0.06 | ||
| ΓNorm | 13.29 ± 1.40 | 14.03 ± 1.44 | 11.54 ± 0.67 | 12.40 ± 0.57 | 3.96 ± 0.38 | 1.66 ± 0.27 | ||
| diskbb flux | 7.42 | 7.83 | ⋅⋅⋅ | ⋅⋅⋅ | 7.87 | 6.84 | 4.72 | 4.65 |
| Power-law flux | 17.58 | 18.37 | ⋅⋅⋅ | ⋅⋅⋅ | 16.35 | 16.93 | 6.40 | 4.12 |
| χ2/dof | 84/74 | 59/74 | 57/74 | 79/74 | 88/74 | 93/74 | ||
| For PCA+HEXTE | ||||||||
| (Ignoring 4.8–6.0 keV band) | ||||||||
| kTin (keV) | 1.16 ± 0.01 | 1.14 ± 0.01 | 1.11 ± 0.01 | 1.19 ± 0.01 | 1.12 ± 0.008 | 1.14 ± 0.009 | 1.02 ± 0.01 | 0.98 ± 0.01 |
| Ndiskbb | 631 ± 29 | 798 ± 37 | 612 ± 29 | 500 ± 36 | 811 ± 26 | 650 ± 23 | 859 ± 35 | 1002 ± 49 |
| N*diskbb | 631 ± 20 | 798 ± 27 | 612 ± 16 | 500 ± 29 | 811 ± 14 | 650 ± 13 | 859 ± 14 | 1002 ± 14 |
| Γ | 2.47 ± 0.03 | 2.49 ± 0.03 | 2.42 ± 0.03 | 2.44 ± 0.03 | 2.45 ± 0.02 | 2.48 ± 0.02 | 2.40 ± 0.03 | 2.23 ± 0.05 |
| ΓNorm | 11.40 ± 0.90 | 12.39 ± 0.92 | 8.98 ± 0.62 | 11.28 ± 1.61 | 10.30 ± 0.56 | 11.29 ± 0.50 | 3.62 ± 0.30 | 1.58 ± 0.23 |
| diskbb flux | 8.03 | 8.74 | 6.25 | 7.43 | 8.80 | 7.71 | 5.25 | 5.00 |
| Power-law flux | 17.32 | 17.91 | 14.83 | 17.89 | 15.89 | 16.50 | 6.24 | 4.08 |
| χ2/dof | 85/72 | 58/72 | 64/40f | 28/40 | 76/72 | 88/72 | 98/70g | 100/70 |
| QPO nature | ||||||||
| Type of QPO(νh) | B (∼6) | A (∼8.5) | C (∼8.7) | B (∼6.4) | A(∼7.6) | B(∼6) | no qpo | A(∼7.6) |
Notes. The quoted errors are at a 90% confidence level and fluxes are in units of 10−9 erg cm−2 s−1. The fluxes for PCA and PCA+HEXTE data are obtained in the energy band 3–25 keV and 3–100 keV, respectively. aInner disk temperature. bNormalization of diskbb model. cNormalization of diskbb model obtained after fixing kTin. dPower-law index. eNormalization of the power-law model (photons keV−1 cm−2 s−1 at 1 keV). fFor PCA data. gIgnoring 4.5–6.0 keV band. hCentroid frequency in units of Hz.
Download table as: ASCIITypeset image
It is found that during the first three observations, the disk temperature remained almost the same at kTin ∼ 1 keV (the variation was at most within the range of 1.5σ) along with the power-law index at Γ ∼ 2.5. The parameter which is found to be more variable than kTin is the disk normalization (Ndiskbb). Similar results were obtained from the PCA+HEXTE data. Since the inner disk temperature (kTin) was changing marginally from section Q to NQ, it was frozen to place a tighter limit on the Ndiskbb parameter. It is also found that in the first, third, and fourth observations, the disk normalization varies by 4.5σ, 7.0σ, and 5.4σ, respectively. We tried the fit again with different NH values ((0.3–0.8) × 1022 cm−2) but found similar results. In the fourth observation, the appearance of type-A QPO (section Q) was found to be associated with an increase in the Ndiskbb value, and the Γ was found to vary from 2.40 in section NQ to 2.27 in section Q. All the changes suggest that during the appearance of the 6 Hz type-B QPO, the inner disk front is closer to the BH and is away, otherwise. During the fitting, we noted that the Gaussian line width is large (W ∼ 1.2–1.5 keV) and the line centroid energy is constraining below ∼6 keV, suggesting a broad redshifted iron line; a similar feature was observed from BeppoSAX data too (Frontera et al. 2001). To rule out the possibility that the observed change in the Ndiskbb is connected with the line-like structure, we re-fitted the spectra after ignoring the data in the 4.8–6.0 keV range for the first three observations, 4.5–6.0 keV for the last observation, and excluding the Gaussian component (Table 2). It was found that the disk normalization varies by 5.1σ, 3.5σ, 8.5σ, and 7.2σ for the first to fourth observations, respectively (fixed kTin). A variation of 3.6σ, and 4.7σ for the first and third observations and <2.5σ for the other two observations was noted when kTin was kept free. In the second and fourth observations, kTin varied by more than 3σ. From this analysis, it is clear that the variations are not associated with the Gaussian line-like structure and both disk normalization and inner disk temperature could be responsible for the sudden transitions.
The third observation (40122-01-01-00) was analyzed in more detail. Apart from the sections Q and NQ, three more sections were analyzed, i.e., NQ1 (the last 1000 s of the first part of the light curve), Q1 where count rate abruptly increased (300 s), and Q2, the adjacent section where the count rate suddenly decreased (550 s) in the second part of the light curve. Since it was noted that the changes were limited to PCA energy band, the HEXTE spectrum was not included. The same model was used to unfold the spectra of the sections, and the best-fit results are shown in Table 3. A change of <3σ can be seen in the Ndiskbb parameter as the source traverses from section Q1 to Q2 where power spectra are found to be associated with a low-amplitude type-B 6 Hz QPO in Q1 and a high-amplitude type-B 6 Hz QPO in Q2 (not shown in the present work, see Figure 13 of Casella et al. 2004).
Table 3. The Best-fit Spectral Parameters for ObsID 40122-01-01-00 (See the Text)
| Parameters | 40122-01-01-00 | ||||
|---|---|---|---|---|---|
| NQ | NQ1 | Q1 | Q2 | Q | |
| kTin (keV)a | 1.03 ± 0.02 | 1.03 ± 0.02 | 1.02 ± 0.02 | 1.03 ± 0.02 | 1.04 ± 0.02 |
| Ndiskbbb | 1212 ± 108 | 1164 ± 118 | 1168 ± 140 | 995 ± 125 | 991 ± 100 |
| N*diskbbc | 1212 ± 30 | 1164 ± 38 | 1168 ± 53 | 995 ± 48 | 991 ± 24 |
| Γd | 2.50 ± 0.02 | 2.47 ± 0.03 | 2.49 ± 0.03 | 2.51 ± 0.03 | 2.51 ± 0.02 |
| ΓNorme | 12.17 ± 0.55 | 10.56 ± 0.92 | 12.18 ± 1.25 | 12.18 ± 1.20 | 12.30 ± 0.58 |
| diskbb flux | 5.52 | 7.79 | 7.55 | 6.69 | 6.56 |
| Power-law flux | 13.01 | 14.74 | 15.0 | 14.38 | 15.72 |
| χ2/dof | 26/42 | 48/42 | 31/42 | 46/42 | 35/42 |
| Ignoring 4.8–6.0 keV | |||||
| kTin (keV) | 1.12 ± 0.01 | 1.13 ± 0.01 | 1.11 ± 0.01 | 1.14 ± 0.01 | 1.14 ± 0.01 |
| Ndiskbb | 808 ± 27 | 781 ± 31 | 772 ± 38 | 618 ± 29 | 642 ± 23 |
| N*diskbb | 808 ± 14 | 781 ± 18 | 772 ± 25 | 618 ± 14 | 642 ± 13 |
| Γ | 2.46 ± 0.02 | 2.45 ± 0.02 | 2.45 ± 0.02 | 2.49 ± 0.03 | 2.47 ± 0.02 |
| ΓNorm | 10.44 ± 0.48 | 10.76 ± 0.73 | 11.00 ± 1.10 | 11.19 ± 1.00 | 10.90 ± 0.50 |
| diskbb flux | 8.75 | 8.63 | 8.43 | 7.54 | 7.86 |
| Power-law flux | 13.74 | 16.84 | 14.60 | 13.95 | 14.06 |
| χ2/dof | 44/40 | 51/40 | 39/40 | 50/40 | 53/40 |
Notes. Section Q and NQ parameters are again listed for comparison. The quoted errors are at a 90% confidence level and fluxes are in units of 10−9 erg cm−2 s−1 for PCA (3–25 keV). aInner disk temperature. bNormalization of diskbb model. cNormalization of diskbb model obtained after fixing kTin. dPower-law index. eNormalization of the power-law model (photons keV−1 cm−2 s−1 at 1 keV).
Download table as: ASCIITypeset image
2.3. Spectral Variations during the Rapid Transition of a Type-B QPO
Simple models to unfold the spectrum in black hole transient (BHT) sources often underestimate the role of Compton-scattered low-energy power-law photons contributing to the high-energy tail (Tamura et al. 2012). Steiner et al. (2009) developed a convolution model (simpl model in XSPEC) which handles the seed photons contributing to the high-energy tail. Since a low-energy power-law component was found from our earlier fits along with the diskbb component, we used model 3 of Tamura et al. (2012), i.e., wabs(simpl(d)*diskbb+rdblur*ireflect*(simpl(c)*diskbb+nthcomp)+Gaussian). Even though their study focused on GX 339-4, the spectral state (IM) and QPO properties are similar to those observed in our present study. The convolution rdblur model takes into account general relativistic effects in the accretion disk (Fabian et al. 1989), and ireflect handles the ionized reflection (Done et al. 1992; Magdziarz & Zdziarski 1995). For more details of the model, see Tamura et al. (2012). The model has 32 parameters, and constraining each of them is difficult with the RXTE data. Hence, we adopted a method of first using the parameters obtained by Tamura et al. (2012) and then freezing/changing some parameter values. For example, the following parameters of the model were frozen: simpl component: Γ = 2.1 and allowed the seed photons to upscatter; rdblur component: inner radius Rin = 10 Rg and outer radius Rin = 104 Rg, inclination angle i = 70° (because eclipses were not observed in this source), power-law index emissivity β = −3; ireflect component: same values were adopted as those obtained by Tamura et al. (2012), Gaussian line energy and width were fixed at 6.4 keV and 0.4 keV, respectively. In the thermal Comptonization component (nthcomp model; Zdziarski et al. 1996; Zycki et al. 1999), electron temperature (kTe) was fixed at 100 keV and seed photon temperature was tied to the inner disk temperature of the diskbb model. The energy range was extended to 1–1000 keV as demanded by the convolution models, namely, simpl, rdblur, and ireflect. We used this model to unfold the spectra of three BH sources, XTE J1859+226 (ObsID 40124-01-13-00), XTE J1817-330 (Sriram et al. 2012), and GX 339-4 (ObsID 70108-03-02-00), where Motta et al. (2011) observed the transient 6 Hz QPO evolving from type-A to B (see their Figure 11). For GX 339-4, a similar procedure was adopted to obtain and fit the Q and NQ spectra. The inclination angle was set to i = 50° based on the Tamura et al. (2012) results for GX 339-4. For all sources, variations of inclination angle (i = 50°–70°), kTe (50–100 keV), and β did not affect the overall results.
Table 4 shows the best-fit parameter values obtained for all three BH sources. Only in XTE J1859+226 was a subtle change in the Ndiskbb observed, whereas in the other sources photon index (Γnthcomp) was found to be varying. We also unfolded the section Q and NQ spectra for GX 339-4 using a simple model aforementioned in Section 2.2. A relatively small variation in Ndiskbb was observed, whereas the power-law index was steady at Γ ∼ 2.48. Compared to the spectral variations observed using the simple model, no significant changes were observed using the complex model due to the relative complexity of the model and the poor data quality, and this prevents us from deriving any strong conclusions.
Table 4. Best-fit Spectral Results Obtained Using the Model wabs(simpl(d)*diskbb+rdblur*ireflect*(simpl(c)*diskbb+nthcomp)+Gaussian)(See the Text)
| Parameters | XTE J1859+226 | XTE J1817-330 | GX 339-4 | |||||
|---|---|---|---|---|---|---|---|---|
| 40124-01-13-00 | 91110-02-30-00 | 70108-03-02-00 | ||||||
| Q | NQ | Q (non-dip) | NQ (dip) | NQ | Q | NQ | Q | |
| NH(× 1022 cm−2)a | 0.6 | ⋅⋅⋅ | 0.12 | ⋅⋅⋅ | 0.5 | ⋅⋅⋅ | ⋅⋅⋅ | ⋅⋅⋅ |
| kTin (keV)b | 0.88 ± 0.02 | 0.85 ± 0.02 | 0.82 ± 0.02 | 0.82 ± 0.02 | 0.81 ± 0.01 | 0.81 ± 0.02 | 0.87 ± 0.01 | 0.86 ± 0.005 |
| Ndiskbbc | 1278 ± 136 | 1627 ± 170 | 1264 ± 105 | 1252 ± 135 | 1354 ± 94 | 1465 ± 90 | 1848 ± 125 | 2152 ± 64 |
| fracupscattersimpl | 0.08 ± 0.02 | 0.07 ± 0.02 | 0.01 ± 0.01 | 0.03 ± 0.02 | 0.02 ± 0.008 | 0.01 ± 0.008 | ⋅⋅⋅ | ⋅⋅⋅ |
| Ω/2*πireflect | 0.69 | ⋅⋅⋅ | 0.79 | ⋅⋅⋅ | ⋅⋅⋅ | ⋅⋅⋅ | ||
| Γnthcomp | 2.85 ± 0.09 | 2.87 ± 0.09 | 2.57 ± 0.09 | 2.40 ± 0.04 | 2.85 ± 0.11 | 2.74 ± 0.11 | ⋅⋅⋅ | ⋅⋅⋅ |
| Nnthcomp | 2.95 ± 0.27 | 3.21 ± 0.29 | 1.16 ± 0.07 | 0.87 ± 0.08 | 0.78 ± 0.06 | 0.66 ± 0.05 | ⋅⋅⋅ | ⋅⋅⋅ |
| Γd | ⋅⋅⋅ | ⋅⋅⋅ | ⋅⋅⋅ | ⋅⋅⋅ | ⋅⋅⋅ | ⋅⋅⋅ | 2.47 ± 0.04 | 2.49 ± 0.04 |
| ΓNorme | ⋅⋅⋅ | ⋅⋅⋅ | ⋅⋅⋅ | ⋅⋅⋅ | ⋅⋅⋅ | ⋅⋅⋅ | 2.56 ± 0.30 | 2.40 ± 0.25 |
| QPO nature | type-B | type-A | type-B | type-A | type-A | type-B | type-A | type-B |
| χ2/dof | 80/74 | 60/74 | 102/74 | 75/74 | 70/74 | 73/74 | 75/74 | 79/74 |
Notes. The last two columns for GX 339-4 are the best-fit parameters using the model wabs(diskbb+power-law+Gaussian). The quoted errors are at a 90% confidence level. aHydrogen equivalent column density. bInner disk temperature. cNormalization of diskbb model. dPower-law index. eNormalization of the power-law model (photons keV−1 cm−2 s−1 at 1 keV).
Download table as: ASCIITypeset image
To constrain the minimum set of spectral parameters responsible for the spectral change, we performed a simultaneous fit using the section Q and NQ spectra (Sriram et al. 2007, 2009, 2010, 2011). For each source, the best-fit parameter values of the section Q spectrum were tied to the section NQ spectrum, which resulted in high χ2/dof (Table 5). First, the disk normalization parameter was untied, followed by the inner disk temperature, and later on the other parameters were untied. Based on satisfactory χ2/dof values, the parameter values and their errors could be obtained (Table 5). It was found that in XTE J1859+226 (40124-01-13-00), untying of diskbb model parameters was enough to explain the overall spectral change. In another observation of XTE J1859+226 (40122-01-01-00) and in GX 339-4, all the parameters needed to be untied except the power-law index, and in the rest of the observations all the parameters needed to be untied to get a satisfactory χ2/dof. We further investigated contour plots between disk normalizations, inner disk temperatures, and power-law indices. Figure 4 shows contour plots for the disk normalizations and inner disk temperatures between section Q and NQ spectra. We found that in two observations of XTE J1859+226 (40124-01-13-00 and 40122-01-01-00), the disk normalization varies at a confidence level of more than 99% (Figure 4). In GX 339-4 and XTE J1859+226 (40124-01-38-01) both the disk normalization and the inner disk temperature significantly varied (>99% confidence level). The power-law index was found to vary at 99% confidence level in XTE J1817–330 and in XTE J1859+226 (40124-01-38-01) (not shown in the figure).

Figure 4. Contour plots for the disk normalizations (disk Norm; left panels) and the inner disk temperatures (kTin; right panels) of the corresponding ObsID (see the text). In each panel, the contours from inner to outer represent 68%, 90%, and 99% confidence level. The panels in the last row belong to GX 339-4, and the rest of the panels correspond to XTE J1859+226.
Download figure:
Standard image High-resolution image
Table 5. Results of Simultaneous Spectral Fits
| XTE J1859+226 | XTE J1817-330 | GX 339-4 | ||||||||
|---|---|---|---|---|---|---|---|---|---|---|
| 40124-01-13-00 | 40122-01-01-00 | 40124-01-38-01 | 91110-02-30-00 | 70108-03-02-00 | ||||||
| Parameter | χ2/dof | ⋅⋅⋅ | χ2/dof | ⋅⋅⋅ | χ2/dof | ⋅⋅⋅ | χ2/dof | ⋅⋅⋅ | ||
| All tied | 1039/162 | ⋅⋅⋅ | 788/162 | ⋅⋅⋅ | 25216/162 | ⋅⋅⋅ | 2273/162 | ⋅⋅⋅ | 2498/162 | ⋅⋅⋅ |
| Ndiskbba | 214/160 | ⋅⋅⋅ | 498/160 | ⋅⋅⋅ | 14601/160 | ⋅⋅⋅ | 914/160 | ⋅⋅⋅ | 2139/160 | ⋅⋅⋅ |
| kTinb | 210/158 | ⋅⋅⋅ | 311/158 | ⋅⋅⋅ | 10041/158 | ⋅⋅⋅ | 529/158 | ⋅⋅⋅ | 1256/158 | ⋅⋅⋅ |
| ΓNormc | 154/156 | ⋅⋅⋅ | 141/156 | ⋅⋅⋅ | 245/156 | ⋅⋅⋅ | 205/156 | ⋅⋅⋅ | 169/156 | ⋅⋅⋅ |
| Γd | ⋅⋅⋅ | ⋅⋅⋅ | ⋅⋅⋅ | ⋅⋅⋅ | 185/154 | ⋅⋅⋅ | 190/154 | ⋅⋅⋅ | ||
| All untied | 150/150 | ⋅⋅⋅ | 139/150 | ⋅⋅⋅ | 183/150 | ⋅⋅⋅ | 187/150 | ⋅⋅⋅ | 167/150 | ⋅⋅⋅ |
| Q | NQ | NQ | Q | NQ | Q | Q | NQ | NQ | Q | |
| Ndiskbb | 973 ± 44 | 1183 ± 60 | 1223 ± 45 | 993 ± 40 | 1570 ± 70 | 1922 ± 95 | 1294 ± 68 | 1417 ± 100 | 1847 ± 65 | 2179 ± 72 |
| kTin | 1.05 ± 0.01 | 1.04 ± 0.01 | 1.02 ± 0.008 | 1.04 ± 0.01 | 0.90 ± 0.007 | 0.86 ± 0.008 | 0.92 ± 0.01 | 0.91 ± 0.01 | 0.89 ± 0.005 | 0.86 ± 0.004 |
| ΓNorm | 12.34 ± 0.07 | 12.68 ± 0.08 | 11.69 ± 0.34 | 11.59 ± 0.57 | 3.90 ± 0.20 | 1.62 ± 0.18 | 4.81 ± 0.31 | 3.06 ± 0.44 | 2.57 ± 0.02 | 2.25 ± 0.02 |
| Γ | ⋅⋅⋅ | ⋅⋅⋅ | ⋅⋅⋅ | ⋅⋅⋅ | 2.43 ± 0.02 | 2.23 ± 0.04 | 2.47 ± 0.02 | 2.33 ± 0.05 | ⋅⋅⋅ | ⋅⋅⋅ |
Notes. aNormalization of diskbb model. bInner disk temperature of diskbb model. cNormalization of power-law model. dPower-law index.
Download table as: ASCIITypeset image
3. DISCUSSION AND CONCLUSION
A broad range of LFQPOs (∼1–10 Hz) are generally observed in the SPL state (state)/intermediate state (IM) among the BH binaries (Remillard & McClintock 2006; Belloni 2010). This state is intermediate to the LH state and HS state where both Keplerian disk and a compact Compton cloud are present in the accretion flow (Done & Kubota 2006; Sriram et al. 2007, 2009, 2010). In the LH state, the disk component is very weak, assumed to be truncated at a large distance from the BH, and in the HS state, the power-law component is significantly weak when compared to other spectral states (Done et al. 2007). Casella et al. (2005) classified the LFQPOs in three types (A, B, and C) whose complex connections, transitions, and physical association in the accretion disk are not properly understood. However, there are various models which explain the production of LFQPOs. The first physical origin of LFQPOs could be the disk; as the source moves from LH state to HS state, the LFQPOs disappear. In the truncated hot flow model, the movement of the inner front coupled with the precession of a radially hot flow was found to be responsible for the variability of LFQPOs in PDS (Done et al. 2007; Ingram et al. 2009; Ingram & Done 2010, 2011). The LFQPOs are associated with the hard emission/Comptonizing tails and are strongly correlated to the power-law index (Churazov et al. 2001; Vignarca et al. 2003; Sobolewska & Zycki 2006; Shaposhnikov & Titarchuk 2007). A qualitative explanation for QPO is the Lense–Thirring precession model (Stella & Vietri 1998; Stella et al. 1999), which suggests that the origin of QPO is due to the precession of the radially and vertically perturbed orbits around the compact object and, later on, quantitatively modified to describe the broadband power spectral properties along with its variability (Ingram & Done 2010, 2011). Another physical model is the magnetohydrodynamic (MHD) origin of the LFQPOs in the accretion disk (Tagger & Pellat 1999). In a global MHD simulation of BH accretion, O'Neill et al. (2011) observed a low-frequency dynamo cycle, making it a potential source of LFQPOs.
Rapid transitions among different types of QPOs are rarely observed, and associated spectral studies were reported for two BH sources, namely, GX 339-4 (Nespoli et al. 2003) and XTE J1817-330 (Sriram et al. 2012). The occurrence of a type-B QPO at the peak of the outburst is often observed (Motta et al. 2011; Sriram et al. 2012). In XTE J1859+226, the first three observations analyzed here belong to the peak of the outburst in X-ray (Casella et al. 2004) as well as in radio band (Fender et al. 2009; Brocksopp et al. 2002). Jets were observed in μ and β classes of GRS 1915+105 (Naik & Rao 2000; Klein-Wolt et al. 2002; Vadawale et al. 2003) and probably connected with the fast transitions of QPO types (Soleri et al. 2008), and a jet origin was discussed by Miyamoto et al. (1991) after detecting flip-flop transitions in GX 339-4. Here we have presented the spectral results of four observations of a BH source XTE J1859+226 and one observation of GX 339-4 which were associated with the fast transitions involving a type-B QPO (Casella et al. 2004; Motta et al. 2011). The spectra were found to be significantly modified during the rapid transition in all the observations (Figure 2 and Table 5). It was found that the disk normalization parameter, which is a measure of inner disk radius (Ndiskbb ∝ R2), was found to vary (>99% confidence level) during all the rapid transitions (Table 5). In two observations the inner disk temperature varied at the confidence level of more than 99%. The other most important observed feature is that whenever a type-B QPO is identified, the location of the inner disk front is always found to be closer to the BH. The last observation of XTE J1859+226 where a sudden dip was identified with the production of a type-A QPO was also connected with a change in the power-law index parameter (Table 5). The spectral changes in the fourth observation were found to be similar to the changes observed in XTE J1817-330 (Sriram et al. 2012). In XTE J1817-330, a type-A QPO was observed in the dip section, spectrally associated with the hardening of the power-law index (see Table 2 of Sriram et al. 2012). This motivated us to look for the change in the Ndiskbb parameter. After fixing the kTin parameter, we found that Ndiskbb varied from the non-dip section (Ndiskbb = 1417 ± 100) to the dip section (Ndiskbb = 1294 ± 68) (Table 5); this change was found at the confidence level of less than 99%, and change in Γ was at >99% confidence level. In GX 339-4, both Ndiskbb and kTin varied by more than 99% confidence level with no appreciable change in the power-law index. However, we found that though unfolding the spectra with a complex model is physical in nature, it does not show any substantial variations from Q to NQ. Tamura et al. (2012) observed a small variation in the QPO frequency during Suzaku observation of GX 339-4 and found that movement of the inner disk radius cannot be ruled out (using model 3), though it is not significant but consistent with the prediction of Lense–Thirring precession of the hot flow model (Ingram et al. 2009). We conclude that the absence of spectral variation in our work is possibly due to the low quality of the data over the invoked complex model.
The disk and power-law component fluxes varied over one section to the other. In the first and second observations ∼5% and ∼16% change was observed in both the components, in the third observation the disk component flux varied by ∼15% and power-law flux varied by ∼3.5%, and in the fourth observation the power-law flux significantly varied (∼55%). Nespoli et al. (2003) observed a 9% and 30% variation in disk and power-law flux during a rapid transition in the source GX 339-4, whereas in H1743-322, Homan et al. (2005) found no ascertainable changes in fluxes during such fast transitions. In XTE J1817-330, a 17% change was observed in the power-law flux, although no significant variation was found in the disk flux (Sriram et al. 2012).
The measurement of the inner disk radius is considered to be a difficult task and must be appropriately corrected. The diskbb model normalization is related to the inner disk radius as Ndiskbb = ((Rin/Km)/(D/10 kpc))2 cos θ. The measured inner disk radius (Rin) is not the true radius and primarily affected by the Comptonization process along with a few other factors (Shimura & Takahara 1995; Kubota et al. 1998; Makishima et al. 2000). The simulation performed by Merloni et al. (2000) shows that the inner disk radius in diskbb is often underestimated and the movement of the inner disk front is misguided as the accretion rate and/or hard X-ray emission varies. Since the temperature obtained by the diskbb model is modified due to the scattering over the disk surface, a spectral hardening factor (fc) is required to estimate the true temperature (Shimura & Takahara 1995). The value of fc was approximated to 1.7 (Shimura & Takahara 1995), but more detailed investigations show a broad range, 1.7 ⩽ fc ⩽ 3.0 (Merloni et al. 2000). Done & Davis (2008) found that fc changes from ∼1.8 in soft state to ∼2.2 in hard state. Combining the facts that spectral hardening and disk temperature do not peak at inner radius, Reynolds & Miller (2013) obtained the relation Rcorr (km) ∼ 1.2  × (D/10 kpc). In our study Rcorr was found to be (respectively, for the Q and NQ sections) 20 ± 1 km and 23 ± 1 km (40124-01-13-00), 19 ± 1 km and 21 ± 1 km (40124-01-14-00), 21.0 ± 0.5 km and 23.0 ± 0.5 km (40122-01-01-00), and 28.0 ± 0.5 km and 26.0 ± 0.5 km (40124-01-38-01) assuming a distance of ∼4.2 ± 0.5 kpc (Shaposhnikov & Titarchuk 2009) and an inclination of 60° for XTE J1859+226 (Hynes et al. 2002; Zurita et al. 2002). Similarly for XTE J1817-330, it was 75 ± 1 km and 72 ± 1 km (assuming a distance of 10 kpc and an inclination of 70°) and for GX 339-4 it was 55 ± 1 km and 50 ± 1 km (assuming a distance of 8 kpc and an inclination of 50°; Gallo et al. 2004). The quoted errors in the radius pertain to the statistical error in the data. The other sources of errors are the spectral hardening factor, distance, and inclination (and the inherent uncertainties in the spectral models). These errors, however, will affect the absolute values of the radius but will not significantly affect the change in the radius. The derived value of the radius in GX 339-4 is comparable to the value of radius (50–100 km) derived for XTE J1550-564 (Done & Kubota 2006) in a similar spectral state.
The accretion ejection instability (AEI) model (Tagger & Pellat 1999; for a brief review, see Varniere et al. 2007) possibly explains the close correlation of LFQPOs and the inner disk radius in BHXBs (Caunt & Tagger 2001). The model predicts a turnover in the correlation between frequency–radius as the disk approaches the last stable orbit, and it has been observed in GRO J1655-40 and GRS 1915+105 (Sobczak et al. 2000; Rodriguez et al. 2002; Mikles et al. 2009). Varniere et al. (2012) associated type-C, B, and A QPOs to the different modes m = 1, 2, 3, 4 (m is azimuthal wave-number) and their relative strengths in the AEI model. The type-C QPO is observed if m = 1 is strong compared to other modes; a cathedral QPO is observed if m = 1, 2 are equal in strength; type-B is observed if m = 2 is strong among others; and a type-A QPO is observed when m = 4 is the strongest (for more clarity, see Figure 2 in Varniere et al. 2012). In the AEI model, it was proposed that the type-B and A QPOs are observed at Rcritical = Rin/RISCO ∼ 1.3 (RISCO; innermost stable circular orbit radius) where relativistic effects are dominant at the inner region of the accretion disk. In the case of XTE J1859+226, assuming a non-spinning BH, RISCO ∼ 3 RS (Schwarzschild radius) ∼63 km for a 7 M☉ BH, then Rcritical ∼ 0.32, which is significantly less than 1.3. However, in the case of a Kerr BH, the last stable orbit decreases, RISCO ∼ 0.5 RS (this limit is valid if the accretion disk is prograde to the maximally spinning BH) and Rcorr/RISCO ∼ 1.5, which is close to Rcritical. However, for the last observation in XTE J1859+226 Rcorr/RISCO ∼ 2.1 and for GX 339-4 Rcorr/RISCO ∼ 3.7. Perhaps the uncertainties are due to the moderate energy resolution of PCA at lower energies, which is imperative to properly estimate the radius. Farinelli et al. (2013) reported a relatively higher inner disk radius based on the BATSE+RXTE spectrum at a similar spectral state (TOO1 observation in their paper), which results in a higher Rcritical. Moreover, an inaccurate estimate of distance and inclination prevents the determination of the true inner disk radius.
The luminosity of XTE J1859+226 for the first observation is L = 5.25 × 1037 erg s−1, for XTE J1817-330 L = 1.0 × 1038 erg s−1, and for GX 339-4 L = 6.32 × 1037 erg s−1. It can be seen that the derived luminosities for XTE J1859+226 and GX 339-4 are similar during the occurrence of type-B QPOs.
The type-B QPOs have a relatively high quality factor (Q ⩾ 6; Casella et al. 2005), indicating that the underlying mechanism is acting coherently in the accretion disk. We found that during the presence of a type-B QPO, the inner disk front is located close to the BH, and as the source rapidly traverses to type-A, the location of the inner disk front moves away from the BH. The movement of the inner front was also observed during the fast transition, but significant changes were observed in the inner disk temperature only in two observations (Figure 4). In all the observations of XTE J1859+226 and in one observation of GX 339-4, the disk normalization was the common parameter found to be significantly varying, which indicates that the inner region of the disk is relatively more affected than the Compton cloud responsible for the power-law component. However, it was also found that the disk and the power-law fluxes were varying too during the sudden transition (Table 1), indicating toward a coupled disk-corona region possibly associated with the sudden transition of QPOs.
In summary, a broadband spectroscopy was performed on four observations of XTE J1859+226 associated with rapid transition of QPOs involving a type-B QPO except one observation during which a type-A QPO suddenly appeared in the dip section of the light curve. Based on the simultaneous spectral fits, it is evident that the transient type-B QPO is associated with the movement of the inner disk front located relatively close to the BH causing the changes in the kTin and Ndiskbb. Spectral fitting using a detailed decoupled disk-corona model, however, could not conclusively demonstrate the inner disk variations, probably due to the low spectral sensitivity of RXTE. Since the diskbb model parameters consistently varied along with the power-law fluxes during the transition of type-B QPOs, we suggest that a coupled inner disk-corona region is responsible for the observed phenomenon. Future observations from Astrosat satellite can give a comprehensive view of such events in BHXBs.
We thank the anonymous referee for the useful comments. This research has made use of data obtained through the HEASARC Online Service, provided by NASA/GSFC in support of the NASA High Energy Astrophysics Programs. K.S. is supported by the KRCF postdoctoral fellowship. K.S. also thanks the hospitality provided at TIFR, where part of this work was done.