


ABSTRACT
We present an analysis of Chandra X-Ray Observatory data detailing a Galactic supernova remnant, G272.2−3.2. A clear shell of emission is resolved as a series of filaments and knots around the entire rim of the remnant. Spectral analysis of these features show that they are consistent with shock heating of interstellar material in a clumpy medium. We contrast these X-ray images with 22 μm Wide-field Infrared Survey Explorer (WISE) data to verify this interaction. Spatially separated from the shell we see a central diffuse region dominated by harder, hotter emission. Spatial spectroscopy shows a clear enhancement of metals consistent with a Type Ia explosion, namely S, Si, and Fe. We find no clear evidence for a compact object or pulsar wind nebula and argue for a Type Ia origin. Consideration of the ionization timescales suggest an age of 11,000 yr for G272.2−3.2.
Export citation and abstract BibTeX RIS
1. INTRODUCTION
The galactic supernova remnant (SNR) G272.2−3.2 was originally identified in the all sky survey of ROSAT (Greiner & Egger 1993). Using multiple techniques, Greiner et al. (1994) find this object to have a possible age range of 400–4000 yr and a distance of  kpc, which have been revised in more recent studies. The X-ray emission exhibits circular morphology with a diameter of 15.2 arcmin. The authors find a spectrum that is thermal in origin possibly arising from a reverse shock reheating ejecta from the supernova (SN) explosion or from cloud evaporation in the hot, shocked interior.
The X-ray morphology is mirrored in radio observations. Diffuse radio emission fills a circular region of ∼15 arcmin. The remnant was detected using the 64 m Parkes radio telescope, the Australia Telescope Compact Array (ATCA), and the Molonglo Observatory Synthesis Telescope (MOST; Duncan et al. 1997). In addition to the diffuse emission, there are four radio "blobs," one of which is near the center of the remnant. Three of these have strong spatial correlations to optical filaments studied by Winkler et al. (1993). The filaments have [S ii]/Hα ratios consistent with an SNR. The radio/optical correlation suggests shock interaction in a clumpy circumstellar environment. The radio flux with a spectral index of α ∼ 0.55 indicates non-thermal emission, consistent with a shell type remnant. The authors find no evidence for thermal emission or spectral indices expected from a pulsar wind nebula (PWN). Furthermore, the radio data do not exhibit polarized emission, suggesting a turbulent magnetic field, at least down to the scale of the 1 arcmin beam size. Given the presence of optical filaments and a tentative anti-correlation between the X-ray and radio features, Duncan et al. (1997) argue for an older age of ∼6000 yr.
The remnant is well studied in the X-ray band. Harrus et al. (2001) performed an X-ray study using data from the ASCA and ROSAT observatories. They classified G272.2−3.2 as a thermal composite SNR due to its centrally peaked thermal emission. They found evidence for areas of enhanced emission, especially in the west, but did not detect the presence of a shell. A spectrum of the entire remnant was characterized by a nonequilibrium plasma with a temperature of kT ∼ 0.73 keV and ionization timescale of ∼7 × 1010 cm−3 s. To explain the centrally peaked morphology the authors considered the possibility of clouds evaporating in a hot, shocked medium (White & Long 1991). A cloud evaporation model is capable of matching their extracted thermal profile and some of their emission profiles. They also include the possibility that projection effects along the line of sight may contribute and perhaps explain the centrally enhanced morphology. The authors calculate a 2 kpc distance using statistical analysis, which agrees with Greiner et al. (1994), yet also show that an upper limit of 10 kpc can be calculated using the color excess and column density relation of Predehl & Schmitt (1995). They adopt a 5 kpc distance in their analysis.
The Harrus et al. (2001) study also presents data from the Infrared Astronomical Satellite (IRAS). They observe no significant emission in the 12 and 25 μm IRAS bands and find the total surface brightness of G272.2−3.2 in the 60 and 100 μm bands to be 15 and 70 MJy sr−1, respectively. In addition, they create a ratio image of the remnant using the 60 μm/100 μm flux ratio and note that the image is well correlated with the western, X-ray bright portion of the remnant as seen in their ROSAT HRI image. From the lack of detection at 12 and 25 μm and the comparatively low 60 μm to 100 μm flux ratio, Harrus et al. (2001) conclude a low dust temperature for the surrounding interstellar medium (ISM).
The X-ray emission from G272.2−3.2 has been revisited using Suzaku. Sezer & Gok (2012) present spectra extracted from three regions—the entire remnant, the central region (3.8 arcmin radius), and the outer region (annulus between radii of 3.8 and 7.6 arcmin). In general, the remnant can be described by a nonequilibrium thermal plasma with a temperature of kT ∼ 0.77 keV, consistent with Harrus et al. (2001). The central region is brighter and slightly hotter, with enhanced abundances indicative of ejecta, while the outer region is slightly cooler, with abundances consistent with the local ISM. Their data also show centrally peaked X-ray emission and the absence of a shell. Given the nonequilibrium nature of the plasma, they also support cloud evaporation over thermal conduction to explain the morphology. Finally, when comparing the derived abundances to Type Ia nucleosynthesis yields (Nomoto et al. 1997), the results are consistent with a Type Ia origin.
Of final note, Sánchez-Ayaso et al. (2013) recently studied XMM-Newton and Chandra data of G272.2−3.2. The authors present a false color image of the Chandra data, but base their results on spatial and spectral analysis of the XMM-Newton data. Extraction regions corresponding to the central and outer regions used in Sezer & Gok (2012) show a somewhat different picture. Nonequilibrium ionization fits to the outer region give a hotter, although ill-constrained, temperature (kT = 1.05 ± 0.79 keV) when compared to the central emission (kT = 0.76 ± 0.03 keV). Abundances in this outer region are significantly depleted from ISM values, while abundances derived for the center region are enhanced in Si, S, and Fe, but depleted otherwise. These central enhancements led the authors to argue for a Type Ia progenitor. In addition, the optical filaments detected by Winkler et al. (1993) were revisited using data from the SuperCOSMOS Hα survey. The location of these filaments was compared to local X-ray and radio emission. The spatial separation between wavelengths, with X-ray toward the interior and radio toward the exterior, was interpreted as shock propagation into a strong density gradient.
The higher spatial resolution of Chandra allows us to detail the X-ray morphology and spectral properties of G272.2−3.2 to a higher degree than previously possible. The combination of spatial and spectral data provides a keen look into distinct interactions with the local ISM to characterize the X-ray emission in the outer shell region of this remnant. Furthermore, the higher resolution allows for the identification of distinct regions for spectral extraction that were not resolved with ASCA, ROSAT, Suzaku, or XMM. Our analysis refines current age estimates which vary from 2000 yr (Sánchez-Ayaso et al. 2013) to ∼15,000 yr (Harrus et al. 2001). We also include infrared data from the WISE to determine morphological correlations that would suggest interaction with local molecular clouds in the ISM. Finally, we perform a detailed study of the central region to verify the nature of the plasma and the Type Ia designation.
2. OBSERVATIONS AND DATA REDUCTION
SNR G272.2−3.2 was observed with the Advanced CCD Imaging Spectrometer (ACIS) on Chandra for 42 ks and 23 ks on 2008 August 26 and 27. The observations were archived as ObsIDs 9147 and 10572. The entire SNR was imaged on the four front-illuminated ACIS-I chips. These chips have decreased low energy response in comparison to the back-illuminated chips in ACIS-S, but the remnant fits neatly into the 2 × 2 ACIS-I array and lies near the galactic plane, suggesting high absorption and highly attenuated soft X-ray flux. The observation produced imaging with an unbinned spatial resolution of <1 arcsec.
The level 1 data were reprocessed to level 2 with standard processing procedures in the Chandra Interactive Analysis of Observations (CIAO, ver. 4.4; Fruscione et al. 2006) software package with current calibration data from the Chandra Calibration Database (CALDB, v.4.4.2). Good time intervals, charge transfer inefficiency, and time-dependent gain variation were accounted for. The reprocessed X-ray data are shown in Figure 1 as a false color RGB image. The data are binned to ∼4 arcsec pixel−1, then Gaussian smoothed with a kernel radius of 3 pixels. The energy ranges covered by the respective bands are 0.3–1.2 keV for red, 1.2–1.7 keV for green, and 1.7–3.0 keV for blue.

Figure 1. SNR G272.2−3.2 has been observed by Chandra and WISE, revealing hot central emission and a cool outer X-ray shell that is traced in the IR. An RGB image of the Chandra ACIS-I data is shown on the left with red representing X-ray energies between 0.3–1.2 keV, green for 1.2–1.7 keV, and blue from 1.7–3.0 keV. The X-ray emission extends to a radius of ∼7.4 arcmin or 10.8 pc, at a 5 kpc distance. The raw IR data from WISE at 22 μm is displayed on the right with nearly every infrared cloud correlating strongly to an X-ray feature. IR emission is also present at the locations of the optical filaments studied by Winkler et al. (1993), as indicated by the black arrows.
Download figure:
Standard image High-resolution imageInfrared images of G272.2−3.2 from the WISE All-Sky Data Release were obtained from the NASA/IPAC Infrared Science Archive (IRSA), corresponding to WISE Atlas tiles 1356m531, 1358m515, and 1380m531. These images provide an angular resolution of 12 arcsec and a minimum point source sensitivity of 6 mJy. In addition to the standard pipeline processing and basic cropping, the images were rescaled to a common intensity scale with the IRAF task mscimatch, which photometrically matches the brightness of background stars shared in multiple images. The images were then combined into a mosaic with the IRAF task mscstack to produce the final image at 22 μm, which is shown in Figure 1. Quoted fluxes are calculated according to the Explanatory Supplement to the WISE All-Sky Data Release Products and are based on measurements of atlas tile 1358m515 alone.
3. SPECTRAL EXTRACTION AND RESULTS
3.1. Radial Analysis
The striking image in Figure 1 paints the picture of a hot central region separated from a lower temperature shocked shell. There are bright knots, blobs, and filaments along the rim of the remnant. Broad diffuse emission fills much of the interior. Furthermore, the blue interior appears distinct and separated from the shell by a darker annulus between them. To study the apparent radial dependence on morphology, we extract annular regions as displayed on the left in Figure 2. The inner circle has a radius of 1.3 arcmin and the radial ranges of the first two annuli are both 1.3 arcmin as well. The third annular region attempts to follow the dark separation and has a radial range of 1.4 arcmin. The outermost region encompasses the shell and has a radial range of 2.1 arcmin. The regions outlined in red are subtracted from the data prior to spectral fitting. The two narrow rectangles forming the cross eliminate the chip gaps and data near the chip edges. The multitude of small red ellipses denote the position of point sources. These regions are determined using wavdetect in CIAO (Freeman et al. 2002). This tool finds sources in the data set by correlating the image with "Mexican Hat" wavelet functions. The tool then draws an elliptical region around the detected source to a specified standard deviation, σ, of the point spread function (psf). In the present case, the detection scales used are 2 and 4 pixels, and the region size is 3σ.
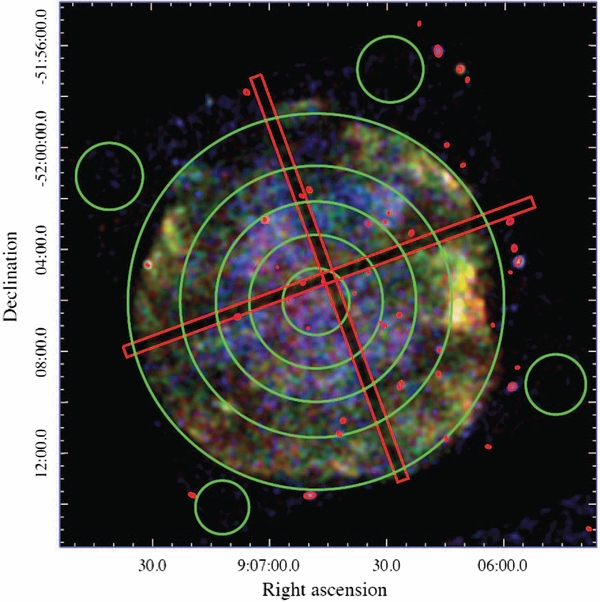
Figure 2. Spatio-spectral analysis reveals a hot plasma interior with progressively cooler components at larger radii. The green annular regions used for radial spectral analysis are shown overlaid on the RGB X-ray image. Regions outlined in red are subtracted from the data prior to spectral fitting. These include rectangular regions for the chip boundaries and small elliptical regions corresponding to detected point sources. The green circular regions at the corners of each chip are used for background subtraction.
Download figure:
Standard image High-resolution imageSpectra for each of the annular regions are extracted using the specextract tool in CIAO. This tool automatically creates ancillary response files and redistribution matrix files for each region. The extracted spectra were background corrected using four circular regions devoid of emission shown as circles in the corner of each CCD. The spectral resolution obtained by Chandra is ∼5–20 (E/ΔE) over the energy band used, 0.3–3.0 keV. In our analysis, data below 0.3 keV are not used due to uncertain ACIS calibration while data above 3.0 keV are consistent with zero. The data are binned to at least 20 counts per bin to allow the use of Gaussian statistics. To analyze the extracted spectra, we use the CIAO modeling and fitting package, Sherpa (Freeman et al. 2001).
Typically, X-ray emission in a diffuse SNR is caused by shock heating of ejecta or ISM, which results in prominent emission lines. Depending on the plasma density and the time since it has been shocked, we expect the emitting material to either be in collisional ionization equilibrium (CIE; if the plasma has high density or was shocked a long time ago) or in nonequilibrium ionization (NEI). We use the xsvnei model for nonequilibrium conditions (Borkowski et al. 1994, 2001; Hamilton et al. 1983; Liedahl et al. 1995). We replace the default xsvnei line list with an augmented list developed by Kazik Borkowski that includes more inner shell processes, especially for the Fe–L lines. Details of this line list may be found in Badenes et al. (2006). For equilibrium conditions we use the xsvapec model, which uses an updated version of the AtomDB code (v2.0.1; Smith et al. 2001; Foster et al. 2012) to model the emission spectrum. We include a second temperature component to these fits if it is determined statistically relevant as determined from an F-test (probabilities <0.05 indicate a statistical improvement given the additional component). Emission line lists in the 0.3–3.0 keV energy range for plasmas with temperatures kT ∼ 0.09–2.0 keV show that the emission is dominated by highly ionized states of C, N, O, Ne, Mg, Si, S, and Fe. The spectral fits begin with all abundances frozen to solar levels. A given element or combination of elements is allowed to vary if it significantly improves the fit as shown via F-test. Dielectronic recombination rates are taken from Mazzotta et al. (1998) with solar abundances from Anders & Grevesse (1989) and cross-sections from Balucinska-Church & McCammon (1992). In addition, we investigate the significance of a contribution from a non-thermal component by including a xspowerlaw model. In the shell, including a xspowerlaw model probes for the possibility of synchrotron emission due to swept-up magnetic fields, while in the interior it tests for the presence of a PWN in the case that the progenitor was a massive star. Given these possibilities, the resulting parent model is xsvnei+xsvapec+xspowerlaw. This is convolved with a multiplicative photoelectric absorption model, xsphabs, to account for the absorbing column of gas along the line of sight. All fits are nested within the parent model to allow the use of the F-test (see the ftest tool in Xspec; Arnaud 1996).
The best-fit models to the annuli are typically single temperature component nonequilibrium plasmas. The spectra with best fits overlaid are shown in Figure 3. They have been offset from one another for clarity, and to illustrate the progression of spectral shape as a function of radius. The center of the remnant and annulus 1 are well described by a high temperature, kT = 1.4–1.5 keV, nonequilibrium plasma. However, as we move into annulus 2, which encompasses the outer limit of the central emission, the temperature decreases substantially to kT = 0.87 keV. Another drop in temperature occurs as we continue into annulus 3. This region outlines the dark area between the central emission and the shell. Out in this shell, annulus 4 is best fit by a combination of a mid-temperature nonequilibrium plasma and a cool equilibrium plasma. The model parameters for the best fits are shown in Table 1. The fit errors signify the 68% confidence interval, or 1σ bounds, although the latter is merely used as nomenclature given that the errors are not normally distributed. These errors are calculated using the conf tool in Sherpa, which computes bounds for each model parameter while allowing other variable parameters to find their new best-fit values. Collisional plasmas at these temperatures are dominated by strong emission lines from astrophysically abundant elements. We identify the strongest lines in the AtomDB list for our range of temperatures and indicate their positions using vertical arrows labeled with the corresponding ion in Figure 3. The emissivities of O vii and Ne ix are negligible at higher temperatures while the same can be said for Si xiii and S xv at low temperatures. At lower temperatures there is a wealth of emission lines between ∼0.9–1.2 keV from a range of Fe ions, Fe xvii–Fe xx. Higher ionization states, Fe xix–Fe xxiv, are present between ∼0.7–1.2 keV at the higher temperatures. These ranges are denoted as horizontal lines in Figure 3.
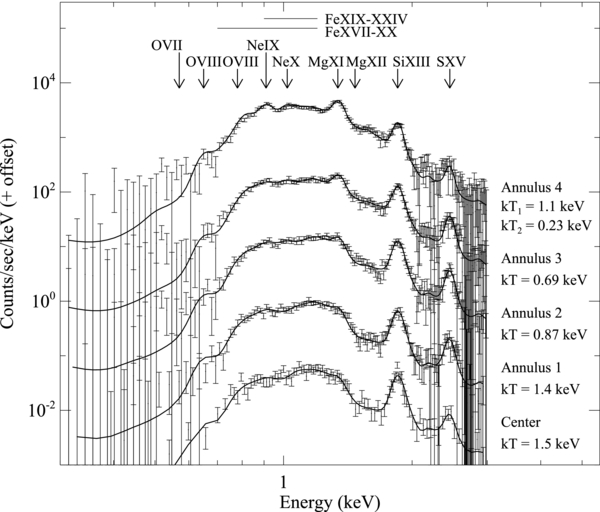
Figure 3. Inferred temperatures decrease with increasing radius until the shell (annulus 4), which has a markedly different spectrum from the interior. The extracted spectra are shown as the black data points with best fit models as solid black lines. The normalizations for each region have been offset using a multiplicative factor (1, 5, 50, 500, and 5000 for the center–annulus 4 regions, respectively) for visualization purposes. The energy values of prominent emission lines expected from the plasma models at our range of temperatures are shown as vertical arrows with corresponding ions. The energy ranges for the various Fe ion species expected at low temperature (Fe xvii–Fe xx) and high temperature (Fe xix–Fe xxiv) are shown as horizontal lines.
Download figure:
Standard image High-resolution imageTable 1. Best-fit Parameters for Annular Spectral Extraction Regions
| Region | χ2/ν | kTvnei | kTvapec | τ | normvnei | normvapec | NH | Counts |
|---|---|---|---|---|---|---|---|---|
| (keV) | (keV) | (1010 s cm−3) | 10−3Aa | 10−3Aa | (1022 cm−2) | per Region | ||
| Center | 82/89 |  |
... |  |
 |
... | 1.07 ± 0.04 | 5477 |
| Annulus 1 | 183/143 | 1.43 ± 0.03 | ... | 2.8 ± 0.2 | 0.53 ± 0.06 | ... | 1.07 ± 0.02 | 18619 |
| Annulus 2 | 257/161 |  |
... |  |
 |
... |  |
32777 |
| Annulus 3 | 179/172 |  |
... |  |
 |
... |  |
43979 |
| Annulus 4 | 175/176 |  |
 |
3.6 ± 0.2 |  |
 |
1.03 ± 0.02 | 87430 |
Notes. Errors quoted are 68% confidence levels. aNormalization parameter, where A = [10−14/(4πD2)]∫nenHdV. The integral is the volume emission measure and D is the distance to G272.2−3.2.
Download table as: ASCIITypeset image
The central abundances of heavy elements show departures from solar values. Best-fit elemental abundances for each radial region are given in Table 2. The center and annulus 1 are overabundant in Si, S, and Fe, relative to solar, at the ∼3σ–8σ level. The abundances of these elements are also heightened in annulus 2, but the values are more poorly constrained, and not as significant. Furthermore, in annulus 2, Ne and Mg are found to vary slightly from their solar values. We allowed Ne and Mg to vary in the center and annulus 1, but the simpler models with the abundances frozen to solar levels are clearly preferred based on F-tests (probabilities of 0.34 and 0.68, respectively). Furthermore, when they were allowed to vary, the best-fit abundances of Ne and Mg remain close to their solar level in these regions (e.g., Ne =  and Mg =
  for annulus 1, when thawed). Closer to the shell, annuli 3 and 4 have abundances consistent with solar levels in general, but display depletions in Mg, and also in Ne for annulus 3. The O abundances are loosely constrained toward the center and generally difficult to fit given the high absorption column and lack of low energy flux. As evident from the central spectra in Figure 3, the data bins pertaining to the O lines have a low number of counts leading to large errors in the best-fit values.
Table 2. Elemental Abundances for Annular Spectral Extraction Regions
| Regions | O | Ne | Mg | Si | S | Fe |
|---|---|---|---|---|---|---|
| Center |  |
1 | 1 |  |
 |
 |
| Annulus 1 |  |
1 | 1 | 2.9 ± 0.3 | 4.8 ± 0.5 |  |
| Annulus 2 |  |
2.5 ± 0.7 |  |
 |
 |
 |
| Annulus 3 |  |
 |
 |
 |
 |
0.9 ± 0.2 |
| Annulus 4 | 1.5 ± 0.1 | 1 | 0.80 ± 0.03 | 1 | 1 | 1 |
Notes. Abundances are given with 68% confidence level bounds, and shown relative to solar, with solar values = 1. A value of 1 indicates that allowing the component to vary does not significantly improve the fit as shown via F-test.
Download table as: ASCIITypeset image
In addition to our detailed radial extractions, we attempt to fit regions similar to the more coarse "center" and "outer" regions used in Sezer & Gok (2012) and Sánchez-Ayaso et al. (2013). Their center regions correspond to a combination of our center, annulus 1, and annulus 2, while their outer regions are similar to our annulus 3 plus annulus 4. We are unable to achieve a reasonable fit statistic ( ) for any combination of models in the combined central regions. This is most likely due to the various temperature components and ionization states present in the Chandra data over this span of radii. We do find a reasonable fit (
 ) to the combined annulus 3 and annulus 4 spectra using a single temperature nonequilibrium model with a temperature of kT = 0.76, very similar to Sezer & Gok (2012). However, the much better fits in our separate annulus 3 and 4 regions provide more detail to the disparate physical conditions that are apparent in the Chandra RGB image, but not present in Suzaku or XMM data. Merging these regions masks the importance of the low temperature equilibrium plasma in the shell.
3.2. Shell Emission
The evident shell in Figure 1 is dominated by the lower and middle X-ray energy ranges, with most of the higher energy blue emission closer to the center. As seen from the radial analysis, the best fit to the outer annulus includes a low temperature equilibrium plasma and a higher temperature nonequilibrium component. We investigate the plasma conditions in the shell by performing spectral extractions on discrete regions drawn around apparent knots and filaments. These enhancements could signify shocked clouds in a swept-up shell of ISM. Figure 4 displays our shell extraction regions overlaid on the RGB image.
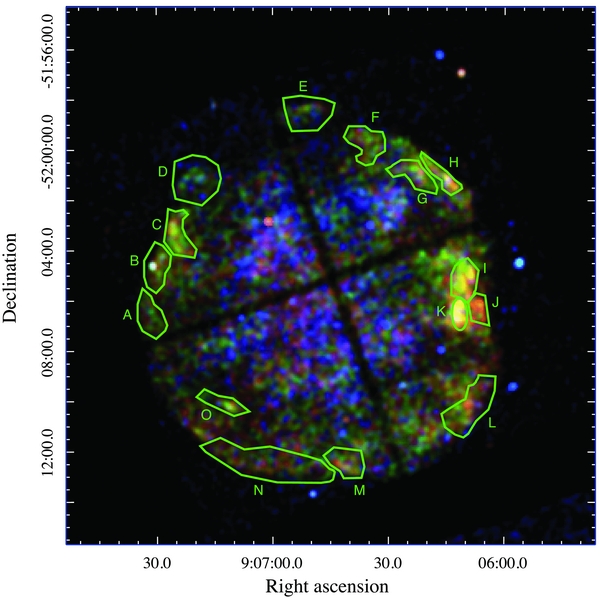
Figure 4. Our investigation of the filamentary features in the shell find a mix of low temperature equilibrium plasmas and higher temperature nonequilibrium plasmas. The regions pertaining to our extracted spectra are shown in green and are overlaid on the RGB image. We use the same background regions as the annular spectra.
Download figure:
Standard image High-resolution imageThe shell regions exhibit similar characteristics to annulus 4; low temperature equilibrium plasmas mix with higher temperature nonequilibrium plasmas. As with the radial analysis we attempt fits containing an equilibrium plasma, a nonequilibrium plasma, or some combination thereof, all with variable abundances. We also test for the presence of a nonthermal powerlaw component, but find no indication of such a component in any of the shell regions. Table 3 summarizes the best-fit parameters for the extractions. All spectra exhibit abundances typical of those in the ISM with a couple instances of depleted Si and Mg and one instance of a loosely constrained Si overabundance. Overall, these fits are consistent with varying equilibrium conditions and plasma temperatures in an ISM dominated medium.
Table 3. Best-fit Parameters for Shell Spectral Extraction Regions
| Region | χ2/ν | kTvnei | kTvapec | τ | normvnei | normvapec | NH | Si | Mg | Counts |
|---|---|---|---|---|---|---|---|---|---|---|
| (keV) | (keV) | (1010 s cm−3) | 10−3Aa | 10−3Aa | (1022 cm−2) | per Region | ||||
| A | 27/34 | ... |  |
... | ... |  |
 |
... | ... | 1453 |
| B | 49/39 |  |
... |  |
 |
... |  |
... | ... | 1671 |
| C | 48/56 |  |
... |  |
 |
... |  |
... | ... | 2277 |
| D | 79/56 |  |
... |  |
 |
... |  |
... | ... | 2983 |
| E | 53/39 | ... |  |
... | ... |  |
 |
 |
... | 2277 |
| F | 49/48 | ... |  |
... | ... | 5 ± 2 |  |
... | ... | 2133 |
| G | 43/49 | ... | 0.62 ± 0.03 | ... | ... | 0.40 ± 0.04 | 0.87 ± 0.03 | ... | ... | 2000 |
| H | 31/38 |  |
... |  |
 |
... |  |
... |  |
1504 |
| I | 77/68 |  |
... | 8 ± 1 |  |
... |  |
... | ... | 2756 |
| J | 42/36 | ... |  |
... | ... |  |
0.87 ± 0.05 | ... | ... | 1215 |
| K | 44/41 | 0.58 ± 0.03 | ... |  |
0.29 ± 0.03 | ... | 0.69 ± 0.03 | ... | ... | 1509 |
| L | 71/68 |  |
... |  |
 |
... |  |
0.6 ± 0.1 | ... | 3442 |
| M | 51/45 | 0.9 ± 0.3 | ... |  |
 |
... |  |
... | ... | 1955 |
| N | 116/91 |  |
... |  |
 |
... |  |
... |  |
5800 |
| O | 27/25 | 1.1 ± 0.3 | ... | 2.4 ± 0.7 |  |
... |  |
 |
... | 1142 |
Notes. Errors quoted are 68% confidence levels. Varied abundances are shown relative to solar, with solar values = 1. aNormalization parameter, where A = [10−14/(4πD2)]∫nenHdV. The integral is the volume emission measure and D is the distance to G272.2−3.2.
Download table as: ASCIITypeset image
4. DISCUSSION
4.1. Interaction with the ISM
4.1.1. Densities within the Shell
Calculations of shock velocity and density within the shell can be used to probe its physical characteristics. The morphology evident from the imaging and spectral analysis is dominated by shock heated ISM located in clumps and filaments along the rim. The presence of low temperature equilibrium plasma suggests the presence of slow shocks in dense media while faster shocks and lower densities are expected from the higher temperature nonequilibrium plasmas. Solving the Rankine–Hugoniot relations in the strong shock case with γ = 5/3 gives the post-shock temperature as a function of shock velocity, kT = (3/16)mv2/χ. The mass density is ρ = mn, and if we assume that n = nH + nHe = 1.1nH then m, the average mass per nucleus, is m = (1.4/1.1)mH. The number density of particles is weighted such that χ = (n + ne)/n, and is 2.3/1.1 for a fully ionized plasma (ne = 1.2nH). This results in m/χ ∼ 0.6mH, which is sometimes denoted as μmH. A fully ionized, shocked heated plasma can thermally equilibrate within a few hundred years or even more rapidly given higher densities (see Equation (36.37) in Draine 2011). We expect that Te ∼ Tion due to Coulomb collisions at a temperature of ∼106 K and ne ∼ 1 cm−3. However, at lower densities, it may take longer for the temperature of the electrons to catch up to the ion temperature. This may lead to underestimates in the calculated velocities given that the electron temperature is being used in the shock velocity equation. Therefore, the calculated velocities for equilibrium plasmas with high densities will be accurate while those for nonequilibrium plasmas will signify lower limits. The calculated velocities for the lower temperature equilibrium components range from 370–490 km s−1 with velocities of 620–970 km s−1 for the higher temperature nonequilibrium regions. These speeds are significantly decelerated from the initial blast wave velocity of >5000 km s−1. A shock heated shell composed of swept-up material and/or clumpy, ambient ISM would produce exactly such results with slow shock propagation speeds and rapid equilibration in higher density clouds interspersed with higher shock velocities, higher temperatures, and nonequilibrium conditions in more rarefied regions.
The picture of a clumpy shell is further supported by the densities found in these regions. Densities are calculated using the norm parameter where norm = [10−14/(4πD2)]∫nenHdV. The integral contains the emission measure for the plasma which is dependent on the density and total emitting volume. Following the considerations taken in the Harrus et al. (2001) study, we adopt 5 kpc for the distance to G272.2−3.2. Regions G, H, J, L, N, and O are somewhat rectangular, so we calculate the volume using a rectangle with the same area as the region and a depth equal to the long dimension of that rectangle. The remaining regions are more circular, so we use the volume of a sphere with a radius that approximates the size of the extraction region. The shape of the region does not bias the calculation given that we use the same region area. We also include a filling factor, f, such that V = 4/3πR3f, for example. This is an important factor given the uncertainties in the depth of the emitting region and exactly how much of the volume actually contains emitting plasma. In the equilibrium regions of A, E, F, G, and J we find relatively high electron densities of 1.0, 3.9, 1.5, 0.5, and 1.5  f−1/2 cm−3, respectively, where D5 is the distance in units of 5 kpc. The nonequilibrium regions are more rarefied with densities ranging from 0.13–1.1
  f−1/2 cm−3 giving an average density of 0.46
  f−1/2 cm−3. These values support the velocity calculations and the conclusion that we are tracing interactions within an inhomogeneous, clumpy shell.
The equilibrium densities are much higher than any previously reported while the nonequilibrium densities, ∼0.5 cm−3, are more consistent with previous studies (Harrus et al. 2001, ne ∼ 0.2–0.3 cm−3; Sezer & Gok 2012, ne ∼ 0.5 cm−3; Sánchez-Ayaso et al. 2013, ne ∼ 0.5 cm−3). However, each of the studies calculated their values based on a global fit over the entire volume of the SNR. The higher resolution Chandra data afford the possibility of tracing distinct shell interactions involving dense media. The integrity of shell features is maintained, enabling a more precise probe of densities. Other observatories blur these equilibrium features into the hotter, nonequilibrium regions, thus masking their importance. This has led to underestimated densities in the shell and conclusions that do not recognize the now evident shell morphology. Spatial analysis of the Chandra data show a clear, lower temperature shell and the spectral analysis detects higher density plasma in equilibrium, consistent with interactions in clumpy ISM.
4.1.2. Infrared Emission
Observations in the IR can be used to further bolster the idea of interactions with the ISM. The dust component of the ISM material present in the surrounding environment should be shock heated by the expanding SN blast wave, resulting in thermal IR emission. We utilize observations from WISE, which has spectral windows at 3.4, 4.6, 12 and 22 μm. The increased sensitivity of WISE in the mid-IR over IRAS should permit the exploration of structure at shorter wavelengths than could be studied by Harrus et al. (2001). To distinguish emission associated with the remnant from the diffuse IR background, the average background level and background variation σbkgd are determined by measuring the flux in an on-chip dark sky region free of point source contributions. The significance of the emission from the remnant can then be evaluated in terms of deviations from this background level in units of σbkgd.
No significant emission was detected from G272.2−3.2 in the 3.4, 4.6, and 12 μm bands. The lower two bands, 3.4 and 4.6 μm, are dominated by point-like stellar and galactic sources. Eliminating these contributions, the average flux detected from the remnant is <1σbkgd above that of the diffuse background for both bands. Hence, we place upper bounds on the total flux from G272.2−3.2 of <0.28 Jy for both bands. The 12 μm image reveals diffuse emission resulting from a complex IR environment in the vicinity of the remnant. Source confusion makes distinguishing between G272.2−3.2 and other IR emission in the field difficult. A comparison between the flux from G272.2−3.2 (as defined by the X-ray shell) and a surrounding annulus of thickness 1 arcmin shows <1σann difference between the sky regions, where σann is the measured variation within the annulus region. Thus, while the remnant may have associated 12 μm structure, it is indistinguishable from the average emission of the infrared environment surrounding the remnant.
G272.2−3.2 is clearly observed in the 22 μm band. The 22 μm image can be seen in Figure 1, while in Figure 5, the X-ray image with an overlay of 22 μm contours is shown. While the 22 μm raw data are visually suggestive of a nearly complete IR shell, we limit our analysis to emission detected in 5σbkgd excess of the average background flux so as to separate the IR structure of the remnant from the background. The total observed flux from the remnant at 22 μm, as measured from comparison to the dark sky background, is 15.0 ± 0.3 Jy. This is roughly consistent with the non-detection of G272.2−3.2 by Harrus et al. (2001) using the IRAS 25 μm band, since a significant fraction of the emission is concentrated in elongated filamentary structures and the expected IRAS sensitivity for extended sources of this size is consistent with our observed flux.

Figure 5. Spatial correlation between X-ray bright and infrared bright regions is revealed in the Chandra RGB image with contours of 22 μm emission overlaid. The significance of the 22 μm emission is determined in units of σbkgd, where σbkgd is equal to the variance measured in the dark sky background. The contours shown are at levels of 5, 6, 7.5, and 10σbkgd above the dark sky background average. To assess the correlation between X-ray bright features and IR filaments along the remnant boundary, flux profiles are measured along seven radially projected lines originating from the center of the annuli used in Figure 2. The boxes represent the regions in which the X-ray and IR radial flux profiles are measured and have a 15 arcsec thickness over which the profile is averaged for each radial bin. The vectors specify the radial direction used for each flux profile and are labeled according to which X-ray spectral analysis region(s) each vector passes through.
Download figure:
Standard image High-resolution imageThe 22 μm flux measurement from the present work, in addition to the 60 and 100 μm flux measurements from Harrus et al. (2001), permits the comparison between G272.2−3.2 and the IR emission of other SNRs. Borkowski et al. (2006b) observed four Type Ia SNRs in the Large Magellanic Cloud at 8 μm using the Spitzer Infrared Array Camera and at 24 and 70 μm using the Spitzer Multiband Imaging Photometer. They find no detectable emission at 8 μm from any of the remnants they examine. Similar to Borkowski et al. (2006b), we attribute our non-detections in the short wavelength, 3.4, 4.6, and 12 μm, WISE bands to small grain destruction, as emission from small grains and polycyclic aromatic hydrocarbon features would be the dominant contribution to these bands. In addition, Borkowski et al. (2006b) use the 70/24 μm ratio to calculate dust temperatures and total dust mass using a collisionally heated dust model, with a preshock grain size distribution from Weingartner & Draine (2001). Measurements of the WISE 22 μm and the IRAS 60 and 100 μm fluxes allows the construction of an interpolated 70/24 μm flux ratio for comparison. We subtract dark-sky backgrounds from the 60 μm and 100 μm IRAS data to calculate a 60/22 μm flux ratio of 4.3 and an interpolated 70/24 μm flux ratio of 6.6. Thus, of the remnants Borkowski et al. (2006b) examine, G272.2−3.2 is spectrally most similar to DEM L71, which has an observed 70/24 μm ratio of 5.1. The X-ray emission from DEM L71 is very similar to G272.2−3.2. It exhibits a hot, centrally filled morphology and a strong shell containing shocks with velocities of several hundred km s−1. The plasma conditions are similar as well with a global electron temperature of 0.65 keV and ionization timescale of ∼1011 cm−3 s. In modeling DEM L71, Borkowski et al. (2006b) find that grain sputtering is essential for replicating the observed 70/24 μm ratio. Given the importance of sputtering in DEM L71 and the non-detection of the remnant at 3.4, 4.6, and 12 μm, we conclude that a significant fraction (∼30%–40%, based on the IR emission model for DEM L71) of small dust grains (<0.01 μm) have also been destroyed in G272.2−3.2. Furthermore, from the comparison with DEM L71, we can infer a probable dust temperature of 60 K for the shock heated, thermally radiating large grain population (>0.01 μm) responsible for the observed 22 μm emission.
4.1.3. X-Ray/IR Correlation
Bright IR features are observed to overlap with many of the X-ray spectral analysis regions. A, C, D, E, F, G, H, J, K, M and N all contain 22 μm emission in 5σbkgd excess of the background level. That the 22 μm and X-ray features are well correlated is strongly suggestive of interactions between the ISM and the SN blast wave. However, some small scale separation between the X-ray and IR features would be expected, as the dense, dust-rich ISM is swept up by the blast wave and hot, rarified material remains in the interior of the remnant. To examine this spatial correlation in finer detail, the IR and X-ray emission profiles are measured along radial lines which begin at the remnant center and pass through the analysis regions of interest. The radial flux profiles are averaged over a 15 arcsec width in order to avoid sampling small, spuriously bright knots of ejecta or ISM material. An image showing the radii used for this correlation is shown in Figure 5. The six radial flux profiles passing through analysis regions A, C, D, E, G/H, and J/K, are plotted in Figure 6. For ease of reference, we will hereafter refer to the radial flux profile through a given X-ray analysis region "X" as Radial X. Radial F was also measured but is similar to Radial A, C, D and thus is not shown, while Radial M and N both have non-negligible point source contributions at 22 μm, which prohibits extended spatial analysis.
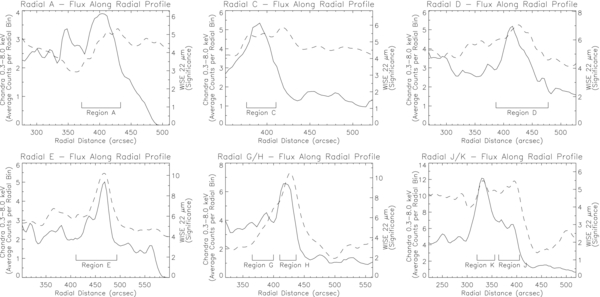
Figure 6. Extracting the X-ray and IR flux profiles along radial lines through IR bright features shows that the emission is well-correlated, with the peak of the IR emission typically lying just radially exterior to the peak in the X-ray emission. The X-ray radial flux profiles are plotted in units of average counts per radial bin (solid lines), while the IR flux profiles (dashed lines) are measured in significance, equal to the strength of the emission above background in units of σbkgd. The location of X-ray analysis regions lying along the radial profiles are denoted with labeled brackets. These profiles trace blast wave/ISM interactions that have shock heated the swept-up ISM material.
Download figure:
Standard image High-resolution imageIn general, the radial extractions exhibit an X-ray peak at the limb of the remnant with emission rapidly falling off at higher radii while the IR emission peaks at a slightly larger radius and extends to higher radii. The region of brightest 22 μm emission is along Radial G/H and is our canonical example of the X-ray/IR correlation due to the lack of confusion in both X-ray and IR images. The sharp X-ray peak in Radial G/H is located at a radius of ∼415 arcsec with dimmer emission toward the interior of the remnant. The X-ray emission declines sharply outward and the IR emission peaks at a radius >10 arcsec to the exterior of the X-ray peak. Proceeding outward, the IR emission eventually falls off as well given that the material present at this radial extent has not yet been shocked. Small differences in this trend are likely due to local variations in the blast wave/ISM interaction, or due to source confusion evident in the complex IR morphology.
Radial E is a unique example as it passes through a large, roughly triangular region of significant IR emission in the northern section of G272.2−3.2. Figure 5 shows that the IR and X-ray are anti-correlated in the north with the X-rays being particularly dim in comparison to the rest of the remnant. A large molecular cloud (length scale ∼3–5 pc) appears to "cap" G272.2−3.2. We infer that the interaction between the remnant and the "cloud cap" is responsible for heating the dust component to thermally emit in the IR. The absence of X-ray emission in the same region is due to extinction in this cloud. Region E encompasses the only X-ray bright region within the cloud cap and its X-ray spectral fit is consistent with a very high density local environment as it is an equilibrium plasma with the coldest electron temperature, the highest emission measure, and the highest column density of any of the spectral analysis regions examined in G272.2−3.2. Nevertheless, region E must represent a local density minimum within the cloud cap or be observable through a geometrical effect in order to be consistent with our interpretation that the presence of the cap is responsible for suppressing X-ray emission in the north.
4.1.4. ISM Cloud/Shock Interaction
The nearly circular shape of G272.2−3.2 is noticeably indented on the western edge. This suggests that the SN shock may have encountered a particularly large and/or dense feature leading to this morphology. Our region J is located at the very edge of the X-ray emission along the area that appears the most indented. As shown in Figure 5 and on the bottom right of Figure 6, this region corresponds to an IR feature. The X-ray emission is noticeably red, cool, and dense as expected from an interaction with a local ISM cloud in the limb. The K region located just to the interior is the location of the brightest X-ray knot and one of the optical filaments studied by Winkler et al. (1993). This region is hotter, more rarefied and not in equilibrium. The X-ray plasma has likely been more recently heated by a reflected shock propagating inward from the cloud/shock interaction in J. The strong radio emission in this area, while previously correlated to the optical emission in K, must lie nearer to the edge in region J. The centers of these two regions are only separated by 50 arcsec which is equivalent to the beam sizes used in Duncan et al. (1997). Also, Sánchez-Ayaso et al. (2013) present 843 MHz contours in this region that are indeed exterior to the strongest X-ray emission and the Hα filament. Both Sánchez-Ayaso et al. (2013) and Harrus et al. (2001) have argued for possible cloud/shock interaction in this area based on morphology. These Chandra data allow for a more precise view of this interaction and have enabled us to isolate a specific interaction site in region J. In combination with the WISE data, this study now shows that the IR emission and X-ray plasma conditions are consistent with a cloud/shock interpretation on the western edge.
ISM cloud/shock interactions have been studied in other SNR. McEntaffer & Brantseg (2011) investigated a similar indentation along the eastern edge of the Cygnus Loop. The shell morphology of this SNR is the result of a cavity explosion where the SN blast wave has recently encountered the clumpy, inhomogeneous cavity wall leading to emission across all wavelengths. A particularly dense knot of material is located along the eastern edge. The X-ray spectra in this region also show low energy, low temperature, high density, equilibrium plasmas at the limb of the remnant while interior nonequilibrium plasmas are lower density and higher temperature as a result of reflection shock heating. This pattern of X-ray plasma conditions is typical of cloud/shock interactions, which are common in SNR that are undergoing complex interactions with their anisotropic environments, such as G272.2−3.2.
4.2. Origin of the Thermal Interior
Previous studies (Harrus et al. 2001; Sezer & Gok 2012) have supported a cloud evaporation model to explain the hot thermal component at the center of G272.2−3.2. In this model, cold dense clouds are slowly destroyed by the surrounding shock heated plasma within the remnant's interior. This results in a centrally peaked X-ray morphology, which is why the model has been used to study thermal composite SNR (Long et al. 1991). The timescale over which cloud evaporation takes place is dependent on various factors such as cloud density, cloud composition, the overall mass in clouds versus plasma, and plasma temperature (White & Long 1991). The evaporation timescale can be quite long, and for a given set of parameters, the model produces a radial temperature profile that is flat. The Harrus et al. (2001) study is able to fit their extracted radial temperature profile with the cloud evaporation model, although best-fit temperature errors are large and incapable of distinguishing between various evaporation model parameters. The emission profile predicted from the model matches their extracted profile in the most centrally peaked quadrant of the remnant. However, the model fails to match the emission profile of other, less centrally peaked quadrants. The Sezer & Gok (2012) study did not run a version of the cloud evaporation model, but agree with the general predictions. They find a best-fit, radial temperature profile that varies by <0.06 keV and a centrally brightened morphology. Therefore, while some results are consistent with predictions from the cloud evaporation model, no conclusive evidence has been found to strongly support the presence of cool dense clouds at the center of G272.2−3.2.
We conclude that the cloud evaporation model is not consistent with interpretation of the higher resolution Chandra data. First, we detect a decrease in temperature with radius (see Table 1), not a flat temperature profile. This temperature dependence is already evident in the tri-color image with harder emission in the center and softer emission at higher radii. The ability to distinguish these distinct temperature regions allows for a radial profile that suffers far less from mixing between different temperature regimes, which may be present in lower spatial resolution extractions. Furthermore, we are able to produce good spectral fits while varying ionization timescale and elemental abundances. The Harrus et al. (2001) and Sezer & Gok (2012) studies fit their radial regions with nonequilibrium models at a fixed ionization timescale, and fixed abundances, without a discussion on the quality of the fits. Our method provides a more detailed description of the plasma properties in the remnant interior. Second, the Chandra data are not centrally peaked. From our annular spectral fits we calculate a total unabsorbed flux of ∼1.0 × 10⁻¹¹ erg cm−2 s−1 from 0.3–3.0 keV, for the entire remnant, consistent with Harrus et al. (2001). The annular contributions to this flux are shown in Table 4. The surface brightness in the central regions (center, annulus 1, and annulus 2) actually increases with radius, and does not support a centrally brightened morphology. Furthermore, there is significant flux at the limb of the remnant which is resolved into a shell in the Chandra data, which was not evident in these previous studies. The remnant morphology is more consistent with a typical shell remnant with a filled interior as opposed to merely a centrally peaked morphology. For these reasons, we do not support a cloud evaporation model for G272.2−3.2.
Table 4. Flux Values for Annular Regions
| Region | Total Unabsorbed Flux | Region Area | Surface Brightness |
|---|---|---|---|
| (erg cm−2 s−1) | (arcmin2) | (erg cm−2 s−1 arcmin−2) | |
| Center | 3.1 × 10⁻¹³ | 5.4 | 5.7 × 10⁻¹⁴ |
| Annulus 1 | 1.1 × 10⁻¹² | 16 | 6.5 × 10⁻¹⁴ |
| Annulus 2 | 1.8 × 10⁻¹² | 27 | 6.8 × 10⁻¹⁴ |
| Annulus 3 | 2.2 × 10⁻¹² | 41 | 5.3 × 10⁻¹⁴ |
| Annulus 4 | 4.3 × 10⁻¹² | 82 | 5.3 × 10⁻¹⁴ |
Download table as: ASCIITypeset image
The presence of a hot, central thermal component can be described using the canonical SNR evolutionary model modulated by thermal conduction. The Sedov self-similar model for SNR evolution (Sedov 1959) predicts that expansion of the remnant results in an evacuated, hot interior. The ambient density is swept up and compressed behind the shock front, which eventually expands to a point where radiative losses in the post-shock plasma become important. This typical evolution of a blast wave in a low density, isotropic medium creates a shell type remnant with a vacuous interior. Several studies have shown that this evolution is altered when considering the effects of thermal conduction (Cui & Cox 1999; Shelton et al. 1999; Shelton 1999; Cox et al. 1999, and references therein). As Cox et al. (1999) points out, heat transport away from the interior via thermal conduction can decrease the specific entropy, and thus, decrease the expansion of internal material expected from the drop in pressure behind the outward moving shock. In the presence of unquenched thermal conduction, the remnant interior density remains significant and constant throughout the interior. The temperature profile is flat, as well. If the efficiency of conduction is reduced then the temperature profile decreases with radius while density increases. These characteristics are the reason the thermal conduction model has been considered for thermal composite remnants, such as G272.2−3.2, and has been shown to successfully reproduce the observed plasma properties of another thermal composite remnant, W44 (Cox et al. 1999; Shelton et al. 1999).
We can compare the predictions of the thermal conduction model of Cox et al. (1999) to the conditions we find in G272.2−3.2. First, we consider the morphology of G272.2−3.2 and note that the central four annular regions contain the internal hot phase of this remnant, and are best suited to test the thermal conduction model. The shell may contain regions that are similar to a shell expected from Sedov-like propagation through an isotropic medium, and therefore provide insight to model predictions, but may also be confused by density enhancements from ISM clouds. Our best-fit emission measures give densities of 0.078, 0.097, 0.12, and 0.26  f−1/2 cm−3, for the center, annulus 1, annulus 2, and annulus 3, respectively. The volume of each region is calculated as the integrated volume from the section of a 10.8 pc radius sphere within each annular region. Therefore, our decreasing temperature profile and increasing density profile is indicative of thermal conduction that is <100% efficient. Cox et al. (1999) present analytic expressions for the physical characteristics expected at the time when the SNR forms a cooling shell. These are supported by results from their numerical hydrocode studies. They find that the residual central density is 13% of the original ambient density. In our case, the electron density in the center region gives a central density of 0.094 cm−3, for a fully ionized plasma. This amount of residual plasma could be the result of shock propagation through an ambient medium of 0.72 cm−3, in the presence of thermal conduction. In comparison, the central and ambient densities found in W44 are 0.7 cm−3 and 5.5 cm−3, respectively (Cox et al. 1999). Therefore, the presence of plasma at the densities we observe is not abnormally high and the existence of a central thermal component in G272.2−3.2 is quite natural, given conduction.
We can also use the Cox et al. (1999) analytic expressions to predict the shell properties of G272.3.2 based on our central density and compare these values to what we actually observe. We can express the central pressure as PC = χnCkTC, which is 4.7 × 10⁻¹⁰ dyne cm−2 for conditions in the center region. This gives a shock pressure of PS = PC/0.31 = 1.5 × 10⁻⁹ dyne cm−2. The shock velocity can be expressed as  , where no is the ambient density of 0.72 cm−3 found above. This gives an expected shock velocity of 360 km s−1 and post-shock temperature of 0.15 keV for a cooling shell. These predicted values are consistent with the coolest plasma conditions found within the shell. The average temperatures in the shell regions are somewhat higher with kTavg ∼ 0.7 keV for the nonequilibrium components and kTavg ∼ 0.3 keV for equilibrium components. To bring the prediction more in line with our measurements and realize a factor of four increase in the predicted temperature, we would need a factor of two increase in the predicted shock velocity. This requires a factor of four increase in the central temperature, which can easily be accounted for. We are assuming that the electron temperature from our spectral fits is representative of the central plasma. If thermal equilibration is not complete then the ions could easily have a factor of four larger temperature. Also, turbulent magnetic fields near the center could mix temperature components, thus aiding conduction and resulting in a lower central temperature, and hence, a lower predicted post-shock temperature. The diffuse, filled center radio morphology observed by Duncan et al. (1997) could be indicative of this effect. Therefore, given the reasonable densities calculated in the center region, and the close predictions of the analytic model applied to our plasma conditions, we conclude that a model of Sedov evolution modulated by thermal conduction can describe the conditions we observe in G272.2−3.2.
4.3. Age of G272.2−3.2
We can estimate the age of the remnant from our observed plasma conditions. First, we can use the equilibrium shock velocities and assume that the remnant can be described by a Sedov solution. In this case, the time since shock heating can be calculated as t = (2/5)R/v, where R is the estimated shock distance from the center, 10.8 D5 pc. The calculated ages range from 8800 to 12,000 D5 yr, consistent with the ∼6000–15,000 yr calculation from Harrus et al. (2001), but considerably older than the ∼6000 yr upper limit in previous studies. The discrepancy with the latter is most likely due to the assumption of a Sedov type evolution of shock propagation into an isotropic, low density medium, and the assumption that the equilibrium regions trace this evolution. The presence of ISM clouds in a shell, perhaps already present in a precursor cavity created by the progenitor stellar wind, lead to rapid shock deceleration and a possible overestimate of the age. Alternatively, we can use the ionization time scale, τ = net to determine the time since shock heating of the nonequilibrium plasmas in the shell. When considering regions with well constrained ionization parameters (not consistent with zero at the >4σ level; B, H, I, L, and N) the ionization times range from 3600 to 10,000  f1/2 yr with an average of 6300
  f1/2 yr, which is probably more representative of the age of the shell emission. This is consistent with the age obtained from the nonequilibrium fit from annulus 4 which gives an ionization time of 6700
  f1/2 yr.
A comparison between the ionization timescale at the center versus that in the shell provides an age determination of G272.2−3.2. The time since shock heating for the center region is 11,000  f1/2 yr. A strong shell morphology combined with hot interior plasma raises the possibility that the hot, nonequilibrium interior conditions are caused by a reverse shock originating from the ISM interaction at the SNR limb. This is similar to the morphology seen in other thermal composite SNR such as Kes 27 (Chen et al. 2008). However, if this were the case, then the time since shock heating should be much smaller, not larger than that found in the shell. An age of 11,000
  f1/2 yr at the center and 6300
  f1/2 yr at the limb located 10.8 D5 pc away suggests an average shock speed of 2200
  f−1/2 km s−1 if both plasmas were created by the same shock, reasonable for a SN explosion. Therefore, instead of a reverse shock scenario, it appears that the interior has only been shocked once and at a time prior to interactions in the shell. Although 11,000 yr is a rather long time for a plasma to reach equilibrium, it is reasonable given the low density observed in the central region. Furthermore, the measured ionization time scales are all <1011 s cm−3 where ∼ a few 1012 s cm−3 is expected for a plasma to reach equilibrium (Smith & Hughes 2010), especially in the case of heavier ions such as Si, S, and Fe, from which much of the fit is derived. If we use our calculated density for the center region, then we would expect equilibrium in ∼106 yr, much greater than the ∼104 yr observed. The central, hot plasma is still present due to thermal conduction, as discussed above, with ongoing equilibration leading to the filled, diffuse morphology. This suggests that the most accurate age estimate that we can make from these G272.2−3.2 Chandra data should be consistent with the central ionization timescale, ∼11, 000
  f1/2 yr.
Our age estimate is older than those found in some previous studies. Sezer & Gok (2012) calculate an age of 4300 f1/2 yr using their observed density and ionization timescale. However, the parameter values were taken from their global fit to the remnant which assumes that the entire remnant was shocked at the same time and is equilibrating at the same rate. This is not the case for G272.2−3.2, which has a variety of densities and ionization states throughout the remnant. Averaging over plasmas shocked long ago with more recently shocked plasmas leads to a decreased age determination since the age of the remnant is more closely estimated by the earliest shocked plasma. The Sánchez-Ayaso et al. (2013) study provides an age estimate of 2000 yr, but again derives this from the density and ionization timescale of a global fit. They revise their estimate upward to ∼3600 yr based on a consideration of probable shock velocities, but again rely on a post-shock temperature obtained from the global fit. The obvious temperature profile of G272.2−3.2 precludes the use of an average temperature to calculate the current shock velocity and hence the age from a Sedov solution. Averaging temperature components deemphasizes slower shocks and older ages, again resulting in an underestimate. The 11,000  f1/2 yr estimate obtained here is more consistent with that found in Harrus et al. (2001). Applying a Sedov model to their findings, the authors calculate an estimated age between 6250–15,250 yr, bracketing our estimate nearly symmetrically.
4.4. Evidence for Type Ia
The enriched Fe ejecta suggest a Type Ia origin for G272.2−3.2. Based on a study of its morphology, Lopez et al. (2011) agree with this classification, while Sezer & Gok (2012) find similar overabundances and conclude that a Type Ia progenitor is most likely. We perform a point source analysis on the remnant, and while we find several regions that are consistent with a Chandra psf, none have significant flux to spectrally verify a compact object origin. Furthermore, there are no features surrounding these sources that suggest a possible pulsar such as a PWN or associated bow shocks, cometary tails, etc. Our spectral fits find no contributions from nonthermal components anywhere in this remnant. The radio study by Duncan et al. (1997) also concludes that there is no evidence of plerionic emission in this object. All of these findings support a Type Ia classification.
Following the analysis performed by Sezer & Gok (2012), we consider the overabundances found in our fits to determine if they are consistent with the Nomoto et al. (1997) models of a Type Ia SN. Table 5 shows the theoretical abundances of ejecta based on nucleosynthesis yields from a carbon deflagration explosion model (W7 in Nomoto et al. 1997) and a delayed detonation model (WDD2 in Nomoto et al. 1997). We also list our calculated values for O, Ne, Mg, Si, S, and Fe. These are an average of the best fit abundances from the center, annulus 1, and annulus 2. The 1σ errors are propagated to provide error bars for comparison. As explained previously, the abundances of Ne and Mg are consistent with solar in the center and annulus 1, but varied in annulus 2. We maintain the annulus 2 68% confidence (1σ) fit errors here. The ratios of S/Si and Fe/Si that we find are consistent with Type Ia nucleosynthesis yields, further suggesting a Type Ia classification for G272.2−3.2. However, neither the S ratio or the Fe ratio provides discrimination between carbon deflagration and delayed detonation.
Table 5. Comparison of Best-fit Abundances to Nucleosynthesis Yields of Supernovae from Nomoto et al. (1997)
| Element Ratio | Best-fit Abundances | W7 Model | WDD2 Model | Type II Model |
|---|---|---|---|---|
| O/Si |  |
0.07 | 0.02 | 1.3 |
| Ne/Si | 0.3 ± 0.2 | 0.005 | 0.001 | 0.8 |
| Mg/Si |  |
0.06 | 0.02 | 0.9 |
| Si/Si | 1.0±0.2 | 1 | 1 | 1 |
| S/Si |  |
1.1 | 1.2 | 0.7 |
| Fe/Si |  |
1.6 | 0.9 | 0.3 |
Download table as: ASCIITypeset image
Although the above factors argue for a Type Ia progenitor, other elemental abundances present challenges to this classification. The presence of abundant O is peculiar and more consistent with expected yields from a core collapse SN. The O abundances are poorly constrained in each region though, and the O/Si ratio is consistent with Type Ia yields at the 3σ level. As seen in Figure 3, the O lines occur at low energies where the large absorption column results in strongly decreased line fluxes and increased fitting uncertainties in O abundance. Therefore, we do not view the increased O abundance as a strong detractor to a Type Ia classification. Next, the solar abundance levels of Ne and Mg found in the center and annulus 1 are already above expectation for Type Ia nucleosynthesis. Using the 1σ errors from the annulus 2 fit show that the average Ne and Mg ratios are indeed higher than expected for the Type Ia models, but within 1σ–2σ given their poor constraints. The presence of higher levels of Ne and Mg could be driven by line of sight contributions from plasma in the shell. In fact, inspection of the annular spectra in Figure 3 show that the plasma at the center and annulus 1 (and likewise the blue band of the Figure 1 RGB image) are dominated by the strong lines from the He-like species of Si xiii at ∼1.8 keV and S xv at ∼2.5 keV. The lower energy emission in these regions is dominated by the complex of Fe L-shell emission lines between 0.8–1.2 keV, which is evident by the red band visible in the interior. However, as we move outward toward annulus 4 the overabundances of these species decreases while we see an increase in the contribution of ISM plasma, particularly at lower energy. This contribution is evident as a strengthening in Ne ix at ∼0.9 keV, Ne x at ∼1.0 keV, and Mg xi at ∼1.3 keV, while the higher energy lines of Si, and S decrease. The strong Ne and Mg lines in the shell are contributing to the flux in the central regions, which leads to an overabundance of these species relative to Type Ia nucleosynthesis expectations. Therefore, the abundances derived from our fits are not inconsistent with a Type Ia progenitor interpretation.
The complex environment of G272.2−3.2 also argues against a Type Ia classification. The long lifetime of a low mass system should allow for stellar winds to dissipate local clouds. However, the IR data show the obvious presence of dense, dusty molecular clouds throughout the circumstellar environment. This phenomenon can be explained if G272.2−3.2 is a member of the class of remnants originating from "prompt" Type Ia SNe (Aubourg et al. 2008). Other members of this class include SNR 0104-72.3 (Lee et al. 2011), DEM L238 and DEM L249 (Borkowski et al. 2006a). Each of these remnants, along with G272.2−3.2, show overabundant Fe, bright central X-ray emission, and associated optical/IR emission near the shell due to shock heated interstellar clouds. The complex environment combined with the ejecta nucleosynthesis yields suggest that G272.2−3.2 may have originated from a prompt Type Ia SN.
5. SUMMARY
The superior spatial resolution of Chandra has revealed a hot, central, thermal plasma surrounded by a cool, clumpy shell of X-ray emission for the SNR G272.2−3.2. Our analysis of these data has demonstrated the following:
- 1.Investigation of the plasma conditions within the shell show interactions with an inhomogeneous ISM.
- 2.Strong correlations between X-ray and IR features trace the shell interactions.
- 3.A particularly bright region in the western limb results from a shock/cloud interaction.
- (a)The equilibrium plasma is located in the denser cloud wall while a higher temperature nonequilibrium plasma results from a reflected shock reheating interior plasma.
- (b)Associated radio, optical, and infrared correlations also signify interaction with an ISM cloud.
- 4.The brightness profile shows that the morphology is not centrally peaked as previously thought.
- 5.Radial analysis demonstrates a decreasing temperature profile and increasing density profile with radius.
- 6.The interior conditions are not consistent with cloud evaporation and can be explained through Sedov evolution modified by thermal conduction.
- (a)The observed central density of ∼0.1 cm−3 gives an ambient density at the time of explosion of ∼0.7 cm−3.
- (b)Predictions of conditions in the shell using the thermal model are consistent with observations.
- 7.The age of G272.2−3.2 can be estimated from the ionization timescales present in the remnant.
- (a)A comparison between the time since shock heating of the center, 11,000
 f1/2 yr, and the shell, 6300 f1/2 yr, show that the SNR characteristics can be described by propagation of a single shock.
 - (b)The best age estimate from these data is consistent with the time since shock heating of the central plasma, 11,000 f1/2 yr.
- 8.G272.2−3.2 originates from a Type Ia SN.
- (a)Abundances of heavy elements are consistent with expected nucleosynthesis yields.
- (b)There is no evidence for a central compact object or PWN in X-ray or radio.
- (c)The complex environment of G272.2−3.2 places it within the prompt Type Ia SNR subclass.


The authors would like to thank the anonymous referee for their extremely valuable suggestions and comments. We would like to acknowledge internal funding initiatives at the University of Iowa for supporting Mr. Grieves and Mr. DeRoo during this work. Mr. Brantseg is supported by NASA grant NNX10AN16H. The X-ray data used here were obtained from the Chandra Data Archive. In addition, this publication makes use of data products from the Wide-field Infrared Survey Explorer, which is a joint project of the University of California, Los Angeles, and the Jet Propulsion Laboratory/California Institute of Technology, funded by NASA.