


ABSTRACT
We report the results of a medium-narrowband 2 μm line survey covering 5.8 deg2 near the Galactic plane. We confirm 11 new field Wolf–Rayet stars along three lines of sight probing the inner Galaxy, demonstrating the capability to uncover distant and highly reddened populations of Galactic wind-borne emission-line stars suffering extinction as high as AV ∼ 40 and as distant as 9 kpc down to modest magnitude limits of Ks ∼ 12.5. All stars are of subtype WC7–8, with median distance d = 6 kpc and median extinction  = 2.5. Over the fields surveyed, the density of Wolf–Rayet stars to limiting magnitude Ks ∼ 12.5 was found to be 1.9 deg−2. We compare this to models which predict their distribution within the Galaxy and find that, even neglecting survey and subtype incompleteness, they consistently underpredict the number of newly discovered stars along the surveyed lines of sight.
Export citation and abstract BibTeX RIS
1. INTRODUCTION
The importance of Wolf–Rayet (WR) stars in the context of high-mass star formation is difficult to overstate. As an example, in the nearby Galactic H ii region NGC 3603, WR stars comprise less than 5% of the total stellar mass, but are responsible for 20% of the ionizing photons, 100% of the high-energy photons above 4 Ryd, and 60% of the kinetic energy injected into the interstellar medium (Crowther & Dessart 1998; Schnurr et al. 2008). In terms of mechanical energy input and chemical enrichment, WRs play as important a role as supernovae in regions of active star formation, with each WR star emitting ∼2 × 1051 erg s of mechanical energy, ∼10% of their total energetic output, over their lifetimes.
WR stars provide exceptional tracers of ongoing stellar formation. The short lifetime of the massive O star progenitors of WRs (∼3–7 Myr), and well-constrained onset epoch and duration of the WR phase (10% of the parent O star's lifetime, ∼0.5 Myr) make them excellent chronometers, while the extreme dependence of WR evolution and subtype distribution via their winds on blanketing networks of ultraviolet iron-group lines make them sensitive metallicity indicators. High luminosities (L ∼ 106 L☉) have permitted WR features to be observed in the aggregate spectra of star-forming galaxies, defining a heterogeneous class of "Wolf–Rayet galaxies" (Schaerer et al. 1999). The association of WR stars with long-duration gamma-ray bursts is also compelling (e.g., Woosley & Heger 2006), and WR stars have been found in gamma-ray burst host galaxies out to redshift z ∼ 0.7 (Han et al. 2010). Yet much remains to be understood regarding the WR phenomenon, its dependence on intrinsic stellar birth parameters such as metallicity and rotation, and the rate of occurrence of massive stellar outflows among different populations of massive stars within the Galaxy. The latter fact is accentuated by the diversity of stellar evolutionary phase in which the WR phenomenon can exist, including massive hydrogen-burning stars on the main sequence, central stars to planetary nebulae (e.g., Gorny & Stasińska 1995), and during helium burning.
Approximately 300 Galactic WR stars have been cataloged (van der Hucht 2006). Models of the hot-star distribution in our Galaxy show that it should contain several thousand WR stars (Shara et al. 2009). Of these, many lie in dense clusters. Almost all lie close to the Galactic plane (|b| < 5°, |z| < 200 pc; Conti & Vacca 1990). As a result, they are extremely reddened, and despite their high intrinsic luminosities, have therefore been found traditionally only relatively nearby (d ≲ 2 kpc). Infrared surveys, which can penetrate the deep columns of dust in the plane, are among the most effective means of uncovering new WR populations. This is particularly true for exploring the incidence rate of WR stars in the chemically evolved inner few kiloparsecs of the Galaxy.
Two basic forms of infrared surveys have been conducted to date. Targeted line surveys, typically in the 2 μm range, probe the strong, velocity-broadened wind-borne emission lines of He, C, N, and other elements. These searches have been conducted in the field (e.g., Homeier et al. 2003; Shara et al. 2009, 2012), and in young clusters (e.g., Figer et al. 1995; Eikenberry et al. 2004; Crowther et al. 2006; Mauerhan et al. 2010; Messineo et al. 2011). A complementary method targets another wind-borne emission property—the infrared free–free excess over photospheric emission (e.g., Hadfield et al. 2007; Mauerhan et al. 2009, 2011). These two methods offer complementary sensitivity to differing WR subtypes based on the relative strengths of emission lines and the continuum excess arising from their winds. And both methods have been successful at identifying new WR stars with selection rates between ∼5%–50%, together discovering well over a hundred new WR stars, including the most distant in our Galaxy. Here we detail a K-band WR line survey covering 5.8 deg2, and report on 11 new field WC stars, including among them some of the most reddened Galactic WR stars ever observed.
2. OBSERVATIONS AND CANDIDATE SELECTION
A search for new WR stars was conducted using custom medium-narrowband filters centered on prominent wind-borne emission lines in the K-band, where effects of extinction are moderated. Sources identified with evidence of line excess were followed up with JHK spectroscopy at medium resolution.
2.1. Photometric Search
A custom set of two line and two continuum filters, together with an existing longer wavelength K-band continuum filter, were employed for the photometric search. Table 1 gives the filter details, and the filter curves, measured at 77 K, are shown in Figure 1, together with a representative suite of K-band spectra of known WR stars from Figer et al. (1997). The filter bandpasses were designed by simulating detection using the K-band WR spectral atlas of Figer et al. (1997) and equivalent infrared atlases of other hot stars (mostly O and B and Oe, Be; Hanson et al. 1996). The medium width filters (∼50 nm) were specifically chosen to couple well to the strong velocity-broadened features from both WN and WC subtypes, while at the same time reducing the spurious signal from far more numerous hydrogen line emitting stars. While this custom filter set yielded a reasonably high detection rate, it does lead to stronger sensitivity to certain WR subtypes than narrower passbands (e.g., Shara et al. 2012). Data were obtained with PISCES, a near-infrared camera operated on the Steward Observatory 2.3 m Bok telescope on Kitt Peak (McCarthy et al. 2001). PISCES provides an 8 5 circular field of view with 0
 5 pixels.
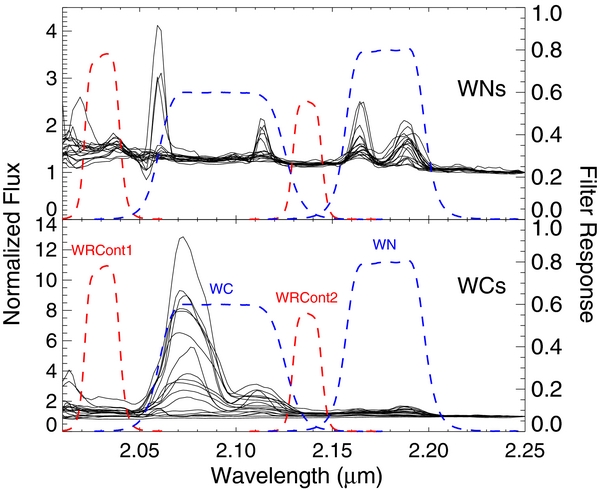
Figure 1. Transmission curves (dashed lines) for the custom medium-narrowband line (blue) and continuum (red) filters employed in the WR search, together with the WC (bottom, including subtypes WC4–WC9) and WN (top, WN3–WN9) K-band spectral atlas of known WR stars by Figer et al. (1997). Filter names are indicated.
Download figure:
Standard image High-resolution imageTable 1. Custom WR Filter Set
| Name | λcen | FWHM |
|---|---|---|
| μm | μm | |
| WRCont1 | 2.035 | .018 |
| WC | 2.086 | .0655 |
| WRCont2 | 2.140 | .015 |
| WN | 2.178 | .042 |
Download table as: ASCIITypeset image
Three search fields were selected from high-resolution Two Micron All Sky Survey (2MASS) star count color maps. These included regions along the Galactic plane visible from Kitt Peak with an abundance of 2MASS stars found in a narrow strip of JHKs color space to the right of the reddened main sequence. This region of color space is where known WR stars lie (e.g., Mauerhan et al. 2011). The selected fields were at Galactic coordinates (l, b) = (31 6, −02), (427, −008), and (292, −03) (corresponding to the top, middle, and bottom fields shown in Figure 2). A total of 5.8 deg2 was surveyed.
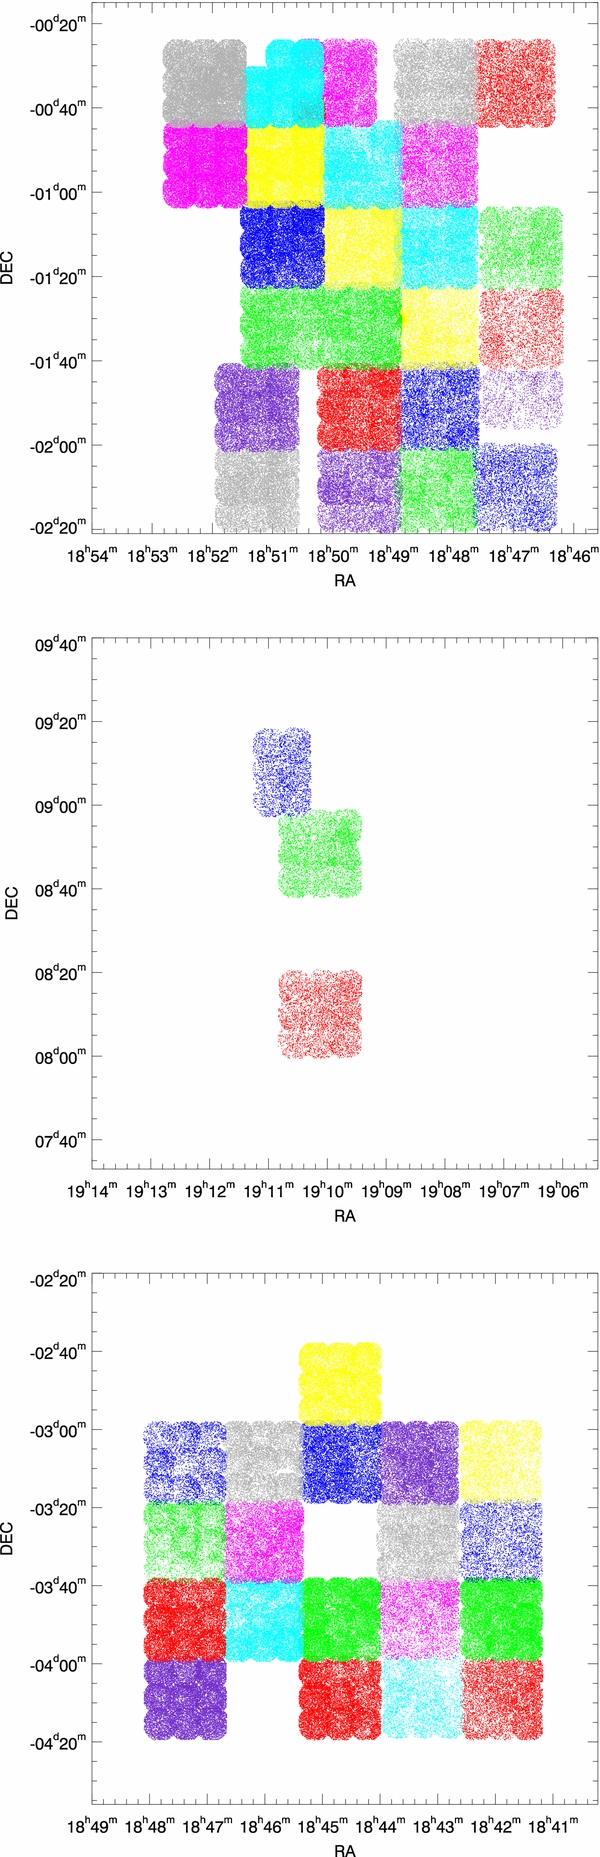
Figure 2. Individual point sources recovered from three fields near Galactic latitude 0°, with separate 3 × 3 PISCES sub-fields colored separately. A total of 5.8 deg2 was surveyed, with some gaps due to missing data.
Download figure:
Standard image High-resolution imagePISCES observations were obtained over the course of 16 nights in 2004 July, 2005 June, and 2007 May. Each sub-field was imaged five times in each filter. Between subsequent exposures, the telescope was offset in a random dither pattern of up to 10''. Adjacent sub-fields overlapped in a 3 × 3 raster pattern to ensure complete coverage. Flat fields were obtained from an illuminated dome screen. A normalized flat was created by differencing between a trimmed average set of 10 lamp-on and 10 lamp-off images, and then normalizing the resulting difference image by the median. After the raw frames were flat-fielded, sky frames were created by rejecting source signal (i.e., stars) and averaging the dithered image stack. Saturation in the sky-subtracted frames occurred at Ks ∼ 7.5 mag, with sensitivity driven largely by confusion and seeing.
Frames were aligned and co-added in IRAF, and source lists were constructed using DAOPHOT (Stetson 1987). Point sources recovered in the co-added filter image were band merged in detector coordinate space using the match routine.4 Finally, a distorted WCS grid was assigned to the detector coordinate frame by matching bright stars in the recovered merged source list to the 2MASS point-source catalog using the WCSTools tool imwtmc (Mink 1999). The recovered set of point sources in each of the three fields are displayed in Figure 2.
2.2. Candidate Selection
We identified potential WR candidate stars as >3σ outliers in the distribution of color excess between continuum and WR line filters: mcont − mWR. This technique makes the implicit assumption that the vast majority of selected stars have no color excess, so that casting color differences relative to the centroid of the color distribution individually within each image field removes any requirement for an absolute calibration standard. This method, which relies on the rarity of line emission stars, delivers far superior relative photometric calibration in crowded fields compared to continuum standard-star matching, and is particularly effective in automatically accommodating variable seeing-induced image quality and the resulting point-source confusion. Variable extinction over a sub-field can skew color differences, but by interpolating continuum from bracketing line positions under the line itself, this can be mitigated.
Among the program filters, WRCont1 and WRCont2 were used together with the WC and WN filters for detection of excess flux due to line contributions. The KCont filter samples the CO band head at 2.29 μm in the spectra of late-type supergiant stars, introducing spurious color offsets unrelated to line emission but similar to WR stars in this band. It was not considered for further candidate selection, which markedly diminished sensitivity to the WN subtypes, none of which are reported here. Other non-WR candidates included Be emission-line stars, and, more commonly, extremely reddened continuum sources, in which curvature in the reddened 2 μm continuum mimics a line excess. Using bracketing continuum points on either side of the WC photometry considerably reduced, but did not eliminate, the rate of this spurious selection class. The final selection efficiency depended on magnitude, but was approximately 20%, averaged over the full sample.
2.3. Spectroscopic Followup
Line excess targets identified as outliers in their local color distributions were followed up with JHK spectroscopy using CorMASS (Wilson et al. 2001) on the Apache Point Observatory 3.5 m, and SpeX (Rayner et al. 2003) on the NASA Infrared Telescope Facility (IRTF). Two WRs were discovered with CorMASS, but were subsequently followed up with SpeX at higher resolution.
The candidates were observed over five nights from 2007 August 27–31 (UT). SpeX is a near-infrared, medium-resolution spectrograph on the 3 m NASA IRTF on Mauna Kea, HI. SpeX employs a 1024 × 1024 Aladdin 3 InSb array with a plate scale of 015 pixel−1. We used 03-wide slit in the short-wavelength cross-dispersed mode (SXD) which covers from 0.8 to 2.5 μm at resolving power of R ≡ λ/Δλ ≈ 2000. A single 120 s exposure was taken of each candidate to search for the strong broadened emission lines. If emission lines were present in the raw image, a series of 120 s exposures was then obtained at two different positions along the 15'' slit, and an A0 V star at very similar airmass was observed immediately after the science exposures for telluric correction and flux calibration purposes. A set of internal quartz tungsten and argon arc exposures was also obtained for flat fielding and wavelength calibration purposes after each set of observations.
The data were reduced using Spextool, the Interactive Data Language based data reduction package for SpeX (Cushing et al. 2004). Pairs of images taken at the two different positions along the slit were corrected for nonlinearity, flat-fielded, and then subtracted to remove the bias and dark current and to perform a zeroth-order sky subtraction. The spectra were then optimally extracted after subtracting the residual sky signal and wavelength calibrated using the argon arc exposure. Telluric correction and absolute flux calibration were accomplished using the observations of the A0 V standard stars and the technique described in Vacca et al. (2003). Finally, the spectra from the six orders were merged to produce a continuous spectrum. For the most highly reddened stars in the sample, weak signal limited the detection to above ∼1.4 μm.
3. SAMPLE
A total of 11 WR stars have been spectroscopically confirmed. Their JHK spectra are shown in Figure 3.5 Prominent lines detected include those of
- 1.He i (1.083 μm, 1.282 μm, 1.572 μm, 1.701 μm, 2.165 μm),
- 2.He ii (1.163 μm, 1.282 μm, 1.476 μm, 1.489 μm, 2.189 μm, 2.165 μm, 2.347 μm),
- 3.C iii (1.198 μm, 1.256 μm, 2.108 μm, 2.117 μm, 2.325 μm), and
- 4.C iv (1.191 μm, 1.435 μm, 1.736 μm, 2.076 μm, 2.278 μm, 2.426 μm).
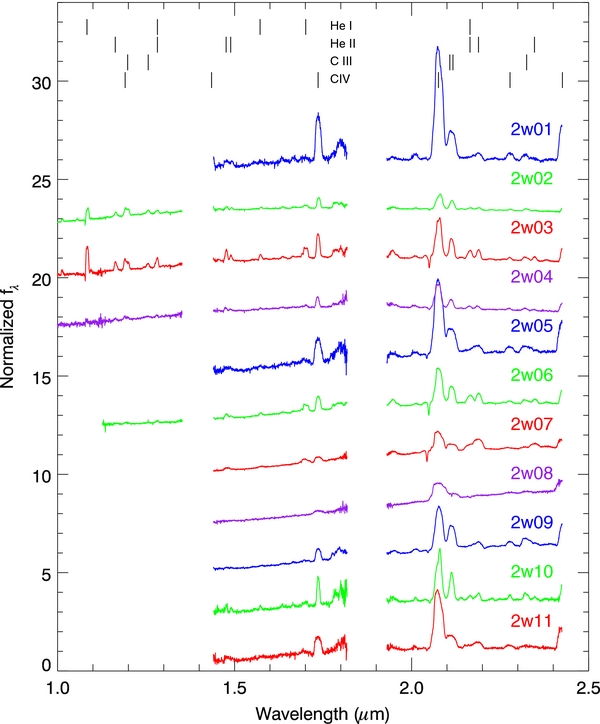
Figure 3. New WR spectra, normalized, with arbitrary offsets. The locations of prominent emission lines are marked.
Download figure:
Standard image High-resolution imageIn approximately half of the program stars, prominent P-Cygni absorption is seen blueward of the Civ 2.076 μm line.
Each star was matched against the 2MASS point-source catalog (Cutri et al. 2003). The higher resolution PISCES imaging revealed three cases where the selected star has a closely matching 2MASS point source which is in fact either a blended source at 2MASS resolution, or an incorrect identification associated with a near-neighbor star. These spurious matches were excluded. In one of these three cases (2w01), a 2MASS source with quality flag AAA (the highest) was a very good coordinate match; the higher resolution PISCES imaging reveals this source to be a blended composite. In the Galactic plane, the 2MASS point-source catalog is severely confusion limited at magnitudes even as bright a Ks ∼ 12, so considerable care must be taken to avoid spurious identification. The sample is presented in Table 2, and finder charts for all 11 stars, obtained in the WC filter at 2.08 μm, are shown in Figure 4.
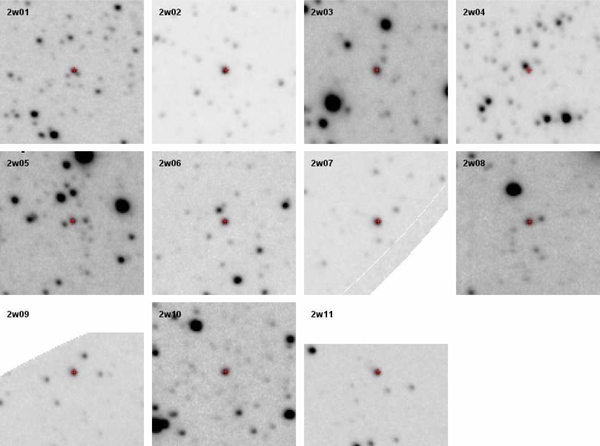
Figure 4. Finding charts for new WR stars, with centered targets indicated by the small crosses. Images are produced in the broad WC filter at 2.08 μm (see Figure 1) and are 100'' × 100'' in size; N is up, E is to the left.
Download figure:
Standard image High-resolution imageTable 2. WR Sample
| Name | α(J2000) | δ(J2000) | l | b | 2MASS Obj. | J | H | Ks |
|---|---|---|---|---|---|---|---|---|
| (1) | (2) | (3) | (4) | (5) | (6) | (7) | (8) | (9) |
| 2w01 | 18:41:48.50 | −04:00:13.3 | 28.3 | 0.313 | ⋅⋅⋅a | 12.27b | ||
| 2w02 | 18:42:08.60 | −03:49:35.6 | 28.5 | 0.319 | 18420846−0349352 | 12.394 ± 0.028 | 10.828 ± 0.021 | 9.746 ± 0.021 |
| 2w03 | 18:42:22.18 | −03:05:41.3 | 29.1 | 0.604 | 18422216−0305396 | 14.539 ± 0.036 | 12.844 ± 0.038 | 11.695 ± 0.027 |
| 2w04 | 18:43:17.24 | −03:08:57.6 | 29.2 | 0.375 | ⋅⋅⋅ | 11.74b | ||
| 2w05 | 18:43:17.33 | −03:20:25.3 | 29.0 | 0.288 | ⋅⋅⋅ | 12.64b | ||
| 2w06 | 18:45:49.76 | −02:59:54.4 | 29.6 | −0.120 | 18454987−0259560 | >13.653 | 13.039 ± 0.066 | 11.262 ± 0.030 |
| 2w07 | 18:47:38.37 | −02:06:43.1 | 30.6 | −0.118 | 18473833−0206389 | 16.328 ± 0.125 | 12.697 ± 0.043 | 10.565 ± 0.029 |
| 2w08 | 18:47:57.26 | −01:27:35.4 | 31.2 | 0.109 | 18475733−0127364 | >16.254 | 14.706 ± 0.065 | 12.153 ± 0.044 |
| 2w09 | 18:48:24.76 | −02:06:10.4 | 30.7 | −0.286 | 18482451−0206162 | >16.661 | 13.737 ± 0.031 | 11.504 ± 0.029 |
| 2w10 | 18:50:02.71 | −00:32:09.9 | 32.3 | 0.0655 | 18500275−0032080 | >16.975 | 13.856 ± 0.044 | 12.154 ± 0.030 |
| 2w11 | 19:10:11.54 | +08:58:42.0 | 43.1 | −0.0397 | 19101152+0858396 | >15.783 | 13.537 ± 0.057 | 11.753 ± 0.034 |
Notes. Column 1: candidate name, R.A.-sorted; Columns 2 and 3: R.A./decl., J2000; Columns 4 and 5: Galactic latitude and longitude; Column 6: 2MASS source (if available). Columns 7–9: 2MASS J, H, K magnitudes. Magnitude limits correspond to source quality flag "U". aProgram star blended with two sources as a single 2MASS source with quality flag AAA. bSynthetic Ks magnitudes derived from the spectrophotometry for sources without 2MASS point-source counterparts. See Section 6.
Download table as: ASCIITypeset image
4. SUBTYPE
The subtype of the confirmed WR stars was determined from the ratio of the equivalent widths of the C iv 2.076 μm and the C iii 2.110 μm line. The continuum underlying the lines was estimated as described in Section 5, with the intrinsic power-law slope allowed to vary individually for each star between α = 2.6 and 3.0 to obtain the best-matching fit. The spectrum was then de-reddened, and the two lines were divided at a wavelength of 2.0975 μm, with care taken to avoid including the blue C iv P-Cygni profiles. The quantitative empirical subtype C iv/C iii calibration of Crowther et al. (2006) was then applied, resulting in subtype WC8 for the majority of the program stars, with two stars assigned WC7. The WC types exhibit the strongest 2.08 μm C iv+C iii complex, so it is unsurprising that these types were selected preferentially. More surprising is the dearth of early WC subtypes, which exhibit even higher equivalent width C iv and C iii lines, up to three times that of the late WC types (Figer et al. 1997). This likely results from the type dependence on metallicity, with the higher-metallicity environments inside of the solar circle favoring later subtypes of both WN and WC stars (Crowther 2007). Alternatively, the C iv/C iii diagnostic itself may not be completely effective at separating earlier WC types from WC7–8 types.
Later WC types, including WC9, can have their infrared output dominated by heated dust produced at the contact interface between two winds in a binary outflow system (e.g., Williams et al. 1987), although not all WC9s are dust producing. None of the WC stars reported here appear to be producing appreciable dust, as in all cases the continuum, once corrected for extinction, falls smoothly through 2.4 μm without evidence of the onset of excess heated dust emission (see Section 5). This is very likely a selection bias rather than a statement on the prevalence of dust production among late WC stars, since dust hot enough to emit significantly in the near-infrared would continuum-dilute line emission and make such stars more challenging to detect in our medium-narrowband line photometry.
5. EXTINCTION
Extinction to the program stars was estimated in two different ways. Following Crowther et al. (2006), intrinsic (J − Ks)0 and (H − Ks)0 colors, calibrated by subtype for non-dusty WRs, were adopted. For example, for WC8 subtypes, Crowther et al. find intrinsic colors of (J − Ks)0 = 0.43, (H − Ks)0 = 0.38. The extinction  can be derived directly from 2MASS photometry using subtype appropriate colors, together with the total to selective extinction calibration of Indebetouw et al. (2005)—
 . These extinction values are reported in Table 3. Stars with J-band upper limits in their 2MASS photometry are reported with lower limits on extinction derived from J − Ks colors.
Table 3. Sample Properties
| Name | Type |  |
 |
 |
d | RGC |
|---|---|---|---|---|---|---|
| (H − K) | (J − K) | (spec) | (kpc) | (kpc) | ||
| 2w01 | WC7 | ... | ... | 2.04+0.08− 0.14 | 9.20 | 4.38 |
| 2w02 | WC8 | 1.26 | 1.49 | 1.27+0.06− 0.10 | 4.22 | 5.20 |
| 2w03 | WC8 | 1.38 | 1.62 | 1.57+0.07− 0.11 | 9.02 | 4.44 |
| 2w04 | WC8 | ... | ... | 1.58+0.07− 0.11 | 9.16 | 4.50 |
| 2w05 | WC8 | ... | ... | 3.27+0.09− 0.15 | 6.37 | 4.26 |
| 2w06 | WC8 | 2.50 | >1.31a | 2.82+0.08− 0.14 | 4.15 | 5.30 |
| 2w07 | WC8 | 3.14 | 3.57 | 3.58+0.09− 0.15 | 2.12 | 6.76 |
| 2w08 | WC8 | 3.89 | >2.46a | 4.29+0.10− 0.17 | 3.18 | 6.01 |
| 2w09 | WC8 | 3.32 | >3.17a | 3.77+0.09− 0.15 | 3.00 | 6.12 |
| 2w10 | WC8 | 2.37 | >2.94a | 2.55+0.09− 0.14 | 7.09 | 4.54 |
| 2w11 | WC7 | 2.16 | >2.28a | 2.46+0.09− 0.14 | 5.98 | 5.81 |
Notes. Column 1: candidate name; Column 2: Subtype; Columns 3 and 4: extinction estimated from 2MASS photometry; Column 5: extinction estimated from spectrophotometry; Column 6: distance; Column 7: Galactocentric radius. aExtinction value derived from upper limit in J-band flux.
Download table as: ASCIITypeset image
An alternative estimate of extinction was obtained by directly modeling the calibrated 1–2.5 μm spectra, leveraging the fact that the continuum flux distribution at infrared and radio wavelengths arises primarily from free–free emission in an expanding ionized wind with constant mass loss rate. This free–free excess has been well tested at a variety of wavelengths, and is indeed fundamental to the early estimates of mass-loss rates in WR winds (e.g., Bieging et al. 1982).
The distribution of flux arising from such a wind follows quite closely a single power law—fλ∝λ−α. Using a simplified model of the free–free emission arising from a constant velocity ionized envelope, Wright & Barlow (1975) predicted α = 8/3, which was found to be quite close to the observed value. Morris et al. (1993) measured the 0.1–1.0 μm continuum slope of a large sample of low-reddening WR stars of various subtypes, and found consistency within α = 2.85 ± 0.4, also validating this slope holds at longer wavelengths out to 25 μm. We have adopted this approximate range of power-law slopes to estimate the intrinsic extinction directly from our spectrophotometry.
Spectral regions free of line emission were marked and fitted by a scaled power law, reddened by the extinction curve of Indebetouw et al. (2005; which does not differ substantially at near-infrared wavelengths from the extinction law of Fitzpatrick & Massa 2009). The power-law slope was fixed, and only the value of extinction varied. The derived extinction values range from  , and, where comparisons are possible, are generally consistent with the values derived from photometry alone.
Altering the intrinsic power-law slope α between 2.6 and 3.0 had relatively little effect on the derived extinction  (spec), which varied typically only ±5% over this range. An example of the continuum fitted in this manner is given in Figure 5. Given the relatively large uncertainty and scatter in the intrinsic JHK colors of WR stars, driven to no small degree by the varying contribution of emission lines to the broad photometric bands, we favor the spectral-derived reddening values, and adopt them throughout this work. These are among the most reddened WR stars ever observed in the Galaxy, corresponding at the upper end of the reddening distribution to visual extinction AV ∼ 39 (adopting AV/
 = 8.8; Indebetouw et al. 2005).
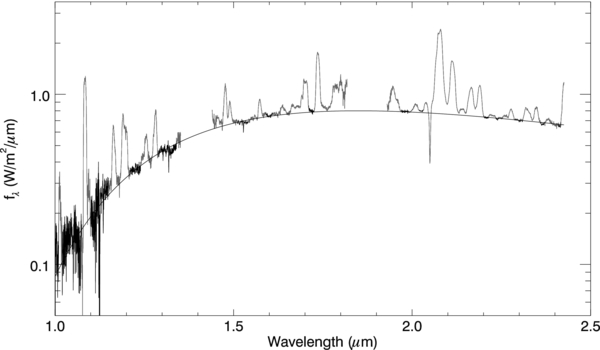
Figure 5. Example fitted continuum for program star 2w03. Pivot points in the spectrum relatively free from line contribution, which were used to fit the continuum as a reddened power law, are shown as darker regions.
Download figure:
Standard image High-resolution imageA significant issue in the use of broadband colors of WR stars to estimate extinction, derive distances, or track intrinsic variations of the infrared energy distribution among subtypes is the fact that the broad and powerful wind-borne emission lines can contribute significantly to the measured flux even within broad photometric bands. By subtracting the fitted model continuum (fλ∝λ−α) from the observed flux, de-reddening, and then integrating against 2MASS filter response profiles, we can estimate the fraction of the flux in the band contributed purely by line emission. We find that, for the H and Ks bands, respectively, 90 ± 7% and 80 ± 8% of the in-band flux is attributable to continuum, with the rest arising from strong blended line complexes. Due to the extreme reddening encountered, only four of the program stars had reliable J-band detections. We therefore do not provide an estimate for the continuum fraction in this band, though for this sample of stars it is comparable to that observed in the H band.
6. DISTANCES
Accurate distances to WR stars typically rely on cluster membership. All the WR stars discovered here were found in the field. Massive stars are believed to form predominantly in clusters, and many known WRs reside in dense stellar environments. Our lack of cluster stars was certainly a selection effect, as variable image quality severely reduced our ability to recover candidates from crowded areas.
Since we adopt photometric distances, calibrated absolute luminosities are required. The absolute luminosities of WR stars vary by subtype, spanning at least a factor of 50 times at near-infrared wavelengths, and, unfortunately, factors of two or more within each subtype.
For the three program stars with no reliable associated 2MASS point sources, synthetic Ks photometry was computed from the spectrophotometry:
where gλ is the 2MASS Ks filter response function of Cohen et al. (2003), in which photon-counting spectral response proportionality has already been included, and for which the zero point is 4.283 × 10⁻¹⁴ W cm−2 μm−1, corresponding to a Ks magnitude of 0.017 ± 0.005. This synthetic photometry is included in Table 2, and was used to compute distance estimates for stars without 2MASS counterparts. Typical uncertainty in the synthetic flux recovered is 15%.
The distance to each star was estimated assuming the absolute Ks magnitudes tabulated by Crowther et al. (2006) of  −4.65 (WC8), −4.59 (WC7), along with real or synthetic Ks photometry, and the continuum-fitted extinction estimates
  (see Section 5). Variation in the fitted extinction over the assumed range of intrinsic continuum power-law slope α contributes ≲8% uncertainty in the derived distances, an error well below the systematic variations in star-to-star absolute luminosity within a subtype. The latter contributes ∼20% distance uncertainty for a typical absolute magnitude uncertainty
  , resulting in total distance uncertainty of ∼30%. Also given in Table 3 is the Galactocentric radius, assuming R0 = 8.0 kpc.
7. DISTRIBUTION IN THE GALAXY
Averaged over the three program fields near the Galactic plane, the density on the sky of WR stars in this survey, to a limiting depth of K ∼ 12.5, is approximately 1.9 deg−2. It is important to note that this is strictly a lower limit. Survey completeness due to crowding and point-source recovery limitations within the observed fields is variable, and estimated at no more than 50% down to these magnitudes. Moreover, the dominance of the 2.08 μm WC filter in the selection (see Figure 1) implies very little subtype sensitivity apart from strong-lined WC stars. Even including the increasing fraction of the WC type fraction toward the Galactic center (van der Hucht 2001), it is very likely a complete census including all WR subtypes to a limiting depth of Ks ∼ 12.5 would have recovered at least two to three times more WR sources in the same fields.
Since our survey covers a modest portion of the Galactic plane out to large distances, we can treat it as a collection of ∼2 deg2 pencil beams which probe models predicting the distribution of WR stars in the Galaxy. Shara et al. (2009) construct such a model by assuming the volumetric density of WR stars, nWR(r, z), follows the COBE/DIRBE calibrated dust distribution model of Drimmel & Spergel (2001). Compared to the latter, Shara et al. shorten the radial exponential scale length to accommodate the Galactic abundance gradient and the steep dependence on metallicity of, e.g., the WR/O star frequency.
We have reconstructed this model, adopting the same shortened radial scale length, and flared scale height of the distribution as originally specified by Drimmel & Spergel. The model was then calibrated by forcing it to reproduce the local surface density of WR stars (2.09 × 10⁻⁸ pc−2; van der Hucht 2001). A slight error in the normalization to the local density by Shara et al. (2009, their Appendix 1) was corrected, resulting in a model prediction of approximately 4700 WR stars in the Galaxy. A cross-sectional quadrant of the axisymmetric model, in cross section of Galactocentric radius r and scale height above the midplane z, is shown in Figure 6.
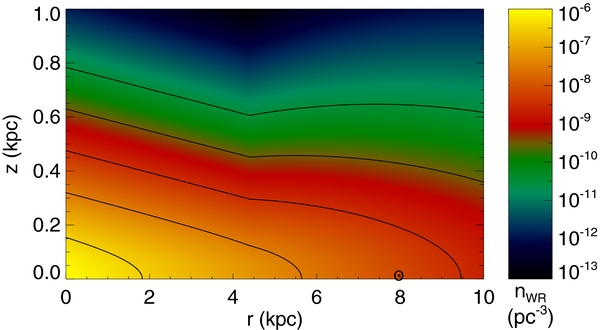
Figure 6. Single quadrant in r–z cross section of the axisymmetric WR density model nWR. Logarithmic density contours range in decades from 10−10.5 to 10−6.5 pc−3. The solar position is indicated near the horizontal axis. The modeled disk flare outside 4.4 kpc is evident.
Download figure:
Standard image High-resolution imageTo test this model against the density of WR stars reported here, we randomly distributed 4700 stars throughout the Galaxy, using two dimensional cumulative density functions to position stars according to the model density distribution nWR(r, z) (see Figure 6), and uniformly in azimuthal angle ϕ. We then observed this distribution from the solar position along the directions and over the approximate solid angles of our three target fields. To obtain predicted K magnitudes, the extinction model of Shara et al. (2009) was integrated along the line of sight between the solar position and the star, and we follow Shara et al. in adopting an absolute magnitude for the purposes of modeling the magnitude distribution of  −4. The number of stars with predicted K magnitudes brighter than 12.5 was accumulated, and the procedure was repeated 5000 times. The resulting distribution of areal density is displayed in Figure 7. The modeled density distribution lies distinctly below the limiting value found in this survey.

Figure 7. Modeled distribution of WR star areal density along the sight lines toward the observed fields, for stars brighter than the sample limit of K ∼ 12.5. The model mean is indicated by the dotted line, and the lower limit on areal density found in the present survey is indicated by the solid line.
Download figure:
Standard image High-resolution imageOne possible explanation for this discrepancy would be an overestimate in the model of the typical extinction along the 2–10 kpc line-of-sight distances to the observed stars. The distribution of model-predicted AK is shown in Figure 8. Most values range between 1 and 2.4 with a preference toward the latter end. This range is roughly comparable to the extinction values determined here by modeling both photometry and spectroscopy of the target stars (see Section 5). Indeed, more than half of the 11 reported WRs exhibit reddening values above  . As expected given the clumpy distribution of dust in the Galaxy, the smooth extinction model underestimates typical reddening to a given magnitude limit near the Galactic plane, since it does not account for the coupled geometries of dust-bearing and massive-star-producing environments. This additional reddening would have served to modestly reduce the number of detected WR stars compared to model predictions.

Figure 8. Modeled distribution of extinction AK in the observed fields, for K < 12.5.
Download figure:
Standard image High-resolution image
Another possible explanation for the discrepancy in areal density is an overly conservative model assumption on the absolute magnitude of WR stars. Adopting a more luminous typical WR star with  −4.6, appropriate for the late WC types found here, shifts the mean of the areal density distribution to ∼1.2, but does not alleviate the discrepancy. This is closer, but still not compatible with the lower limit established by this sample toward these lines of sight.
In addition, overdensities along spiral arm structures, or other local density effects, which are not included in the model, could explain the offset. However, given the wide range of solar distances to stars in both this sample and the model observations, and the fact that the three fields were not contiguous, this possibility would require special alignments between the selected fields and structural overdensities of WR stars in the Galaxy. Other possibilities are that the general distribution of hot stars is more flattened in the inner Galaxy compared to Galactic dust emission, or that the reduction of the WR exponential scale length to account for the Galactic radial metallicity gradient is overestimated in the model.
8. CONCLUSIONS
We report the discovery of 11 new field WR stars found in a dedicated 2 μm medium-narrowband line survey. Efficient narrowband selection surveys can rely on the rarity of line excess targets to search for outliers in the color distribution between line and continuum bands—a method which automatically adjusts to varying photometric conditions, and avoids the need for explicit absolute calibration.
Near-infrared spectroscopic followup of the candidates reveals a tight distribution of late WC subtypes. A direct measure of the extinction can be obtained by assuming an intrinsic continuum of the form fλ∝λ−α, fitted, after reddening, to the line-free continuum. This method has little sensitivity on the precise value of α or details of the near-infrared extinction law employed, and is found to agree well with methods relying directly on assumed intrinsic colors, with less sensitivity to variations in line contamination in the broad bands. The sample presented is typified by extinction values  1.3–4.3, covering solar distances from 2–9 kpc, and Galactocentric distances 4–7 kpc.
The broadened emission lines arising in WR outflows can contribute 30% or more of the flux in individual broad bands in the near-infrared. Strong variation in line strength relative to the continuum, even within identical subtypes, drives significant scatter in intrinsic distributions of luminosity and IR color. This limits the accuracy by which distances and extinction can be recovered from isolated stars, as well as the resulting constraints on the density distribution of WRs as a whole and by subtype within the Galaxy. Using near-IR spectrophotometry to exclude spectral lines and rely entirely on the continuum for color and luminosity calibrations may significantly reduce this scatter.
In the crowded regions WR stars inhabit, considerable care must be taken in matching broadband photometry, either after the fact, or indeed for the original selection if the free–free continuum excess is sought. This will become increasingly problematic as WR surveys push to fainter limits (K ≳ 14) where crowding and contamination increase. With a subtype dependent absolute calibration of the line-free WR continuum luminosity density at a given fiducial wavelength (e.g., near 2.3 μm), carefully calibrated spectrophotometry could yield all the relevant parameters without any reliance on less reliable photometric matching.
A revised version of the WR density distribution model of Shara et al. (2009), containing approximately 4700 stars in the Galaxy, was used to test the areal density of WRs toward the target sight lines. Even when neglecting the effects of photometric survey incompleteness and subtype sensitivity—both of which would serve to increase the true number of WR stars to a photometric depth of Ks ∼ 12.5—we find a larger number of more reddened WRs toward these sight lines than predicted by the model. When compared to the older pure exponential disk models containing 2500 or fewer WR stars in the Galaxy, this high density of field sources is even more significant. A more complete comparison using the full distribution of distant WR stars filling out the far side and inner disk of the Galaxy would be an important step toward resolving or explaining this discrepancy.
WR stars can now routinely be found by their infrared continuum excess or strong wind-borne infrared emission lines in the Galactic disk to optical extinction values as high AV ∼ 40. At the current rate of discovery, a substantial fraction of the Milky Way's WR population of thousands of stars can be mapped with only modest near-infrared capabilities.
Author J.D.T.S. is grateful for support for this project from a William F. and Elizabeth Lucas Junior Faculty Award. This work is also supported (in part) by NASA through the Spitzer Space Telescope Fellowship Program, through a contract issued by the Jet Propulsion Laboratory, California Institute of Technology, under a contract with NASA. We thank D. Figer for early access to a K-band spectral WR catalog, which was crucial for filter design, R. Finn and J. Hinz for their help designing the Pisces observational program, C. Karp of Chroma Technology Corp. for his assistance with filter construction and deployment, W. Vacca for useful discussions on NIR WR typing, J. Wilson, M. Skrutskie, and D. Peterson for their support of CorMASS observations and reductions, and an anonymous referee for comments which substantially improved this work.
Footnotes
- 4
- 5
The "2w" prefix is short for 2MASS Wolf–Rayet Line Detection Survey.