


ABSTRACT
Detailed element abundances have been determined for 10–13 stars each in the open clusters (OCs) NGC 2204 and NGC 2243 based on Hydra multi-object echelle spectra obtained with the CTIO 4 m telescope. We have found average cluster metallicities of [Fe/H] = −0.23 ± 0.04 and −0.42 ± 0.05 for NGC 2204 and NGC 2243, respectively, from an equivalent width analysis. NGC 2243 is the most metal-poor cluster at its Galactocentric radius and is one of the most metal-poor OCs currently known. These two clusters lie ∼1 kpc below the Galactic plane; it is therefore worthwhile to compare their abundance patterns to those of clusters both closer to and further from the plane. To that end, we combined the results of the current study with those of clusters from our previous work as well as from the literature. To minimize systematic differences between different studies, element abundances of many outer disk OCs as well as thin and thick disk field stars have been placed on our abundance scale. Plots of [X/Fe] versus [Fe/H] for NGC 2204, NGC 2243, other clusters from the literature, and thin and thick disk field stars show NGC 2204 and NGC 2243 to have element abundance patterns comparable to those of other clusters regardless of distance from the plane or center of the Galaxy. Similarly, no individual cluster or group of clusters far from the Galactic mid-plane can be identified as belonging to the thick disk based on their abundance patterns.
Export citation and abstract BibTeX RIS
1. INTRODUCTION
Detailed observations of the chemical abundance distributions of the Milky Way disk provide crucial constraints to theoretical galaxy chemical evolution models. Element abundance patterns of a variety of different populations in the Milky Way disk trace the disk's chemical history as a function of age and location in the disk. Open clusters (OCs) are versatile probes of the disk abundance distribution because they span the full age range of the disk and their fundamental parameters can be determined to good precision. That said, the picture of disk chemical evolution that OCs provide is likely incomplete and potentially biased by the selection effects (both observational and intrinsic) that have created the present-day OC population we have to work with.
As the number of clusters subject to detailed abundance study in the outer disk (Galactocentric distance, Rgc ≳ 10 kpc) has grown in recent years, so have questions pertaining to the outer disk's origin and connection to the inner disk. Twarog et al. (1997) were one of the first groups to question whether the outer disk OCs belong to the same population as the inner disk OCs. In their study of 76 clusters, they found that the linear, negative gradient often used to fit the radial metallicity distribution of OCs was a poorer fit to the data than a simple step function occurring at Rgc = 10 kpc. The metallicity distributions of OCs on either side of this radius were well described by Gaussians with similar small dispersions, but differing means of [Fe/H] = 0 (inner) and [Fe/H] = −0.3 (outer). The first high-resolution spectroscopic studies of very distant OCs seemed to confirm this view when they found outer disk OCs to have enhanced [α/Fe] ratios and general abundance patterns dissimilar to inner disk OCs and other galaxy stellar populations (Carraro et al. 2004; Yong et al. 2005). However, subsequent studies of these and other outer disk OCs have found them to have similar [X/Fe] ratios to inner disk OCs (e.g., Sestito et al. 2008), and the (albeit incomplete) kinematic information available for the outer disk OCs indicates they are normal disk objects (Carraro et al. 2007).
While our understanding of the outer disk is still incomplete, the nature of the transition between the inner and outer disks also remains ambiguous. The clean separation of the Twarog et al. (1997) sample into two OC populations at Rgc = 10 kpc is not so clearly seen in the distribution of OC metallicities determined via high-resolution spectroscopy, where the transition appears to occur somewhere around Rgc ≈ 9–14 kpc (e.g., Yong et al. 2005; Friel et al. 2010). However, these views of the transition region may be shaped by small/incomplete samples of OCs and/or inhomogeneous samples.
We have undertaken a study of ∼20 OCs with Rgc ∼9–13 kpc to better characterize the nature of the transition between the inner and outer disks. Roughly half of this sample has been presented in previous papers (Friel et al. 2005, 2010; Jacobson et al. 2008, 2009). Here we present abundance results for two populous, old (∼2–4 Gyr) southern hemisphere clusters, NGC 2204 and NGC 2243, based on spectra obtained with the Hydra multi-object spectrograph on the CTIO 4 m telescope. To our knowledge, only NGC 2243 has been subject to previous high-resolution spectroscopic study, based on only two stars (Gratton 1982; Gratton & Contarini 1994).
2. CLUSTER INFO AND TARGET SELECTION
One of the first photometric studies of NGC 2204 (l = 226 0, b = −162) was carried out by Hawarden (1976). His photoelectric and photographic photometry of the cluster field extended to V ∼ 17.5. Based on two-color diagrams of the cluster, Hawarden found it to have [Fe/H] = −0.20 and E(B − V) = 0.08, with (m − M)0 = 13.25 ± 0.20. Janes (1979) converted the UV excess found by Hawarden to a metallicity of [Fe/H] = −0.38 ± 0.09. Dawson (1981) obtained DDO and VRI photometry of NGC 2204 and found E(B − V) = 0.08 ± 0.01. Based on the CN strength of several potential cluster members, he found [Fe/H] = −0.41 ± 0.19. Twarog et al. (1997) used Dawson's DDO photometry of five assumed cluster members and found [Fe/H] = −0.338 ± 0.250 on their revised metallicity scale. Frogel & Twarog (1983) presented photoelectric photometry of NGC 2204 down to V ∼ 20. They determined an age of 2.5 ± 0.3 Gyr and (m − M)0 = 13.1 ± 0.2 based on comparisons to theoretical isochrones, adopting E(B − V) = 0.08. Based on Washington photometry of seven stars, Geisler (1987) found E(B − V) = 0.10 ± 0.03 and [A/H] = −0.47 ± 0.10 (s.d.).
The most recent CCD photometric study of NGC 2204 available in the literature is that of Kassis et al. (1997). They obtained BVI photometry down to V ∼ 22. They found NGC 2204 to be 1.3–2.7 Gyr old, and to have (m − M)0 = 12.6–13.5, based on fits of the color–magnitude diagram (CMD) to Bertelli et al. (1994) theoretical isochrones, adopting [Fe/H] = −0.35 ± 0.08 and E(B − V) = 0.13 ± 0.04. Friel et al. (2002) obtained medium-resolution spectroscopy of 12 confirmed and probable cluster members. The resulting average metallicity is [Fe/H] = −0.32 ± 0.10. In their independent determination of the distance modulus using the Kassis et al. photometry, Twarog et al. (1997) found (m − M)V = 13.30 ± 0.20 for the cluster, adopting E(B − V) = 0.08 from Hawarden (1976).
In past papers (Jacobson et al. 2009; Friel et al. 2010), we made use of the calibrations of OC red clump MK and (J−K)0 photometry to determine distance and reddening values (Grochalski & Sarajedini 2002; Carney et al. 2005). NGC 2204 was used in the calibration of the relations in both these studies, so we adopt the values determined by Twarog et al. (1997) for the cluster, which were used by Grochalski & Sarajedini (2002). These values place NGC 2204 at Rgc = 11.6 ± 0.3 kpc from the Galactic center (adopting Rgc,☉ = 8.5 kpc) and 1.1 ± 0.1 kpc below the Galactic plane. Table 1 shows the fundamental parameters for NGC 2204, including its age as determined by Salaris et al. (2004).
Table 1. Clusters Observed
| Cluster | l | b | E(B-V) | d | Rgca | z | Ageb | Reference |
|---|---|---|---|---|---|---|---|---|
| (deg) | (deg) | (kpc) | (kpc) | (kpc) | (Gyr) | |||
| NGC 2204 | 226.0 | −16.2 | 0.08 | 4.1 ± 0.4 | 11.6 ± 0.3 | −1.1 ± 0.1 | 2.0 ± 0.3 | Twarog et al. (1997) |
| NGC 2243 | 239.5 | −18.0 | 0.11 | 3.6 ± 0.2 | 10.7 ± 0.2 | −1.1 ± 0.1 | 4.7 ± 1.2 | This study |
Notes. aR☉ = 8.5 kpc. bAdopted from Salaris et al. (2004).
Download table as: ASCIITypeset image
NGC 2243 (l = 2395, b = −180) has been subject to numerous photometric and spectroscopic studies since Hawarden (1975) presented photographic and photoelectric photometry of the cluster down to V ∼ 17. In that study, Hawarden found E(B − V) = 0.06, (m − M)0 = 12.85 ± 0.05, an age of 5.0 ± 0.8 Gyr, and [Fe/H] = −0.46 for the cluster. van den Bergh (1977) obtained photographic BV photometry to V ∼ 18, and found E(B − V) = 0.02 ± 0.02, (m − M)0 ≈ 13.3 ± 0.2, and age 5 Gyr. Norris & Hawarden (1978) found [Fe/H] = −0.7 for NGC 2243 based on DDO photometry of six likely cluster members. Both Hardy (1981) and Geisler (1987) presented Washington photometry of stars in the field and found [A/H] = −0.75 and −0.93 ± 0.15, respectively.
The first CCD photometry of NGC 2243 was obtained by Bonifazi et al. (1990) for 607 stars in the field down to V ∼ 20. Using the (B − V)–metallicity relation of Zinn & West (1984), they found [Fe/H] = −0.8 ± 0.1. Comparison of synthetic and observed CMDs resulted in E(B − V) = 0.07 ± 0.01, age 4 ± 1 Gyr, and (m − M)0 = 12.8 ± 0.2 for the cluster. Bergbusch et al. (1991) also obtained BV CCD photometry of the cluster to the same limiting magnitude as Bonifazi et al. They found [A/H] ≈ −0.7 by adopting E(B − V) = 0.06. VandenBerg et al. (2006) fit theoretical isochrones with core overshooting to the Bergbusch et al. (1991) CMD of NGC 2243. They found a good match with the parameters [Fe/H] = −0.61, [α/Fe] = +0.3, age 3.1 Gyr, E(B − V) = 0.062 and (m − M)V = 13.15. Kaluzny et al. (1996) detected a clear binary sequence in their VI CCD photometry and found E(V − I) = 0.10 ± 0.04 based on the study of a detached eclipsing binary system in the cluster. In their follow-up work of other binary systems in NGC 2243, they found (m − M)V = 13.25 ± 0.08 (Kaluzny et al. 2006). Recently, Anthony-Twarog et al. (2005) presented an analysis of deep uvbyCaHβ photometry of the cluster field. They found E(B − V) = 0.055 ± 0.004, (m − M)V = 13.15 ± 0.10, age 3.8 ± 0.2 and [Fe/H] = −0.57 ± 0.03, on the scale where the Hyades have [Fe/H] = +0.12.
High-resolution spectroscopic studies of NGC 2243 have been carried out by Gratton (1982) and Gratton & Contarini (1994) based on two giant stars. The former study was based on low signal-to-noise (S/N) photographic high-resolution echelle spectroscopy, and the latter obtained high-S/N, CCD echelle spectroscopy of the same two stars. A detailed abundance analysis of these CCD spectra resulted in [Fe/H] = −0.48 ± 0.15 for NGC 2243 and generally enhanced (0.1–0.2 dex) [X/Fe] ratios, similar to field stars of the same metallicity (Gratton & Contarini 1994).
NGC 2243 has a small but identifiable red clump and we used its location in the 2MASS6 (Cutri et al. 2003) JK CMD of the cluster to determine its distance and reddening as described in Jacobson et al. (2009) and Friel et al. (2010). The resulting distance modulus, (m − M)0 = 12.8 ± 0.1 is ∼0.1 mag smaller than that of Anthony-Twarog et al. (2005), and the reddening E(B − V) = 0.11 ± 0.04 is about twice as large as their value. This difference in distance moduli corresponds to a difference of ∼200 pc in NGC 2243's distance from the Sun and from the Galactic center. Adoption of our red clump values places NGC 2243 at Rgc = 10.7 ± 0.2 kpc and z = −1.1 ± 0.1 kpc (Table 1).
Red giant and red clump stars in NGC 2204 and NGC 2243 were targeted for observation. Target stars were selected based on their locations in the BV CMD of Kassis et al. (1997; NGC 2204) and Vby CMD of Anthony-Twarog et al. (2005; NGC 2243), and in 2MASS JK CMDs (see Figures 1 and 2). Radial velocity information from the study of Friel et al. (2002; both clusters) was also used to identify likely cluster members. Tables 2 and 3 list details of individual target stars in NGC 2204 and NGC 2243, respectively. For both clusters, we have adopted the stellar identifications used in the WEBDA7 OC database.

Figure 1. Optical (a) and near-IR (b) CMDs for NGC 2204. BV photometry comes from Kassis et al. (1997); JK photometry is from 2MASS. Confirmed radial velocity members are indicated by filled circles; non-members are dots surrounded by squares. Stars whose radial velocities (and therefore membership) could not be determined are indicated by filled triangles. See the text for more information.
Download figure:
Standard image High-resolution image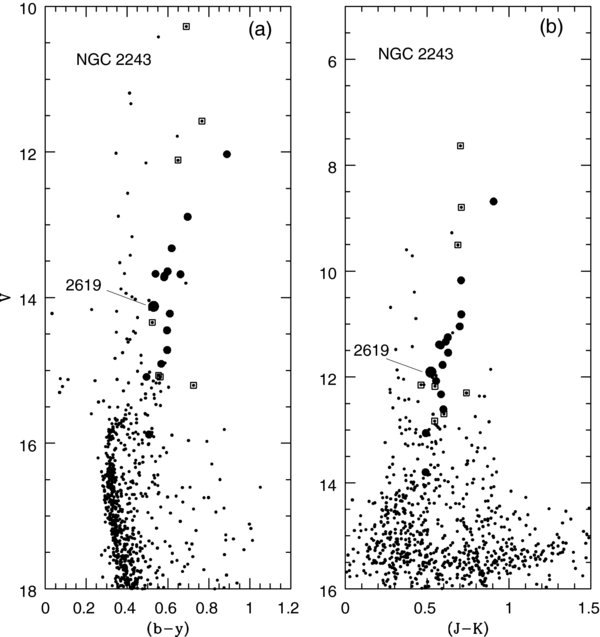
Figure 2. Optical (a) and near-IR (b) CMDs for NGC 2243. Vby photometry comes from Anthony-Twarog et al. (2005); JK photometry is from 2MASS. Confirmed radial velocity members are indicated by filled circles; non-members are indicated by dots surrounded by squares. Star 2619, which has a radial velocity consistent with cluster membership but different element abundance patterns, is identified.
Download figure:
Standard image High-resolution imageTable 2. NGC 2204 Stars Observed
| IDa | IDb | α | δ | V | B − V | J | H | K | S/N | Vrad | Member? |
|---|---|---|---|---|---|---|---|---|---|---|---|
| (J2000) | (J2000) | λ6700 | (km s−1) | ||||||||
| 1124 | 1206 | 06 15 29.08 | −18 39 10.1 | 13.835 | 0.999 | 12.009 | 11.514 | 11.426 | 15 | +86.8 | M |
| 1129 | 1057 | 06 15 31.80 | −18 39 37.2 | 12.682 | 1.242 | 10.477 | 9.814 | 9.677 | 110 | +91.4 | M |
| 1133 | 1145 | 06 15 30.44 | −18 38 24.1 | 13.749 | 1.105 | 11.762 | 11.178 | 11.05 | 70 | +87.7 | M |
| 1136 | 1170 | 06 15 29.50 | −18 37 31.5 | 12.887 | 1.754 | 8.117 | 7.223 | 6.886 | 120 | ... | Mc |
| 1212 | 1538 | 06 15 20.16 | −18 37 58.1 | 13.881 | 0.978 | 12.111 | 11.622 | 11.494 | 60 | +94.2 | M? |
| 1217 | 1607 | 06 15 18.12 | −18 37 02.5 | 14.664 | 1.029 | ... | ... | ... | 40 | +60.4 | NM |
| 1320 | 1496 | 06 15 21.54 | −18 35 53.0 | 12.607 | 1.137 | 10.560 | 9.988 | 9.849 | 15 | +87.1 | M |
| 1329 | 1356 | 06 15 25.36 | −18 33 44.3 | 11.536 | 1.165 | 9.553 | 9.036 | 8.848 | 200 | +34.4 | NM |
| 1330 | 1309 | 06 15 26.71 | −18 33 25.7 | 13.764 | 1.037 | 11.986 | 11.526 | 11.432 | 70 | +90.3 | M |
| 2120 | 796 | 06 15 38.15 | −18 38 57.6 | 11.776 | 1.363 | 9.407 | 8.781 | 8.645 | 190 | +62.6 | NM |
| 2136 | 965 | 06 15 33.92 | −18 37 21.0 | 13.122 | 1.165 | 11.020 | 10.432 | 10.304 | 95 | +89.8 | M |
| 2212 | 394 | 06 15 49.69 | −18 37 39.5 | 12.822 | 1.242 | 10.623 | 10.046 | 9.876 | 100 | +89.0 | M |
| 2222 | 611 | 06 15 42.86 | −18 35 57.8 | 13.884 | 1.271 | 11.684 | 11.112 | 10.969 | 60 | +61.7 | NM |
| 2229 | 843 | 06 15 36.96 | −18 36 09.5 | 13.833 | 1.014 | 11.997 | 11.506 | 11.391 | 60 | +87.9 | M |
| 2311 | 57 | 06 16 02.10 | −18 38 46.9 | 13.643 | 1.087 | 11.794 | 11.273 | 11.175 | 65 | +89.3 | M |
| 2333 | 1015 | 06 15 32.80 | −18 34 08.1 | 13.861 | 0.926 | 12.023 | 11.553 | 11.397 | 60 | +70.2 | NM |
| 3205 | 508 | 06 15 45.99 | −18 40 44.5 | 13.911 | 0.982 | 12.085 | 11.600 | 11.511 | 70 | +85.2 | M? |
| 3207 | 350 | 06 15 51.08 | −18 42 08.9 | 12.739 | 1.080 | 10.761 | 10.170 | 10.049 | 110 | +9.0 | NM |
| 3215 | 529 | 06 15 45.36 | −18 43 35.3 | 13.753 | 1.001 | 11.892 | 11.388 | 11.273 | 70 | +88.2 | M |
| 3304 | 151 | 06 15 58.17 | −18 40 26.6 | 12.274 | 1.432 | 9.821 | 9.086 | 8.931 | 140 | +81.4 | M,SB |
| 3324 | ... | 06 15 40.38 | −18 46 37.2 | 12.830 | 1.300 | 10.648 | 9.982 | 9.854 | 110 | +87.0 | M |
| 3325 | ... | 06 15 36.66 | −18 46 52.6 | 11.44d | 1.80d | 8.390 | 7.588 | 7.271 | 220 | +89.1 | M |
| 4103 | 1055 | 06 15 31.87 | −18 40 25.5 | 13.906 | 0.986 | 12.068 | 11.491 | 11.404 | 70 | +66.2 | NM |
| 4116 | 1272 | 06 15 27.53 | −18 40 14.5 | 13.927 | 1.061 | 11.963 | 11.402 | 11.301 | 60 | +88.1 | M |
| 4119 | 1287 | 06 15 27.27 | −18 40 44.4 | 13.691 | 1.001 | 11.771 | 11.212 | 11.113 | 60 | +107.5 | M,SB |
| 4132 | 1007 | 06 15 33.16 | −18 42 16.6 | 11.663 | 1.703 | 7.086 | 6.167 | 5.850 | 110 | ... | Mc |
| 4211 | 1745 | 06 15 13.62 | −18 41 49.8 | 13.678 | 0.984 | 11.836 | 11.296 | 11.218 | 65 | +87.7 | M |
| 4212 | 1432 | 06 15 23.69 | −18 42 41.8 | 12.392 | 0.975 | 10.593 | 10.093 | 9.958 | 120 | +19.2 | NM |
| 4216 | 1445 | 06 15 23.03 | −18 43 50.9 | 13.745 | 1.045 | 11.888 | 11.317 | 11.209 | 60 | +72.8 | NM |
| 4303 | 1976 | 06 15 03.87 | −18 41 07.8 | 13.897 | 0.962 | 12.065 | 11.564 | 11.478 | 60 | +87.6 | M |
| 4319 | 1563 | 06 15 19.46 | −18 45 03.1 | 13.167 | 1.060 | 11.102 | 10.506 | 10.417 | 90 | +55.7 | NM |
| 8001 | ... | 06 15 28.60 | −18 36 16.4 | ... | ... | 7.141 | 6.677 | 6.556 | 600 | +11.8 | NM |
| 8006 | ... | 06 15 42.41 | −18 38 18.7 | ... | ... | 10.894 | 10.307 | 10.113 | 100 | +87.7 | M |
| 8009 | ... | 06 15 52.92 | −18 35 16.5 | ... | ... | 11.622 | 11.077 | 10.834 | 30 | ... | ? |
| 8012 | ... | 06 15 52.56 | −18 32 29.1 | ... | ... | 12.257 | 11.796 | 11.670 | 60 | +82.8 | M? |
Notes. aIdentifications are those of Hawarden (1976), also used in WEBDA, save for stellar ID's beginning with 8000. Such targets were selected from the 2MASS catalog and to our knowledge have no counterpart in available optical photometric catalogs of the cluster. bKassis et al. (1997) ID. cLikely cluster member (Mermilliod & Mayor 2007). dBV photometry from Hawarden (1976).
Download table as: ASCIITypeset image
Table 3. NGC 2243 Stars Observed
| IDa | IDb | α | δ | V | b−y | J | H | K | S/N | S/N | Vrad | Member? |
|---|---|---|---|---|---|---|---|---|---|---|---|---|
| (J2000) | (J2000) | λ6240 | λ6700 | (km s−1) | ||||||||
| 239 | 34 | 06 29 04.78 | −31 21 26.3 | 13.674 | 0.539 | 11.960 | 11.482 | 11.387 | 40 | 80 | +57.9 | M |
| 259 | 81 | 06 29 05.42 | −31 17 02.2 | 14.72 | 0.596 | 12.911 | 12.446 | 12.326 | 20 | 50 | +58.0 | M |
| 365 | 47 | 06 29 09.36 | −31 10 32.4 | 14.03c | ... | 12.171 | 11.622 | 11.543 | 30 | 65 | +57.9 | M |
| 507 | 7 | 06 29 13.29 | −31 16 48.9 | 12.11 | 0.649 | 10.193 | 9.640 | 9.505 | ... | 150 | +79.3 | NM |
| 910 | 37 | 06 29 23.01 | −31 17 29.9 | 13.72 | 0.581 | 11.986 | 11.496 | 11.403 | 40 | 80 | +57.4 | M |
| 1271 | 32 | 06 29 29.43 | −31 15 46.9 | 13.70 | 0.583 | 11.946 | 11.457 | 11.333 | 30 | 80 | +57.3 | M |
| 1302 | 116 | 06 29 30.04 | −31 22 49.3 | 15.09 | 0.562 | 13.377 | 12.856 | 12.831 | ... | 45 | +70.9 | M? |
| 1313 | 12 | 06 29 30.10 | −31 16 58.7 | 12.89 | 0.696 | 10.880 | 10.302 | 10.173 | 55 | 134 | +58.6 | M |
| 1421 | 240 | 06 29 31.68 | −31 15 33.7 | 15.88 | 0.507 | 14.286 | 13.826 | 13.796 | 10 | 30 | +57.6 | M |
| 1707 | 94 | 06 29 35.16 | −31 15 47.7 | 14.91 | 0.567 | 13.208 | 12.699 | 12.609 | 10 | 30 | +57.4 | M |
| 1847 | 57 | 06 29 36.83 | −31 14 42.2 | 14.22 | 0.609 | 12.366 | 11.892 | 11.772 | 25 | 65 | +56.0 | M |
| 2410 | 30 | 06 29 45.86 | −31 15 38.7 | 13.64 | 0.598 | 11.876 | 11.361 | 11.250 | 40 | 70 | +58.1 | M |
| 2543 | 113 | 06 29 48.27 | −31 11 28.5 | 15.09 | 0.495 | 13.552 | 13.124 | 13.060 | 15 | 45 | +57.8 | M |
| 2619 | 50 | 06 29 50.21 | −31 18 53.4 | 14.12 | 0.530 | 12.430 | 11.975 | 11.907 | 35 | 70 | +58.4 | M |
| 2648 | 65 | 06 29 51.02 | −31 14 42.8 | 14.45 | 0.595 | 12.629 | 12.115 | 12.075 | 25 | 55 | +58.0 | M |
| 2704 | 105 | 06 29 52.11 | −31 16 53.2 | 15.07 | 0.554 | 13.299 | 12.755 | 12.696 | ... | 40 | +1.4 | NM |
| 3139 | 128 | 06 30 05.07 | −31 23 36.5 | 15.205 | 0.725 | 13.043 | 12.414 | 12.303 | ... | 45 | −2.8 | NM |
| 3618 | 399 | 06 29 41.51 | −31 14 36.0 | 13.68 | 0.661 | 11.742 | 11.189 | 11.043 | 35 | 70 | +57.1 | M |
| 3633 | 1139 | 06 29 28.42 | −31 17 17.5 | 12.03 | 0.888 | 9.590 | 8.872 | 8.684 | 85 | 215 | +57.3 | M |
| 3726 | ... | 06 29 13.06 | −31 18 34.6 | 11.576 | 0.766 | 9.505 | 8.939 | 8.796 | ... | 240 | +116.8 | NM |
| 3727 | ... | 06 30 08.33 | −31 18 43.6 | 10.275 | 0.689 | 8.336 | 7.781 | 7.632 | ... | 400 | +49.9 | M? |
| 3728 | ... | 06 29 11.04 | −31 20 39.2 | 13.323 | 0.618 | 11.524 | 10.976 | 10.816 | 50 | 95 | +58.3 | M |
| 3731 | ... | 06 29 42.21 | −31 23 35.6 | 14.341 | 0.523 | 12.723 | 12.240 | 12.175 | ... | 65 | +30.2 | NM |
| 3734 | ... | 06 29 17.04 | −31 24 09.4 | 14.134 | 0.521 | 12.609 | 12.214 | 12.147 | ... | 55 | −3.9 | NM |
Notes. aIdentification used in WEBDA. bIdentification from Kaluzny et al. (1996). cV magnitude from Kaluzny et al. (1996).
Download table as: ASCIITypeset image
3. OBSERVATIONS AND DATA REDUCTION
NGC 2204 and NGC 2243 were observed with the Hydra multi-object spectrograph on the CTIO Blanco 4 m telescope on 2007 January 2–3 under clear skies. The single-order spectra are centered at λ6725 with the spectral range λ6600–6860, which includes the Al i doublet at λ6696/6698, along with several Fe i lines and one line each of other elements such as Si and Ni. The 316 line mm−1 echelle grating was used in the bench-mounted spectrograph along with a slit mask to limit the size of the "large" (300 μm) fibers to an effective width of 200 μm. The resulting spectral resolution was R = (λ/Δλ) ∼ 20,000, based on measurements of the FWHM of ThAr emission lines. A series of eight 1800 s integrations was obtained of NGC 2204 over the course of both nights, and twelve 1800 s integrations were obtained for NGC 2243. Twilight sky spectra were obtained to serve as templates for radial velocity determination. In addition, a series of dome flat fields and dark frames were taken each night, along with ThAr spectra.
On 2009 March 10, CTIO Hydra observations of the same NGC 2243 field configuration were acquired on our behalf by C. I. Johnson in a series of three 1800 s integrations. These echelle spectra, also obtained with the 300 μm fibers, are centered at λ6240, with a spectral range of λ6125–6350. This spectral range includes the [O i] λ6300 feature, the Na i λ6154/6160 doublet, and a few lines each of Si, Ca, Ti, and Ni. No slit mask was used for these observations, so the resulting spectra have a resolution of R ∼18,000. Sample spectra are shown in Figure 3.
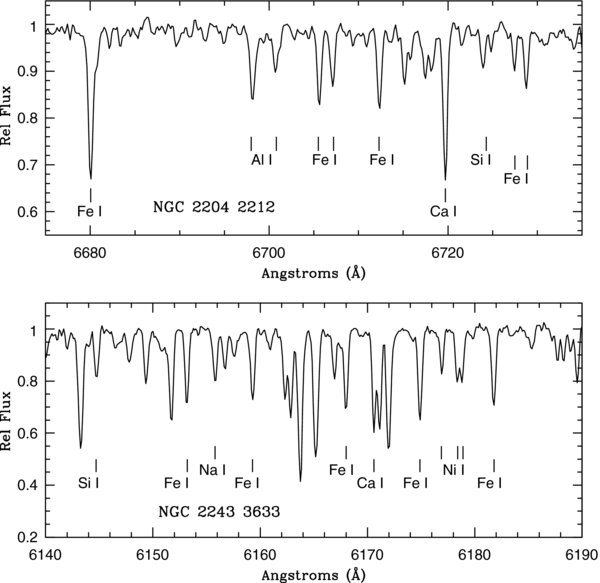
Figure 3. Sample portions of our CTIO-Hydra spectra. The top panel shows the region around the Al λ6696–6698 doublet in the spectrum of NGC 2204 2212; the bottom panel shows the region around the λ6154–6160 doublet in the spectrum of NGC 2243 3633. Some key absorption features are identified. Note the spectra are not radial velocity corrected.
Download figure:
Standard image High-resolution imageThe data were reduced using standard techniques within the IRAF8 data reduction software package. After trimming and overscan subtraction, a master bias frame was subtracted from all the data frames. Examination of the dark frames showed that no correction for dark current was necessary. Object frames were cleaned of cosmic rays using the IRAF script "L. A. Cosmic9" (van Dokkum 2001; spectroscopic version). Individual flat-field frames were combined to create a master flat that was divided into all the object frames. After division by the master flat, the object spectra were dispersion corrected using a high S/N twilight sky spectrum as template with a solar line list selected from the Moore atlas (Moore et al. 1966). Lastly, sky spectra from several fibers scattered throughout the field configurations were combined to create a high S/N sky spectrum that was then subtracted from the stellar spectra.
4. RADIAL VELOCITIES
We have verified cluster membership for the target stars using radial velocities calculated with the fxcor package in IRAF. No radial velocity standards were observed, so a high S/N twilight sky spectrum was used as a radial velocity template. Each stellar spectrum was cross-correlated with the twilight sky spectrum, and the cross-correlation peak was fit with a Gaussian. Heliocentric corrections for the two clusters were calculated using IRAF's rvcor. Stellar radial velocities corrected for solar motion are given in Tables 2 and 3 for stars in NGC 2204 and NGC 2243, respectively. Velocities for the latter cluster were determined using the λ6700 spectra. The spectra of two stars in NGC 2204, 1136 and 4132, are dominated by molecular bands. It was therefore not possible to determine their radial velocities using the twilight sky spectrum template, though we note that Mermilliod & Mayor (2007) identified them as cluster members. The spectra of two other stars, 3205 and 3325, also display strong molecular bands, yet have prominent absorption lines that made radial velocity determination possible. Both of these stars have velocities consistent with membership (see below).
Cluster membership was determined by visual examination of histograms of the velocities. The histogram for NGC 2243 exhibits a very narrow peak that clearly identifies the cluster mean velocity: 16 of the 24 observed targets have radial velocities between 55 and 60 km s−1, resulting in a cluster mean of +57.7 ± 0.6 km s−1 (s.d.). The radial velocity histogram for NGC 2204 also reveals a clear cluster locus, but with a broader distribution of velocities than that for NGC 2243. Based on 16 stars with radial velocities between 86 and 92 km s−1, we found an average +88.4 ± 1.3 km s−1 for NGC 2204. We note that the standard deviations in velocity for both clusters are consistent with the typical intrinsic velocity dispersion of OCs, ≲ 1 km s−1 (e.g., Mermilliod et al. 2008; Geller et al. 2008).
Comparison of the radial velocities for NGC 2243 stars measured from the λ6240 and λ6700 spectra revealed a systematic shift with the λ6240 velocities being +2.0 km s−1 larger. We identify NGC 2243 2704 as a binary star, as its velocities measured in the two data sets differ by ∼27 km s−1. Cross-correlation of individual apertures in the twilight sky spectrum relative to one another showed velocity shifts smaller than 0.5 km s−1. Use of a solar spectrum as radial velocity template for giant stars may also cause additional uncertainty in the velocities because of the mismatch in the spectral type. Without more precise calibration of velocities based on a radial velocity standard star, we conclude that systematic uncertainties of up to 3 km s−1 could be present in our measures.
NGC 2204 and NGC 2243 have both been subject to previous radial velocity studies. In general, our results are consistent with values in the literature. Collier Cameron & Reid (1987) obtained AAT multi-object spectra of several stars in each cluster field. They found a mean Vr = +101 ± 12 km s−1 (s.d.; 17 stars) for NGC 2204 and +69 ± 10 km s−1 (s.d.; 20 stars) for NGC 2243. Typical uncertainties in their measurements included a ∼7–10 km s−1 scatter in individual measurements and a zero-point uncertainty of ±20 km s−1 or smaller. Minniti (1995) also observed stars in both clusters. He found NGC 2204 to have a velocity of +69 ± 9 km s−1 (s.d.; 14 stars) and NGC 2243 a velocity of +61 ± 15 km s−1 (s.d.; 12 stars), based on measurements that had ∼6 km s−1 errors and a possible ∼10 km s−1 zero-point uncertainty. The sample of Friel et al. (2002) also included both clusters. They reported radial velocities with total uncertainties of 10–15 km s−1, and found +89 ± 6 km s−1 (s.d., 12 stars) and +55 ± 5 km s−1 (s.d., 9 stars) for NGC 2204 and NGC 2243, respectively. This value for NGC 2243 is lower than that earlier determined by Friel & Janes (1993) based on six stars, +62 ± 9 km s−1.
Most recently, Mermilliod & Mayor (2007) presented radial velocity determinations for each cluster based on CORAVEL data. From 25 cluster members, they determined NGC 2204 to have a mean Vr = +91.38 ± 0.30 km s−1 (s.e.), while for NGC 2243, they only observed three stars. Based on two that share a common velocity, and are in common with previous studies, they found NGC 2243 to have Vr ∼ 61 km s−1, consistent with the results of Gratton (1982) for two stars (61 km s−1). The average difference between our velocities and Mermilliod & Mayor (2007) values is 2 and 3 km s−1 for NGC 2243 and NGC 2204, respectively, with their values being larger. This difference is consistent with the estimated error in the zero point discussed above. Lastly, Mermilliod & Mayor (2007) identified stars 3304 and 4119 in NGC 2204 as possible spectroscopic binaries. We confirm these findings, as our determined radial velocities for these stars differ from those of Mermilliod & Mayor by 14 km s−1 and 9 km s−1, respectively.
5. ATMOSPHERIC PARAMETERS
Atmospheric parameters were determined from available optical and near-IR photometry for all target stars. In previous papers, our standard procedure has been to refine photometrically determined Teff, log g, and vt values in order to obtain excitation and ionization equilibrium and to remove trends of Fe i abundance with line strength. However, given the small spectral range of the single order spectra, and that the λ6700 region has few Fe i lines (and no Fe ii lines), we chose not to refine the atmospheric parameters in the spectroscopic analysis.
Effective temperatures of all target stars were calculated using the optical photometry of Kassis et al. (1997; NGC 2204) and Anthony-Twarog et al. (2005; NGC 2243), 2MASS JK photometry, and the color–Teff relations of Alonso et al. (1999). We adopted the reddening and distance values of Twarog et al. (1997) and Anthony-Twarog et al. (2005) for NGC 2204 and NGC 2243, respectively. Surface gravities were calculated using the formula:
where m is stellar mass in solar units, Mbol,☉ = 4.72, T☉ = 5770 K, and log g☉ = 4.44 (Allen 1976). Bolometric corrections were calculated using the relations of Alonso et al. (1999), and a turn-off mass of 2 m☉, as appropriate for the ages of these clusters. Lastly, a microturbulent velocity of vt = 1.5 km s−1 was adopted for all stars, which we have found to be adequate for the majority of stars in our previous work (see, e.g., Jacobson et al. 2009; Friel et al. 2010). Atmospheric parameters for stars used in the abundance analysis are shown in Table 4.
Table 4. Atmospheric Parameters and Fe Abundances for N2204 and N2243
| Cluster | Star | Teff | log g | vt | log N(Fe) | [Fe/H] | σ[Fe/H] | Number of Lines |
|---|---|---|---|---|---|---|---|---|
| (K) | (dex) | (km s−1) | (dex) | (dex) | ||||
| N2204 | 1129 | 4400 | 2.0 | 1.5 | 7.38 | −0.14 | 0.14 | 15 |
| N2204 | 1133 | 4500 | 2.5 | 1.5 | 7.17 | −0.35 | 0.18 | 15 |
| N2204 | 2136 | 4500 | 2.1 | 1.5 | 7.25 | −0.27 | 0.15 | 15 |
| N2204 | 2212 | 4500 | 2.1 | 1.5 | 7.39 | −0.13 | 0.13 | 15 |
| N2204 | 2229 | 4900 | 2.6 | 1.5 | 7.39 | −0.13 | 0.19 | 14 |
| N2204 | 2311 | 4800 | 2.5 | 1.5 | 7.33 | −0.19 | 0.14 | 12 |
| N2204 | 3215 | 4800 | 2.5 | 1.5 | 7.24 | −0.28 | 0.19 | 14 |
| N2204 | 3304 | 4200 | 1.5 | 1.5 | 7.31 | −0.21 | 0.14 | 15 |
| N2204 | 3324 | 4300 | 2.0 | 1.5 | 7.24 | −0.28 | 0.12 | 15 |
| N2204 | 4116 | 4700 | 2.5 | 1.5 | 7.26 | −0.26 | 0.23 | 15 |
| N2204 | 4119 | 4700 | 2.4 | 1.5 | 7.19 | −0.33 | 0.20 | 14 |
| N2204 | 4211 | 4800 | 2.5 | 1.5 | 7.22 | −0.29 | 0.18 | 15 |
| N2204 | 8006 | 4500 | 2.1 | 1.5 | 7.28 | −0.24 | 0.13 | 15 |
| N2243 | 239 | 5000 | 2.7 | 1.5 | 7.05 | −0.47 | 0.13 | 29 |
| N2243 | 365 | 4700 | 2.7 | 1.5 | 7.03 | −0.49 | 0.27 | 30 |
| N2243 | 910 | 4900 | 2.7 | 1.5 | 7.00 | −0.52 | 0.18 | 29 |
| N2243 | 1271 | 4900 | 2.7 | 1.5 | 7.12 | −0.40 | 0.17 | 30 |
| N2243 | 1313 | 4550 | 2.2 | 1.5 | 7.08 | −0.44 | 0.13 | 30 |
| N2243 | 2410 | 4900 | 2.7 | 1.5 | 7.08 | −0.44 | 0.15 | 29 |
| N2243 | 2619 | 5100 | 2.9 | 1.5 | 7.35 | −0.17 | 0.22 | 29 |
| N2243 | 3618 | 4600 | 2.5 | 1.5 | 7.08 | −0.44 | 0.22 | 28 |
| N2243 | 3633 | 4100 | 1.5 | 1.5 | 7.19 | −0.33 | 0.15 | 30 |
| N2243 | 3728 | 4800 | 2.5 | 1.5 | 7.13 | −0.39 | 0.16 | 30 |
Download table as: ASCIITypeset image
Uncertainties in these photometrically determined atmospheric parameters arise both from uncertainties in the reddening and distances to the clusters and the scatter around the color–temperature relations of Alonso et al. (1999; such scatter ranges 40–150 K). To estimate uncertainties in Teff and log g due to the former, we performed the calculations using a range of E(B − V) values and distance moduli found in the literature for the clusters. For NGC 2204, a range of 0.09 mag in E(B − V) encompassed the values found in the literature, including uncertainties, along with a range of 0.5 mag in distance modulus. Effective temperatures and gravities varied by ∼200 K and 0.2 dex using this range of values. A much better consensus exists in the literature for the reddening and distance of NGC 2243: changing E(B − V) by 0.03 mag and the distance modulus by 0.3 mag varied temperatures and gravities by ∼100 K and 0.1 dex, respectively. To be conservative, we adopted ±200 K and ±0.2 dex as the uncertainties in our Teff and log g values. (Note that the 200 pc difference between the distance to NGC 2243 in Table 1 and that of Anthony-Twarog et al. (2005) corresponds to a 0.1 dex difference in log g, which is reflected in the uncertainty analysis described above.) We estimated the uncertainty in microturbulent velocity to be ±0.2 km s−1, based on the general range of values found in the literature for giant stars of similar temperature and gravity (see, e.g., discussion in Friel et al. 2010).
Abundance uncertainties as a result of uncertainties in each of the atmospheric parameters are shown in Table 5 for stars 239 and 3633 in NGC 2243, which represent the hotter and cooler stars in our sample, respectively. Previous work on these clusters has shown them to be metal-poor (recall Section 2), so model atmospheres with subsolar metallicities were used for NGC 2204 and NGC 2243 stars. Although we do not expect 0.5 dex uncertainties in model metallicities as shown in Table 5, corresponding abundance uncertainties are given as indication of sensitivities to model metallicity.
Table 5. Abundance Uncertainties Due to Atmospheric Parameters
| Star | [X/H] | Teff | log g | vt | [M/H] |
|---|---|---|---|---|---|
| +200 K | +0.2 dex | +0.2 km s−1 | +0.5 dex | ||
| N2243 239 | Fe i | +0.17 | +0.00 | −0.06 | +0.01 |
| Fe ii | −0.10 | +0.09 | −0.05 | +0.20 | |
| Na i | +0.12 | −0.01 | −0.02 | +0.01 | |
| Mg i | ... | ... | ... | ... | |
| Al i | +0.11 | −0.01 | −0.02 | +0.00 | |
| Si i | +0.02 | +0.01 | −0.02 | +0.09 | |
| Ca i | +0.16 | −0.02 | −0.07 | −0.01 | |
| Ti i | +0.22 | +0.00 | −0.02 | −0.02 | |
| Cr i | +0.22 | +0.00 | −0.01 | −0.01 | |
| Ni i | +0.13 | +0.02 | −0.04 | +0.06 | |
| Zr i | ... | ... | ... | ... | |
| N2243 3633 | Fe i | +0.01 | +0.04 | −0.11 | +0.14 |
| Fe ii | −0.37 | +0.13 | −0.06 | +0.23 | |
| Na i | +0.19 | −0.02 | −0.06 | +0.01 | |
| Mg i | +0.00 | +0.03 | −0.02 | +0.07 | |
| Al i | +0.15 | −0.01 | −0.05 | +0.01 | |
| Si i | −0.18 | +0.05 | −0.03 | +0.14 | |
| Ca i | +0.24 | −0.03 | −0.13 | +0.04 | |
| Ti i | +0.34 | +0.02 | −0.11 | +0.05 | |
| Cr i | +0.31 | +0.03 | −0.06 | +0.07 | |
| Ni i | −0.06 | +0.06 | −0.07 | +0.14 | |
| Zr i | +0.46 | +0.03 | −0.09 | +0.08 | |
Download table as: ASCIITypeset image
In previous work, we found it necessary to decrease photometrically determined log g values by ∼0.2–0.3 dex in order to bring abundances of Fe i and Fe ii into agreement (typically within ∼0.1 dex; see, e.g., Friel et al. 2010). As we had no way of verifying ionization equilibrium in this analysis, the values in Table 5 are indicative of abundance sensitivity to poorly constrained log g values. As can be seen, abundances of all species save Fe ii10 change by at most 0.06 dex as a result of uncertainties in log g.
Atmospheric parameters for many of our program stars have been determined previously. Geisler (1987) determined effective temperatures of several stars in NGC 2204 and NGC 2243 based on Washington photometry; Houdashelt et al. (1992) determined Teff and log g values for stars in both clusters using infrared photometry. We found general good agreement between our determined parameters and theirs. Considering Geisler (1987), the average magnitude of the difference between his Teff values and ours is +125 ± 75 K (s.d., seven stars), with our values typically being larger. Agreement between Teff values is even better for the 10 stars in common with Houdashelt et al., with the average magnitude of the difference being +60 ± 40 K (s.d.), again with our values being larger for most stars. Our log g values are also systematically larger than those of Houdashelt et al. by 0.2 ± 0.1 dex (s.d.). Gratton & Contarini performed a detailed abundance analysis of stars 1313 and 3633 in NGC 2243. Our effective temperatures are in excellent agreement with theirs (within 50 K), but our log g values are 0.2 dex larger. Microturbulent velocities agree within 0.1 km s−1.
6. ABUNDANCE ANALYSIS
Details of our methods of abundance analysis have been described in previous papers, so we provide only a brief summary here (see Friel et al. 2003 and Jacobson et al. 2008 for more information). In summary, our line list is composed of lines selected to be relatively free from blends at echelle resolutions, although some lines (particularly for the non-Fe elements) are blended in these lower resolution Hydra spectra. log gf values were determined relative to the metal-poor giant Arcturus, for which we adopted the abundances of Fulbright et al. (2006, 2007) and, for elements not in their analysis, of Peterson et al. (1993). Model atmospheres were interpolated from a grid of plane parallel MARCS models (Bell et al. 1976), and the abundance analysis was performed using the 2002 version of MOOG (Sneden 1973).
Element abundances were determined based on measurement of equivalent widths (EWs) of absorption lines. EWs were fit with Gaussians using interactive routines in IRAF. Table 6, fully available in electronic format, lists the EW measures for stars used in the abundance analysis. We referred to the high-resolution Arcturus atlas (Hinkle et al. 2000) to aid in continuum placement. Typical measurement uncertainties were 2–5 mÅ, based on repeated measurements of individual lines and differences between lines measured in stars with similar atmospheric parameters. Formal EW uncertainties as determined using the Cayrel (1988) formula are 1–3 mÅ for the λ6700 spectra. S/N levels of the λ6240 spectra of NGC 2243 stars were lower, so the EW measurements for most stars were more uncertain (3–5 mÅ). EW measurement errors obviously contribute to uncertainties in the derived abundances. Such uncertainties were assessed by calculating abundances using the largest and smallest EW measurements for each line for each star; for all elements save Zr, EW uncertainties resulted in abundance uncertainties on order ∼0.05 dex. The abundance of zirconium rests on the measure of two relatively weak absorption lines in the typically low-S/N λ6240 spectra and was found to vary on average 0.09 dex due to the line measurement uncertainty. We note here that not all confirmed radial velocity members of NGC 2204 were used in the abundance analysis. Excluded objects were those with poorer S/N (≲ 60) for which continuum placement was difficult and those stars that exhibit molecular features in their spectra (Section 4).
Table 6. Equivalent Width Measurements
| λ | El. | E.P. | log gf | N2204 1129 | N2204 1133 | N2204 2136 | N2204 2212 |
|---|---|---|---|---|---|---|---|
| 6696.030 | 13.0 | 3.14 | −1.45 | 105 | 97 | 93 | 96 |
| 6698.670 | 13.0 | 3.13 | −1.87 | 56 | 57 | 56 | 53 |
| 6721.850 | 14.0 | 5.86 | −1.00 | 62 | 48 | 52 | 58 |
| 6743.120 | 22.0 | 0.90 | −1.54 | 121 | 85 | 97 | 92 |
| 6630.010 | 24.0 | 1.03 | −3.56 | 73 | 30 | 37 | ... |
| 6646.930 | 26.0 | 2.56 | −2.54 | 77 | 31 | 47 | 62 |
| 6648.080 | 26.0 | 2.61 | −3.96 | 96 | 43 | 65 | 72 |
| 6699.160 | 26.0 | 1.01 | −5.84 | 21 | 15 | 25 | 25 |
| 6703.567 | 26.0 | 4.59 | −2.11 | 107 | 86 | 97 | 108 |
| 6705.103 | 26.0 | 2.76 | −3.12 | 78 | 66 | 85 | 81 |
Only a portion of this table is shown here to demonstrate its form and content. Machine-readable and Virtual Observatory (VO) versions of the full table are available.
Download table as: Machine-readable (MRT)Virtual Observatory (VOT)Typeset image
Individual star Fe abundances and standard deviations of the mean are listed in Table 4, while other element log N(X) abundances and standard deviations are given in Tables 7 and 8. [X/H] and [X/Fe] ratios relative to the solar abundances of Anders & Grevesse (1989) are given in Tables 9 and 10. Results for all NGC 2243 stars are based on EWs from both λ6700 and λ6240 spectra. In spite of the lower S/N of the latter, element abundances from the two spectral regions were in good agreement with comparable line-by-line dispersion about the mean. For each element, σ[X/Fe] was determined by adding σ[X/H] and σ[Fe/H] in quadrature. For elements whose abundances are based on measurement of a single absorption line, the [X/H] value was assigned an uncertainty based upon the S/N of the λ6700 spectrum: 0.1 dex for better quality spectra (S/N ≳ 80)and 0.2 dex for lower quality. The Mg i abundances for NGC 2243 stars, which are based on measurement of the λ6319 line, were assigned an uncertainty of 0.2 dex. Because of the small number of absorption lines for most elements and the low S/N spectra of many stars, we have calculated weighted mean cluster abundances (Taylor 1982). This places greater weight on stars with relatively small abundance uncertainties and higher S/N. Weighted cluster average abundances are shown in Table 11 along with their corresponding dispersions.
Table 7. Abundances of Al, Si, Ti, Cr, and Ni
| ID | log N(Al) | σAl | Number | log N(Si) | σSi | Number | log N(Ti) | σTi | Number | log N(Cr) | σCr | Number | log N(Ni) | σNi | Number |
|---|---|---|---|---|---|---|---|---|---|---|---|---|---|---|---|
| of Lines | of Lines | of Lines | of Lines | of Lines | |||||||||||
| N2204 1129 | 6.43 | 0.22 | 2 | 7.66 | ... | 1 | 4.53 | ... | 1 | 5.26 | ... | 1 | 6.00 | ... | 1 |
| N2204 1133 | 6.44 | 0.12 | 2 | 7.45 | ... | 1 | 4.20 | ... | 1 | 4.78 | ... | 1 | 6.20 | ... | 1 |
| N2204 2136 | 6.42 | 0.10 | 2 | 7.44 | ... | 1 | 4.37 | ... | 1 | 4.90 | ... | 1 | 6.13 | ... | 1 |
| N2204 2212 | 6.41 | 0.16 | 2 | 7.53 | ... | 1 | 4.28 | ... | 1 | ... | ... | 1 | 6.18 | ... | 1 |
| N2204 2229 | 6.33 | 0.10 | 2 | 7.38 | ... | 1 | 4.43 | ... | 1 | ... | ... | 1 | 5.87 | ... | 1 |
| N2204 2311 | 6.34 | 0.01 | 2 | 7.64 | ... | 1 | 4.44 | ... | 1 | ... | ... | 1 | 6.09 | ... | 1 |
| N2204 3215 | 6.38 | 0.29 | 2 | 7.42 | ... | 1 | 4.33 | ... | 1 | ... | ... | 1 | 5.89 | ... | 1 |
| N2204 3304 | 6.50 | 0.19 | 2 | 7.51 | ... | 1 | 4.39 | ... | 1 | 4.97 | ... | 1 | 5.99 | ... | 1 |
| N2204 3324 | 6.27 | 0.18 | 2 | 7.55 | ... | 1 | 4.15 | ... | 1 | 4.97 | ... | 1 | 6.05 | ... | 1 |
| N2204 4116 | 6.27 | 0.08 | 2 | 7.33 | ... | 1 | 4.59 | ... | 1 | 5.35 | ... | 1 | 5.92 | ... | 1 |
| N2204 4119 | 6.49 | 0.02 | 2 | 7.35 | ... | 1 | 4.41 | ... | 1 | 5.25 | ... | 1 | 5.93 | ... | 1 |
| N2204 4211 | 6.10 | 0.06 | 2 | 7.16 | ... | 1 | 4.44 | ... | 1 | 5.31 | ... | 1 | 6.10 | ... | 1 |
| N2204 8006 | 6.34 | 0.25 | 2 | 7.42 | ... | 1 | 4.43 | ... | 1 | 5.22 | ... | 1 | 5.91 | ... | 1 |
| N2243 239 | 6.24 | 0.04 | 2 | 7.22 | 0.26 | 3 | 4.44 | 0.19 | 2 | 5.06 | ... | 1 | 5.83 | 0.13 | 5 |
| N2243 365 | 6.17 | 0.07 | 2 | 7.42 | 0.17 | 5 | 4.54 | 0.32 | 3 | 4.81 | ... | 1 | 5.84 | 0.17 | 5 |
| N2243 910 | 6.25 | 0.18 | 2 | 7.39 | 0.13 | 3 | 4.49 | 0.28 | 2 | 5.24 | ... | 1 | 5.77 | 0.19 | 4 |
| N2243 1271 | 6.36 | 0.26 | 2 | 7.31 | 0.18 | 3 | 4.58 | 0.18 | 3 | 5.30 | ... | 1 | 5.79 | 0.17 | 5 |
| N2243 1313 | 6.15 | 0.18 | 2 | 7.34 | 0.07 | 4 | 4.45 | 0.01 | 2 | 4.93 | ... | 1 | 5.85 | 0.12 | 6 |
| N2243 2410 | 6.25 | 0.19 | 2 | 7.35 | 0.20 | 5 | 4.41 | 0.03 | 2 | 5.41 | ... | 1 | 5.85 | 0.11 | 6 |
| N2243 2619 | 6.60 | 0.05 | 2 | 7.33 | 0.23 | 4 | 5.00 | 0.17 | 3 | 5.65 | ... | 1 | 6.08 | 0.16 | 3 |
| N2243 3618 | 6.10 | 0.03 | 2 | 7.37 | 0.17 | 5 | 4.30 | 0.13 | 3 | 4.93 | ... | 1 | 5.78 | 0.10 | 6 |
| N2243 3633 | 6.26 | 0.21 | 2 | 7.63 | 0.21 | 5 | 4.35 | 0.14 | 3 | 4.83 | ... | 1 | 5.86 | 0.06 | 6 |
| N2243 3728 | 6.32 | 0.09 | 2 | 7.34 | 0.18 | 4 | 4.71 | 0.30 | 3 | 5.20 | ... | 1 | 5.90 | 0.19 | 6 |
Download table as: ASCIITypeset image
Table 8. Abundances of Na, Mg, Ca, and Zr
| ID | log N(Na) | σNa | Number of Lines | log N(Mg) | σMg | Number of Lines | log N(Ca) | σCa | Number of Lines | log N(Zr) | σZr | Number of Lines |
|---|---|---|---|---|---|---|---|---|---|---|---|---|
| N2243 239 | 5.92 | 0.04 | 2 | ... | ... | ... | 6.03 | 0.10 | 3 | ... | ... | ... |
| N2243 365 | 5.82 | 0.12 | 2 | 7.49 | ... | 1 | 6.02 | 0.06 | 3 | ... | ... | ... |
| N2243 910 | 5.90 | ... | 1 | 7.34 | ... | 1 | 5.89 | 0.09 | 3 | 2.37 | ... | 1 |
| N2243 1271 | 5.97 | 0.17 | 2 | 7.31 | ... | 1 | 6.14 | 0.16 | 3 | ... | ... | ... |
| N2243 1313 | 5.87 | 0.11 | 2 | 7.29 | ... | 1 | 5.92 | 0.20 | 3 | 2.11 | 0.05 | 2 |
| N2243 2410 | 5.97 | 0.05 | 2 | 7.34 | ... | 1 | 5.90 | 0.28 | 3 | 2.59 | ... | 1 |
| N2243 2619 | 6.16 | 0.02 | 2 | ... | ... | ... | 6.58 | 0.08 | 3 | ... | ... | ... |
| N2243 3618 | 5.85 | 0.10 | 2 | 7.24 | ... | 1 | 6.01 | 0.07 | 3 | 2.07 | ... | 1 |
| N2243 3633 | 5.98 | 0.09 | 2 | 7.38 | ... | 1 | 6.02 | 0.20 | 3 | 1.99 | 0.06 | 2 |
| N2243 3728 | 5.95 | 0.02 | 2 | 7.40 | ... | 1 | 6.17 | 0.13 | 3 | 2.57 | 0.01 | 2 |
Download table as: ASCIITypeset image
Table 9. Al, Si, Ti, Cr, and Ni Abundance Ratios
| ID | [Al/H] | [Al/Fe] | σ[Al/Fe] | [Si/H] | [Si/Fe] | σ[Si/Fe] | [Ti/H] | [Ti/Fe] | σ[Ti/Fe] | [Cr/H] | [Cr/Fe] | σ[Cr/Fe] | [Ni/H] | [Ni/Fe] | σ[Ni/Fe] |
|---|---|---|---|---|---|---|---|---|---|---|---|---|---|---|---|
| N2204 1129 | −0.04 | +0.10 | 0.26 | +0.11 | +0.25 | 0.17 | −0.46 | −0.32 | 0.17 | −0.41 | −0.27 | 0.17 | −0.25 | −0.11 | 0.17 |
| N2204 1133 | −0.03 | +0.32 | 0.22 | −0.10 | +0.25 | 0.27 | −0.79 | −0.44 | 0.27 | −0.89 | −0.54 | 0.27 | −0.05 | +0.30 | 0.27 |
| N2204 2136 | −0.05 | +0.22 | 0.18 | −0.11 | +0.16 | 0.18 | −0.62 | −0.35 | 0.18 | −0.77 | −0.50 | 0.18 | −0.12 | +0.15 | 0.18 |
| N2204 2212 | −0.06 | +0.07 | 0.21 | −0.02 | +0.11 | 0.16 | −0.71 | −0.58 | 0.16 | ... | ... | ... | −0.07 | +0.06 | 0.16 |
| N2204 2229 | −0.14 | −0.01 | 0.21 | −0.17 | −0.04 | 0.28 | −0.56 | −0.43 | 0.28 | ... | ... | ... | −0.38 | −0.25 | 0.28 |
| N2204 2311 | −0.13 | +0.06 | 0.14 | +0.09 | +0.28 | 0.24 | −0.55 | −0.36 | 0.24 | ... | ... | ... | −0.16 | +0.03 | 0.24 |
| N2204 3215 | −0.09 | +0.19 | 0.35 | −0.13 | +0.15 | 0.28 | −0.66 | −0.38 | 0.28 | ... | ... | ... | −0.36 | −0.08 | 0.28 |
| N2204 3304 | +0.03 | +0.24 | 0.24 | −0.04 | +0.17 | 0.17 | −0.60 | −0.39 | 0.17 | −0.70 | −0.49 | 0.17 | −0.26 | −0.05 | 0.17 |
| N2204 3324 | −0.20 | +0.08 | 0.22 | +0.00 | +0.28 | 0.16 | −0.84 | −0.56 | 0.16 | −0.70 | −0.42 | 0.16 | −0.20 | +0.08 | 0.16 |
| N2204 4116 | −0.20 | +0.06 | 0.24 | −0.22 | +0.04 | 0.30 | −0.40 | −0.14 | 0.30 | −0.32 | −0.06 | 0.30 | −0.33 | −0.07 | 0.30 |
| N2204 4119 | +0.02 | +0.35 | 0.20 | −0.20 | +0.13 | 0.28 | −0.58 | −0.25 | 0.28 | −0.42 | −0.09 | 0.28 | −0.32 | +0.01 | 0.28 |
| N2204 4211 | −0.37 | −0.07 | 0.19 | −0.39 | −0.09 | 0.27 | −0.55 | −0.25 | 0.27 | −0.36 | −0.06 | 0.27 | −0.15 | +0.15 | 0.27 |
| N2204 8006 | −0.13 | +0.11 | 0.28 | −0.13 | +0.11 | 0.16 | −0.56 | −0.32 | 0.16 | −0.45 | −0.21 | 0.16 | −0.34 | −0.10 | 0.16 |
| N2243 239 | −0.23 | +0.24 | 0.14 | −0.33 | +0.14 | 0.29 | −0.55 | −0.08 | 0.23 | −0.61 | −0.14 | 0.16 | −0.42 | +0.05 | 0.18 |
| N2243 365 | −0.30 | +0.19 | 0.28 | −0.13 | +0.36 | 0.32 | −0.45 | +0.04 | 0.34 | −0.86 | −0.37 | 0.34 | −0.41 | +0.08 | 0.42 |
| N2243 910 | −0.22 | +0.30 | 0.25 | −0.16 | +0.36 | 0.22 | −0.50 | +0.02 | 0.33 | −0.43 | +0.09 | 0.21 | −0.48 | +0.04 | 0.26 |
| N2243 1271 | −0.11 | +0.29 | 0.31 | −0.24 | +0.16 | 0.25 | −0.41 | −0.01 | 0.25 | −0.37 | +0.03 | 0.20 | −0.46 | −0.06 | 0.24 |
| N2243 1313 | −0.32 | +0.12 | 0.22 | −0.21 | +0.23 | 0.15 | −0.54 | −0.10 | 0.13 | −0.74 | −0.30 | 0.16 | −0.40 | +0.04 | 0.18 |
| N2243 2410 | −0.22 | +0.22 | 0.24 | −0.20 | +0.24 | 0.25 | −0.58 | −0.14 | 0.15 | −0.26 | +0.18 | 0.25 | −0.40 | +0.04 | 0.19 |
| N2243 2619 | +0.13 | +0.30 | 0.23 | −0.22 | −0.05 | 0.32 | +0.01 | +0.18 | 0.28 | −0.02 | +0.15 | 0.30 | −0.17 | +0.00 | 0.27 |
| N2243 3618 | −0.37 | +0.07 | 0.22 | −0.18 | +0.26 | 0.28 | −0.69 | −0.25 | 0.26 | −0.74 | −0.30 | 0.30 | −0.47 | −0.03 | 0.24 |
| N2243 3633 | −0.21 | +0.12 | 0.26 | +0.08 | +0.41 | 0.26 | −0.64 | −0.31 | 0.21 | −0.84 | −0.51 | 0.18 | −0.39 | −0.06 | 0.16 |
| N2243 3728 | −0.15 | +0.24 | 0.18 | −0.21 | +0.18 | 0.24 | −0.28 | +0.11 | 0.34 | −0.47 | −0.08 | 0.19 | −0.35 | +0.04 | 0.25 |
Download table as: ASCIITypeset image
Table 10. Na, Mg, Ca, and Zr Abundance Ratios
| ID | [Na/H] | [Na/Fe] | σ[Na/Fe] | [Mg/H] | [Mg/Fe] | σ[Mg/Fe] | [Ca/H] | [Ca/Fe] | σ[Ca/Fe] | [Zr/H] | [Zr/Fe] | σ[Zr/Fe] |
|---|---|---|---|---|---|---|---|---|---|---|---|---|
| N2243 239 | −0.41 | +0.06 | 0.14 | ... | ... | ... | −0.33 | +0.14 | 0.16 | ... | ... | ... |
| N2243 365 | −0.51 | −0.02 | 0.30 | −0.09 | +0.40 | 0.34 | −0.34 | +0.15 | 0.28 | ... | ... | ... |
| N2243 910 | −0.43 | +0.09 | 0.21 | −0.24 | +0.28 | 0.27 | −0.47 | +0.05 | 0.20 | −0.23 | +0.29 | 0.27 |
| N2243 1271 | −0.36 | +0.04 | 0.24 | −0.27 | +0.13 | 0.26 | −0.22 | +0.18 | 0.23 | ... | ... | ... |
| N2243 1313 | −0.46 | −0.02 | 0.17 | −0.29 | +0.15 | 0.24 | −0.44 | +0.00 | 0.24 | −0.49 | −0.05 | 0.14 |
| N2243 2410 | −0.36 | +0.08 | 0.16 | −0.24 | +0.20 | 0.25 | −0.46 | −0.02 | 0.32 | −0.01 | +0.43 | 0.25 |
| N2243 2619 | −0.17 | +0.00 | 0.22 | ... | ... | ... | +0.22 | +0.39 | 0.23 | ... | ... | ... |
| N2243 3618 | −0.48 | −0.04 | 0.24 | −0.34 | +0.10 | 0.30 | −0.35 | +0.09 | 0.23 | −0.53 | −0.09 | 0.30 |
| N2243 3633 | −0.35 | −0.02 | 0.17 | −0.20 | +0.13 | 0.18 | −0.34 | −0.01 | 0.25 | −0.61 | −0.28 | 0.16 |
| N2243 3728 | −0.38 | +0.01 | 0.16 | −0.18 | +0.21 | 0.26 | −0.19 | +0.20 | 0.21 | −0.03 | +0.36 | 0.16 |
Download table as: ASCIITypeset image
Table 11. Cluster Weighted Mean Element Abundances
| Element | NGC 2204 | NGC 2243 | Element | NGC 2204 | NGC 2243 |
|---|---|---|---|---|---|
| [Fe/H] | −0.23 ± 0.04 | −0.42 ± 0.05 | ... | ... | ... |
| [Na/H] | ... | −0.31 ± 0.01 | [Na/Fe] | ... | +0.03 ± 0.06 |
| [Mg/H] | ... | −0.22 ± 0.06 | [Mg/Fe] | ... | +0.18 ± 0.09 |
| [Al/H] | −0.11 ± 0.01 | −0.24 ± 0.02 | [Al/Fe] | +0.12 ± 0.06 | +0.21 ± 0.07 |
| [Si/H] | −0.06 ± 0.04 | −0.19 ± 0.05 | [Si/Fe] | +0.16 ± 0.06 | +0.24 ± 0.08 |
| [Ca/H] | ... | −0.26 ± 0.03 | [Ca/Fe] | ... | +0.13 ± 0.07 |
| [Ti/H] | −0.62 ± 0.04 | −0.54 ± 0.01 | [Ti/Fe] | −0.40 ± 0.06 | −0.10 ± 0.07 |
| [Cr/H] | −0.59 ± 0.04 | −0.56 ± 0.04 | [Cr/Fe] | −0.33 ± 0.07 | −0.15 ± 0.07 |
| [Ni/H] | −0.22 ± 0.04 | −0.40 ± 0.04 | [Ni/Fe] | +0.01 ± 0.06 | +0.01 ± 0.07 |
| [Zr/H] | ... | −0.06 ± 0.01 | [Zr/Fe] | ... | +0.06 ± 0.08 |
Download table as: ASCIITypeset image
Lastly, we note that the mean Ti abundances for NGC 2204 in Table 11 seem very low, suggestive of a systematic offset. For all the stars in NGC 2243, comparison of abundances from individual Ti i lines showed that the abundance of the λ6743 line was systematically lower than those of the λ6312 and λ6336 lines by an average 0.3 dex (0.16 dex standard deviation). This may indicate that the real Ti abundances for NGC 2204 are possibly ∼0.3 dex larger than shown in Table 9, so we looked for a similar systematic difference in the results for stars in our previous work (Jacobson et al. 2009; Friel et al. 2010). Comparison of the abundances from these three lines in stars from these studies showed no systematic offset. To test whether or not a systematic difference could arise due to the lower spectral resolution and S/N of the CTIO-Hydra spectra relative to the R ∼ 30,000, high S/N spectra of stars in our previous work, we convolved the Hinkle et al. (2000) spectrum of Arcturus with a Gaussian to match the resolution of our Hydra spectra and searched for differences in the EW measurements. The EW measures of the three Ti lines in the degraded Arcturus spectrum were systematically larger than in the original spectrum, as one might expect and as found in previous investigations of the effects of spectral resolution on abundance determinations (Jacobson et al. 2008). However, the change in EW with spectral resolution for the λ6743 line was no different than for the other two.
Line blending, telluric contamination, or errors in continuum placement are also possible causes of systematic errors in the titanium abundance. No obvious errors in the continuum placement were found in either wavelength region, and none of the lines were affected by telluric absorption. Of the three lines, the λ6743 line is least affected by blends. Therefore, if line blending is causing the λλ6312, 6336 line abundances to be systematically high (although we took special care to deblend features in the EW measuring process), then the λ6743 line abundance may be more correct. In which case, the Ti abundance for NGC 2204 would not be systematically low, rather the Ti abundances for NGC 2243 would be overestimated. Ultimately, the Ti abundances for both these clusters need to be verified with follow-up high-resolution, multi-order spectroscopy that will allow for a more robust determination. In the same vein, we remind the reader that the Si, Cr, and Ni abundances for NGC 2204 also rest on measurements of a single line each, per star, and therefore are also very uncertain. It is reassuring that both clusters have [Ni/Fe] = 0.01, which is a good indicator of the stability of the analysis.
7. OXYGEN IN NGC 2243
Only star 3633 in the NGC 2243 sample had a sufficient S/N ratio to allow for measurement of its oxygen abundance from the [O i] λ6300 feature. As star 3633 has a radial velocity of +57 km s−1, its spectrum was shifted such that the redward wing of the [O i] λ6300 line was affected by telluric absorption. An observation of the hot star HR 2282 obtained the same night as the NGC 2243 observations was used to divide out the telluric feature from the object spectrum using the telluric package in IRAF.
As in our previous work, we determined the oxygen abundance via spectrum synthesis using the atmospheric parameters for star 3633 given in Table 4 and a line list from C. Sneden (2003, private communication). Synthetic spectra were generated in MOOG and then convolved with a Gaussian to match the resolution of the Hydra spectrum. Sets of three synthetic spectra with the oxygen abundance varied in steps of 0.15 dex were generated at one time and overlaid onto the observed spectrum. The best-fit synthesis was then determined by eye (see Figure 4). The abundance uncertainty due to this fitting method was determined by decreasing the oxygen abundance step size between the synthetic spectra until a single best match could no longer be identified; this was 0.04 dex.
Figure 4. Spectrum synthesis of the [O i] λ6300 feature in NGC 2243 3633. Synthetic spectra with varying oxygen abundance are compared to the observed spectrum.
Download figure:
Standard image High-resolution imageUncertainties in oxygen abundances not only arise from uncertainties in atmospheric parameters but uncertainties in abundances of carbon and nitrogen as well. In previous papers, we started with the assumption that a giant star has [C/H] = −0.2 and [N/H] = +0.2, as found for evolved stars in M 67 (Tautvaišienė et al. 2000). NGC 2243 is more metal-poor than solar-metallicity M 67, so in this case we adopted [C/Fe] = −0.20 and [N/Fe] = +0.30, as found for stars with [Fe/H] ∼ −0.4 by Tautvaišienė et al. (2010). The best-fit oxygen abundance is log N(O) = 8.59, or [O/H] = −0.34, adopting log N(O) = 8.93 for the Sun from Anders & Grevesse (1989), the default value in MOOG. Star 3633 indicates that NGC 2243 has a scaled solar oxygen abundance.
Table 12 shows the oxygen abundance ratios for 3633, along with uncertainties due to different parameters. As can be seen, the largest contributors to error in the oxygen abundance are uncertainties in log g and the carbon abundance (for which we have adopted a conservative uncertainty of 0.3 dex). Combination of all the individual uncertainties results in a total uncertainty of 0.16 dex when added in quadrature.
Table 12. NGC 2243 3633 Oxygen Abundances and Uncertainties
| Parameter | [O/H] | [O/Fe] | Δ[O/H] |
|---|---|---|---|
| Best fit | −0.34 ± 0.04 | −0.01 ± 0.16 | ... |
| Teff+200 K | −0.39 | −0.06 | −0.05 |
| log g+0.2 (dex) | −0.24 | +0.09 | +0.10 |
| vt+0.2 (km s−1) | −0.34 | −0.01 | +0.00 |
| Smooth+0.03 | −0.29 | +0.04 | +0.05 |
| [N/H]+0.3 | −0.34 | −0.01 | +0.00 |
| [C/H]+0.3 | −0.24 | +0.09 | +0.10 |
Download table as: ASCIITypeset image
The [O i] λ6300 feature is blended with a Ni line and CN feature on its red wing. All of these features are included in the synthesis line list. The effect of this Ni/CN feature on the measured oxygen abundance was investigated in a similar fashion to that described in Friel et al. (2003). Namely, we repeated the synthesis without the [O i] feature, and then measured the EW of the Ni/CN feature. Comparing it to the EW of the [O i] feature in the best-fit synthetic spectrum, we estimated that ∼10% of the strength of the [O i] feature is due to the presence of Ni/CN. This corresponds to an abundance uncertainty of ∼0.06 dex in [O/H]. However, the syntheses were performed including the Ni abundance found for 3633 in the EW analysis, so the uncertainty in the oxygen abundance as a result of the presence of the Ni feature should be much less than this. Lastly, we note that the log gf value adopted for the Ni feature, −3.0, is smaller than that found by, e.g., Johansson et al. (2003; −2.11). A repeat of the spectrum synthesis analysis with log gf = −2.11 resulted in the same best-fit oxygen abundance, log N(O) = 8.59.
8. RESULTS AND COMPARISON TO PREVIOUS STUDIES
We have found weighted mean [Fe/H] values of −0.23 ± 0.04 (13 stars) and −0.42 ± 0.05 (10 stars) for NGC 2204 and NGC 2243, respectively. Figure 5 shows [Fe/H] values of individual stars plotted as a function of effective temperature; as can be seen, no trend is present for either NGC 2204 or NGC 2243. The Fe abundance of star 2619 in NGC 2243 is nearly 0.3 dex higher than the cluster mean, as shown in both Figure 5 and Table 4. Its radial velocity, +58.4 km s−1, is within 1 km s−1 of the cluster mean, consistent with cluster membership, and is 13 km s−1 larger than expected for field stars at this location in the disk (assuming circular orbits). Its position in the cluster CMD (Figure 2) is a little bluer than the majority of the cluster members, but is not inconsistent with membership. Its abundance ratios for the α-elements Si, Ti, and Ca are also quite different from those of other NGC 2243 stars, though given the abundance uncertainties, it cannot be ruled out as a cluster member. Regardless, the weighted mean cluster abundances are essentially unaffected by the inclusion of 2619 given its relatively large abundance uncertainties.

Figure 5. Fe abundances for NGC 2204 and NGC 2243 stars with standard deviations as a function of Teff. The weighted cluster mean abundances are indicated by dashed lines, while 1σ values are indicated by dotted lines.
Download figure:
Standard image High-resolution imageNGC 2204 and NGC 2243 have been subject to numerous metallicity determinations in the past, most of which are based on photometry. Differences in metallicity scales make it difficult to interpret abundance differences between studies. For example, using the DDO photometry of NGC 2243 obtained by Norris & Hawarden (1978) results in a range of [Fe/H] = −0.70 to −0.44, depending on the particular calibration used (Norris & Hawarden 1978; Twarog et al. 1997). That said, our values for both NGC 2204 and NGC 2243 agree to within 0.10 dex of the Twarog et al. (1997) values based on DDO photometry for those clusters, and are 0.2–0.3 dex larger than those of other DDO photometry studies (Norris & Hawarden 1978; Dawson 1981; Janes 1979). Our values are also 0.3–0.5 dex larger than the metallicity values for these clusters based on Washington photometry (Hardy 1981; Geisler 1987). Our abundance of [Fe/H] = −0.42 ± 0.05 for NGC 2243 is ∼0.15 dex larger than that found by Anthony-Twarog et al. (2005) based on uvbyCaHβ photometry.
Friel et al. (2002) obtained low-resolution spectroscopy of several stars in both NGC 2204 and NGC 2243. The resulting abundances based on spectroscopic indices, [Fe/H] = −0.32 ± 0.10 (NGC 2204) and −0.49 ± 0.05 (NGC 2243), agree with our values to within 0.10 dex. The only high-resolution spectroscopy study for either cluster is that of Gratton & Contarini (1994) for NGC 2243. This study superceded an earlier study (Gratton 1982), and found [Fe/H] = −0.48 ± 0.15 for the cluster, in excellent agreement with our findings. Comparison of our [X/Fe] ratios also finds good agreement: for O, Na,11 Ca, and Ni, our [X/Fe] ratios agree within <0.10 dex; for Al, Mg, and Ti, the differences in magnitude are consistent with the systematic differences we have identified for these elements in past comparisons of our results to other studies (e.g., Friel et al. 2010). The largest differences exist for Cr and Zr (∼0.2–0.4 dex in magnitude), but abundances of these elements are more uncertain in our analysis.
9. DISCUSSION
The importance of NGC 2204 and NGC 2243 in the OC population has long been recognized (e.g., Dawson 1981). Their relatively old ages (∼2–4 Gyr) and their large (1 kpc) distance below the Galactic mid-plane make them interesting objects to study (see Figure 6). It is worthwhile to examine how the compositions of NGC 2204 and NGC 2243 compare to those of other OCs, especially the more distant OCs in the outer disk as well as those that lie closer to the Galactic mid-plane.
Figure 6. Distribution above and below the Galactic plane of all clusters in the WEBDA database (black crosses), with the positions of open clusters from our previous work (Friel et al. 2005, 2010; Jacobson et al. 2008, 2009; H. R. Jacobson et al. 2011, in preparation) shown as open squares. NGC 2204 and NGC 2243 are indicated by filled squares.
Download figure:
Standard image High-resolution imageTo do this, we combined the abundance results for NGC 2204 and NGC 2243 with those of clusters from our previous studies (Friel et al. 2005, 2010; Jacobson et al. 2008, 2009) as well as those from other studies. As in our earlier papers, we included the results for clusters studied by Yong et al. (2005) and two Italian groups (Bragaglia et al. 2001, 2008; Carretta et al. 2004, 2005, 2007; Sestito et al. 2006, 2007, 2008). We have made detailed comparisons of methods and results of these groups using clusters common to our studies in order to estimate the systematic differences between our results (Jacobson et al. 2009; Friel et al. 2010). However, the combination of all these studies includes only two clusters with Rgc > 15 kpc; in order to compare the results of NGC 2204 and NGC 2243 to outer disk clusters, it would be helpful to expand the cluster sample in that area.
Many clusters beyond Rgc ∼ 14 kpc have been studied by Carraro and collaborators. Their abundance analyses of four such clusters, Be 22, Be 29, Be 66, and Saurer 1 (Carraro et al. 2004; Villanova et al. 2005), made use of our original line list from Friel et al. (2003). To place these clusters on our abundance scale, we redid the analysis using the EW measurements of Carraro et al. and Villanova et al. (Note that the log gf values in our original line list were revised in Jacobson et al. 2008; we used the updated values here.) In general, our spectroscopically determined atmospheric parameters for stars in these clusters agreed well with those of Carraro et al. and Villanova et al. Element abundances also generally agreed well, save for Na; the revised log gf values for the Na i lines in our list resulted in Na abundances ∼0.3 dex lower than those of Carraro et al. and Villanova et al.
Carraro et al. (2007) performed an abundance analysis on stars in five outer disk OCs: Be 25, Be 73, Be 75, Ruprecht 4, and Ruprecht 7. They used the line list of Gratton et al. (2003) in their analysis; fortunately, enough lines in that list are in common with our line list to place these clusters on our abundance scale. To do this, we repeated the abundance analysis using only the EWs published in Carraro et al. (2007) of lines in our line list. The resulting Mg and Ti abundances are very uncertain, given that only one line of each was in our line list. Apart from Al, for which only the 6696/6698 Å doublet is included, abundances of all other elements are based on four or more absorption lines. Carraro et al. (2007) published the EW measurements for only one star in each cluster; therefore, our "cluster" abundances are based on an analysis of a single star in each. As a result, our results for these five clusters are more uncertain than for the four clusters described in the previous paragraph, though our abundances results are in general decent agreement with those of Carraro et al. (2007).
Figure 7 shows the radial metallicity distribution of OCs in the Milky Way disk, as shown by the OCs from all samples described above. The OCs from our previous papers are represented by open squares, while NGC 2204 and NGC 2243 are filled squares. OCs from Bragaglia et al., Carretta et al., and Sestito et al. are given as triangles, while those of Yong et al. are open circles. The clusters from Carraro and collaborators are shown as crosses. The size of the cross is indicative of the reliability of the cluster abundances on our scale: we consider the results for Be 22, Be 29, and Saurer 1 to be robust12 and so large crosses are used; the more uncertain results for clusters in Carraro et al. (2007), and also for Be 66 (which was based on an S/N ∼ 15 spectrum of one star; Villanova et al. 2005) are indicated by smaller crosses. Clusters common to different studies are connected by dotted lines.

Figure 7. [Fe/H] distribution as a function of Galactocentric radius as shown by open clusters. Filled squares denote NGC 2204 and NGC 2243, while open squares are clusters from our previous work (Friel et al. 2005, 2010; Jacobson et al. 2008, 2009). Open circles are clusters studied by Yong et al. (2005), while open triangles are from Bragaglia et al. (2001, 2008), Carretta et al. (2004, 2005, 2007), and Sestito et al. (2006, 2007, 2008). Crosses indicate clusters from Carraro et al. (2004, 2007) and Villanova et al. (2005). The sizes of the crosses indicate the reliability of the measurement on our abundance scale. Clusters common to different studies are connected by dotted lines. Error bars indicate the standard error of the mean, while a representative error bar for individual star abundances (for our sample) is given to the right of the plot. See the text for more information.
Download figure:
Standard image High-resolution imageThe metallicity distribution shown in Figure 7 is reminiscent of that seen in many other studies, including Friel et al. (2010) and Pancino et al. (2010). OCs beyond Rgc ∼ 14 kpc have a much smaller dispersion in [Fe/H] than those of clusters inside that radius, and generally range from −0.30 to −0.50 dex. As can be seen, NGC 2204 has an [Fe/H] value consistent with those of clusters in the same Rgc range, while NGC 2243 is the most metal-poor object at its Galactocentric distance. Its metallicity is comparable to, or even lower than, OCs in the outer disk. This is especially interesting in the context of radial migration of stars in the disk, where stars can jump from one circular orbital radius to another via interactions with transient spiral density waves (e.g., Sellwood & Binney 2002). Although to date radial migration studies are interpreted in the context of individual stars, the particle masses used in simulations are comparable to OC masses (∼104 M☉; Roškar et al. 2008). Therefore, NGC 2243 may be an example of a cluster formed in the outer disk that has found its way to a smaller Galactocentric radius.
Though not shown here, plots of [X/Fe] versus Rgc analogous to Figure 7 show NGC 2204 and NGC 2243 to have [X/Fe] ratios comparable to other OCs at similar Rgc (keeping in mind that abundances for some elements in these clusters are very uncertain). This implies that there is nothing special about NGC 2204 and NGC 2243 despite their great distance from the Galactic mid-plane. Similarly, the outer disk OCs studied to date, which all have |z| > 1 kpc, have similar chemical properties to other OCs. Comparable [X/Fe] ratios indicate a similar chemical evolutionary history, implying that the outer disk evolved in a similar way to or as an extension of the inner disk, and not as a result of merger events (Carraro et al. 2007; but see Carraro & Bensby 2009).
If the outer disk and high-z (|z| > 1 kpc) OCs are normal disk objects, is it possible to identify them as purely thin disk or purely thick disk objects? The OC abundance patterns for some elements (e.g., Na) appear to differ from those of field stars (Friel 2006). Might the high-z OCs in particular trace out different abundance patterns relative to solar neighborhood thin and thick disk field stars? It is worthwhile to compare the element abundance patterns of NGC 2204 and NGC 2243 together with other high-z OCs to those of other disk objects.
To do this, we gathered information about high-z OCs subject to detailed abundance analysis from the literature. Magrini et al. (2009) and Pancino et al. (2010), for example, provide useful compilations of such studies, and we made our selection from their tables. All clusters found with z ≳ 1 kpc are listed in Table 13, along with their Galactic latitude, longitude, and distance information. As a cluster's Rgc and z distance depend upon its distance from the Sun, and therefore can vary depending on which study is adopted, the cluster list in Table 13 should not be taken as exact, but rather a selection based on distances adopted in various high-resolution spectroscopic abundance studies in the literature. It is not surprising that most outer disk OCs studied to date lie far from the Galactic plane (see Figure 6), so many of the outer disk OCs in Figure 7 are included here. References for clusters' distances from the Sun and element abundance information are also listed in Table 13, with Rgc values calculated assuming Rgc,☉ = 8.5 kpc. In the case of Be 22 and Be 29, which have been studied by more than one group, we have adopted the distances of Yong et al. (2005). Here again we used our determined abundances for the OCs from Carraro et al. (2004, 2007) and Villanova et al. (2005).
Table 13. OCs with |z| ≳ 1 kpc from the Galactic Plane
| Cluster | l | b | d | Rgca | z | Reference |
|---|---|---|---|---|---|---|
| (deg) | (deg) | (kpc) | (kpc) | (kpc) | ||
| Be 20 | 203.5 | −17.4 | 8.6 | 16.4 | −2.60 | 4,7 |
| Be 22 | 199.9 | −8.1 | 6.0 | 14.2 | −0.84 | 5,8 |
| Be 25 | 226.6 | −9.7 | 11.4 | 18.2 | −1.90 | 2,8 |
| Be 29 | 198.0 | 8.0 | 14.8 | 22.9 | 2.00 | 4,7,8 |
| Be 73 | 215.3 | −9.4 | 9.8 | 17.4 | −1.60 | 2,8 |
| Be 75 | 234.3 | −11.1 | 9.1 | 15.5 | −1.60 | 2,8 |
| Mel 66 | 260.5 | −14.2 | 4.3 | 10.2 | −1.06 | 4 |
| NGC 1193 | 146.8 | −12.2 | 5.8 | 13.6 | −1.20 | 3 |
| Saurer 1 | 214.7 | 7.4 | 13.2 | 20.6 | 1.70 | 1,8 |
| Tombaugh 2 | 232.8 | −6.9 | 7.3 | 14.2 | −0.88 | 6 |
Notes. aR☉ = 8.5 kpc. References. (1) Carraro et al. 2004; (2) Carraro et al. 2007; (3) Friel et al. 2010; (4) Sestito et al. 2008; (5) Villanova et al. 2005; (6) Villanova et al. 2010; (7) Yong et al. 2005; (8) This study. The distances adopted for clusters Be 20 and Be 29 are from Yong et al. (2005). See the text for more information.
Download table as: ASCIITypeset image
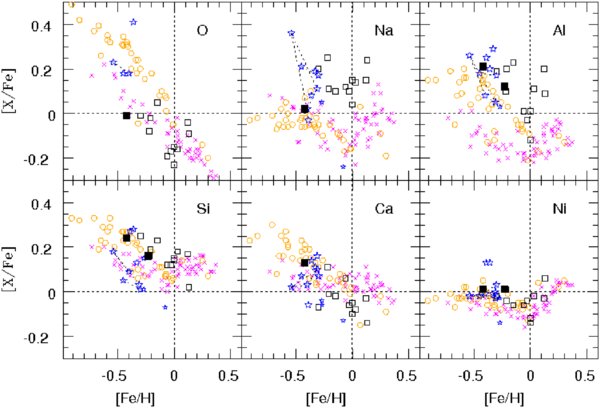
Figure 8 shows the abundance patterns of high-z OCs, OCs closer to the Galactic plane, and (solar neighborhood) thin and thick disk field stars. The thin disk (crosses) and thick disk (open circles) field star samples are taken from Bensby et al. (2003, 2005). NGC 2204 and NGC 2243 are indicated by filled squares, while the OCs of our previous studies (Friel et al. 2005, 2010; Jacobson et al. 2008, 2009) are open squares. Open stars represent the high-z OCs of Table 13, save for NGC 1193 which is represented by an open square. (Note that some OCs represented by crosses in Figure 7 are open stars here.) In cases of OCs studied by more than one group, all available abundances are plotted and connected by dotted lines (e.g., Be 29). We caution the reader that [O/Fe] ratio for high-z OC Saurer 1 ([O/Fe] ∼ 0.4) in Figure 8 was taken directly from Carraro et al. (2004); we did not independently determine an abundance based on their EWs for the near-IR oxygen triplet. Similarly, the [O/Fe] ∼ 0.18 for Be 29 is also from Carraro et al. (2004). The reader should also note that we have omitted error bars for the sake of clarity. The weighted error of the mean [X/Fe] for NGC 2204 and NGC 2243 are ∼0.1 dex; standard deviations of the mean in [X/Fe] for clusters of the other studies included here range 0.1–0.25 dex.
Figure 8. [X/Fe] vs. [Fe/H] for a number of different elements. In each panel, thick disk and thin disk field stars from Bensby et al. (2003, 2005) are shown as open circles and crosses, respectively. Filled squares are NGC 2204 and NGC 2243, while open squares are clusters from our previous work (Friel et al. 2005, 2010; Jacobson et al. 2008, 2009). Lastly, clusters with large z-distances listed in Table 13 are shown as open stars. As in Figure 7, the size of the star indicates the reliability of the measurement on our abundance scale. Clusters common to different studies are connected by dotted lines. See the text for more information.
Download figure:
Standard image High-resolution image
As can be seen in Figure 8, the range in OC [X/Fe] ratios at a given [Fe/H] is generally larger than for the field star samples for most elements considered (nickel excepted). This is at least partly due to systematic effects between our OC sample and those from the literature. That said, our own homogeneous sample alone clearly shows a larger abundance dispersion than the field stars (e.g., O and Al).
Systematic differences among results of different studies can alter element abundance distributions, confusing their interpretation. In an effort to minimize systematic effects for this discussion, we have placed the Bensby et al. (2003, 2005) thin and thick disk star results on our abundance scale in the following manner. High-resolution, high S/N spectra of 18 stars (10 thin disk, 8 thick disk) from the Bensby et al. sample were obtained from the ELODIE archive13 (Moultaka et al. 2004). We measured EWs of lines in our line list in these spectra, and calculated element abundances using our line measurements and the atmospheric parameters of Bensby et al. Differences between our abundances and those reported by Bensby et al. (after correcting for the adoption of different reference solar abundances) were then plotted as a function of stellar [Fe/H] and [X/H] to look for systematic dependences: none were found.
Overall, our [Fe/H] abundance scales were in excellent agreement, with the average difference (in the sense Our − Bensby) being −0.01 ± 0.04 (s.d.) dex. Differences in Si, Ca, and Ni abundances were 0.05 dex or smaller (with standard deviations also 0.05 dex or less). Such good agreement in results, using different spectra and a line list developed specifically for the analysis of evolved stars with gf-values derived relative to Arcturus rather than the Sun, is surprising and encouraging. That said, a systematic difference in abundances was found for Na and Al. Our abundances were 0.11 and 0.19 dex lower than those of Bensby et al. for Na and Al, respectively, for the same stars. The mean systematic offsets found in the analysis of these 18 stars were applied to the entire Bensby et al. thin and thick disk sample, and the results are shown in Figure 8. We did not determine oxygen abundances for any Bensby stars. However, we did correct for the 0.1 dex difference between our studies in the reference solar oxygen abundance.
Although some systematic effects still lurk in Figure 8, the first-order correction performed above allows us to make a couple general observations. First, the [Si/Fe] distribution of the OC population (both inner disk and high-z clusters) appears to be intermediate between the thin and thick disk field stars, with some OCs having abundance ratios consistent with the thick disk, some with the thin disk, and some in between. Second, the larger dispersion of abundance ratios for elements such as Si and Ca shown by OCs is not inconsistent with a possible mixture of OC populations, though the element distributions shown in Figure 8 imply that it is not appropriate to describe such a mixture as being of thin and thick disk objects. It is interesting that the inner disk OCs, including NGC 2204 and NGC 2243, have [Si/Fe] ratios more consistent with the thick disk, while the majority of the high-z OCs tend to have thin disk [Si/Fe] ratios. However, it is probably more correct to interpret the whole OC [Si/Fe] distribution seen here as being independent of [Fe/H].
Third, OCs follow a trend of decreasing [O/Fe] with increasing [Fe/H] similar to that for the thin disk stars. Oxygen abundances have been determined for only four high-z OCs, and three of the four have [O/Fe] bordering both thin and thick disk field star trends at their metallicities. Saurer 1 (Sa 1), with [O/Fe] ∼ 0.4, is more oxygen-enhanced than thick disk stars at its metallicity, though we suspect this is at least in part a systematic effect. The oxygen abundance for this cluster was calculated under the assumption of LTE from the near-IR oxygen triplet (Carraro et al. 2004), a feature known to suffer from NLTE effects (see, e.g., Schuler et al. 2006). NLTE corrections for stars with similar atmospheric parameters to the Sa 1 stars studied are of order 0.2 dex (Takeda et al. 2003), which would make the oxygen abundance of Sa 1 consistent with those of other OCs. Therefore, the enhanced oxygen abundance of this important cluster should be confirmed. For now, Figure 8 indicates that OCs generally follow the thin disk field dwarf [O/Fe] trend with metallicity in the approximate [Fe/H] range of −0.5 to +0.1 dex.
Fourth, the OC Na and Al abundance distributions occupy a locus not populated by field stars in either thin or thick disks. This latter point is well known (e.g., Friel 2006). However, there continues to be much debate about whether or not this is due to systematics, namely the incorrect assumption of LTE in giant stars, especially in the case of Na (see, e.g., Sestito et al. 2008 and Schuler et al. 2009 for recent discussions). All the Na abundances shown in Figure 8 are LTE abundances. Differences in Na abundances between dwarfs and giants in OCs have been identified before, and in some cases possible NLTE effects are not large enough to explain the differences (e.g., Pasquini et al. 2004; Schuler et al. 2009). The systematic offset between OC and field star Na abundances seen here may in fact be a difference between giant and dwarf abundances, as abundances of all OCs considered here have been determined from evolved stars. We note that the range of OC [Na/Fe] ratios falls nicely within the distribution of solar neighborhood red clump star NLTE Na abundances (Mishenina et al. 2006) and suspect that the [Al/Fe] distribution is also consistent. The inner disk OC and the high-z OC [Na/Fe] and [Al/Fe] are generally independent of metallicity (though there may be some hint of decreasing [Al/Fe] with increasing [Fe/H], albeit with large spread); another indication that they likely form one single population rather than two distinct ones.
In general, the OC [Ni/Fe] ratio distribution nicely follows that of the field star samples. It also clearly shows the up-turn in [Ni/Fe] at super-solar metallicities, as has been noted for field dwarfs (Bensby et al. 2003) and field clump stars (Mishenina et al. 2006). The OC [Ca/Fe] trend appears to follow that of the thick disk field stars, with the high-z OCs and inner disk clusters forming a continuous distribution, albeit with rather large scatter.
To summarize, NGC 2204, NGC 2243, and other high-z OCs do not appear to be distinctly different in their abundance patterns from the OCs closer to the Galactic mid-plane, nor is there convincing evidence that they can be associated with the thick disk, or else identified as transition objects between the two disks. That the OC [Ca/Fe] trend with [Fe/H] seems more consistent with the thick disk is intriguing, but the fact that it is not also seen in other α-elements such as O and Si makes it less compelling.
Finally, we close this discussion with a brief comment about the high-z OCs Saurer 1 and Be 29. Carraro & Bensby (2009) have tentatively associated these two OCs with the Sagittarius dwarf galaxy based on their kinematics, [Mg/Fe] and [Ca/Fe] ratios. As shown here in Figures 7 and 8, these clusters appear to have [Fe/H] and [X/Fe] ratios comparable to other OCs, both in the outer disk and in the inner disk, and are not distinctly different from either the thin or thick disk field populations. Furthermore, we would argue that their [Ca/Fe] and [Mg/Fe] ratios are only borderline consistent with those of stars in the Sagittarius dwarf and its tidal tail (see Figure 3 in Carraro & Bensby 2009), so the association of these two clusters with another galaxy must remain hypothetical for now. To confirm these clusters' association with the dwarf galaxy, it is important to perform a follow-up high-resolution spectroscopic analysis of similar-type stars in Be 29, Sa 1, the thin and thick disks, and the Sag dwarf and its stream all together. As recently demonstrated in studies comparing the [X/Fe] ratios of bulge stars to thin and thick disk stars, systematic differences that arise in the combination of different studies can greatly influence interpretation of the results (Alves-Brito et al. 2010). With that in mind, we acknowledge that it would have been more appropriate to compare OC element abundances to those of thin and thick disk giant stars rather than dwarf stars; indeed this was hinted at in the discussion of Na and Al abundances above. We plan to make such a comparison in future work, and therefore one should bear in mind that the general observations made here about the different disk populations may change.
10. SUMMARY
We have presented a detailed abundance study of the old OCs NGC 2204 and NGC 2243 based on Hydra multi-object spectroscopy of 13 and 10 radial velocity members per cluster, respectively. We have found [Fe/H] = −0.23 ± 0.04 and −0.42 ± 0.05 for NGC 2204 and NGC 2243, respectively, in good agreement with previous spectroscopic studies but larger than photometric estimates. Both clusters have [X/Fe] < 0.15 dex for most elements, roughly consistent with scaled solar values. Measurement of the [O i] 6300 Å feature in one star in NGC 2243 shows this metal-poor cluster to have a scaled-solar oxygen abundance.
These two clusters are part of a larger sample of OCs selected to investigate the nature of the transition between the inner and outer Milky Way disk. To that end, we combined the results of the present study with those of clusters from our previous work and from other groups that we have either examined for systematic differences in results or that we have placed on our own abundance scale. NGC 2204 has a metallicity consistent with other clusters at its Galactocentric location, while NGC 2243 is the lowest metallicity cluster at its Rgc. Its metallicity, comparable to that of more distant outer disk clusters, contributes much to the dispersion in [Fe/H] seen in clusters in the transition between the inner and outer disks.
We also compared the abundance results of these two clusters with those of outer disks, high-z clusters taken from the literature, such as those from Carraro et al. (2004, 2007). Comparison of clusters' abundance distribution in the [X/Fe] versus [Fe/H] plane to those of thin and thick disk field stars did not identify any cluster as belonging unambiguously to either the thick disk or the thin disk, but systematic differences between results of different studies, including the comparison of dwarf and giant star abundances, may mask any subtle differences in abundance patterns. A follow-up abundance analysis of NGC 2204 and NGC 2243 using higher resolution, multi-order spectra of many more cluster members would be worthwhile.
We thank the referee for helpful comments that improved this manuscript. H.R.J. is pleased to acknowledge NOAO for financial support to carry out most of these observations as part of her dissertation research. Thanks are also given to H. Tirado for his kind and competent assistance at the telescope. We are very grateful to C. I. Johnson for obtaining observations of NGC 2243 on our behalf and for helpful discussions regarding spectrum synthesis techniques. This research has been supported by a National Science Foundation Graduate Research Fellowship and an Indiana Space Grant Graduate Research Fellowship. H.R.J. also acknowledges support from the National Science Foundation through the NSF Astronomy and Astrophysics Postdoctoral Fellowship under award AST-0901919 during the preparation of this manuscript. C.A.P. gratefully acknowledges the support of the Daniel Kirkwood Research Fund at Indiana University. This study makes use of data products from the Two Micron All Sky Survey, which is a joint project of the University of Massachusetts and the Infrared Processing and Analysis Center/California Institute of Technology, funded by the National Aeronautics and Space Administration and the National Science Foundation. This study also uses the WEBDA database, operated at the Institute for Astronomy at the University of Vienna. Part of this work is based on spectral data retrieved from the ELODIE archive at Observatoire de Haute-Provence (OHP). Lastly, NASA's Astrophysics Data System Bibliographic Services have been very useful in this research.
Footnotes
- 6
- 7
- 8
IRAF is distributed by the National Optical Astronomy Observatory, which is operated by the Association of Universities for Research in Astronomy, Inc., under cooperative agreement with the National Science Foundation.
- 9
- 10
Two Fe ii lines were measurable in the λ6240 spectra of NGC 2243 stars. Given that there were only two, and the spectra were of generally poor S/N, we did not use them to constrain stellar gravities.
- 11
- 12
It is worth stating that the term "robust" can be misleading. In all fairness, few, if any, of the OC abundances used here can really be described as robust, since by and large OC abundances are determined from observations of a handful of stars at most, an unfortunate consequence of the time intensiveness of high-resolution spectroscopic studies. Furthermore, the abundances of many outer disk OCs are determined from spectra of 1–2 stars with S/N ∼ 25–40 (e.g., Carraro et al. 2007). Without meaning to be critical of any OC abundance study which works the best it can with the data it has (including our own), it is important to acknowledge that there are likely no studies that cannot be improved upon.
- 13