


ABSTRACT
We derive carbon, nitrogen, oxygen, and lithium abundances as well as 12C/13C isotopic ratios in two chemically peculiar red giant stars: HD 104340 and HD 206983. The abundances were determined via spectrum synthesis of optical high-resolution spectra containing C2, CH, CN, [O i], and Li i lines. Our results indicate that HD 206983 is a barium star, while HD 104340, although showing enhancements of s-process elements, should not be considered as a classical barium star: its barium star nature can be explained by internal nucleosynthesis. The low metallicity giant HD 104340 can experience deeper convective mixing and, consequently, a larger dredge-up of CNO-cycle products compared to normal red giants. The light element abundance pattern of HD 104340 resembles anomalies resulting from the appearance on the stellar surface of material enriched by triple-α and CNO cycling.
Export citation and abstract BibTeX RIS
1. INTRODUCTION
The abundance determination of light elements is very important for stellar astrophysics as these elements are strongly affected by nuclear burning in the inner regions of the stars, such as the CNO cycle. When the convection in the stellar envelope penetrates inward during the evolution along the giant branch, the stellar material which has been processed in the interior is mixed to the surface. Therefore, the CNO and Li abundances and 12C/13C isotopic ratios are essential for understanding not only convection, but also to set observational constraints on the nucleosynthesis history of the stars and the current theory of stellar evolution.
Barium-enriched stars represent a class of chemically peculiar stars that show enhancements of carbon and heavy elements produced by s-process nucleosynthesis. The discovery of binarity in barium giants is important to understand their nature (McClure et al. 1980). Mass transfer from a companion—He-burning AGB (asymptotic giant branch) star, which is now an optically invisible white dwarf, was proposed to explain observed chemical peculiarities in barium stars. Light element abundances in barium giants have already been studied by several authors (Sneden et al. 1981; Smith 1984; Barbuy et al. 1992; Allen & Barbuy 2006; Gopka et al. 2006).
In this work, we derive light element abundances for two metal-poor red giant stars: HD 104340 (V = 8.17) and HD 206983 (V = 9.45). Both stars were suspected to be barium stars by Luck & Bond (1991) and Catchpole et al. (1977), respectively. Our observations and the determination of stellar parameters are briefly described in Section 2, and the derivations of abundances are given in Section 3. In Section 4, we discuss the results for each star comparing with other related objects. Finally, we present our conclusions in Section 5.
2. OBSERVATIONS AND STELLAR PARAMETERS
The high-resolution spectra of stars analyzed in this work were obtained at the 1.52 m ESO telescope of La Silla, Chile, on 1999 June 24 (HD 104340) and on 2000 August 11 (HD 206983) with the FEROS (Fiberfed Extended Range Optical Spectrograph) echelle spectrograph (Kaufer et al. 1999). The FEROS spectral resolving power is R = 48, 000 corresponding to 2.2 pixels each with a pixel size of 15 μm and the wavelength coverage is from 3900 Å to 9200 Å. The nominal S/N of the observed spectra was evaluated by the measurement of the rms flux fluctuation in selected continuum windows, and a typical value was S/N = 120–200, for the observations between 3600 and 4500 s of integration time. The reduction of the spectra was done with the Monitoring, Intrusion Detection, Administration System (MIDAS) reduction package and consisted of the following standard steps: CCD bias correction, flat-fielding, order extraction, wavelength calibration, correction of barycentric velocity, as well as spectrum rectification and normalization.
The stellar parameters adopted for the target stars were obtained in Junqueira & Pereira (2001), hereafter JP2001. Table 1 shows the adopted stellar parameters.
Table 1. Atmospheric and Physical Parameters of HD 104340 and HD 206983
| Star | Teff (K) | log g (dex) | [Fe/H] | ξ (km s−1) |
|---|---|---|---|---|
| HD 104340 | 4 350 ± 100 | 1.2 ± 0.4 | −1.72 ± 0.09 | 2.4 ± 0.2 |
| HD 206983 | 4 200 ± 100 | 1.4 ± 0.4 | −1.43 ± 0.10 | 2.7 ± 0.3 |
Download table as: ASCIITypeset image
3. DETERMINATION OF Li, C, N, and O ABUNDANCES AND 12C/13C ISOTOPIC RATIO
CNO and Li abundances and 12C/13C isotopic ratios were determined using the LTE model atmospheres by Kurucz (1993). The last version (2002 April) of the spectral synthesis code moog (Sneden 1973) was used to compute synthetic spectra.
The lists of atomic lines in all spectral regions were taken from the VALD database (Piskunov et al. 1995; Kupka et al. 1999). The lines of the s-process elements were added from the D.R.E.A.M. database (Database on Rare-Earths at Mons University) (Biemont et al. 1999).
Since the abundances of CNO elements are interdependent because of the association of carbon and oxygen into CO molecules in the atmospheres of cool giants, we carried out iterative procedures in the CNO abundance determinations until all abundances of these three elements reached an equilibrium.
3.1. Carbon
The carbon abundances were derived using different spectral regions.
(a) C2 (0, 1) band head of the Swan system A3Πg–X3Πu at 5635 Å. The electron oscillator strength, fel = 0.033, was taken from Lambert (1978). The Hönl–London factors for the rotational lines were calculated using a formula from Kovacs (1969). Franck–Condon factors were calculated according to Dwivedi et al. (1978). However, as was shown by our calculations, the (0, 1) band of the Swan system does not present significant dependence of Franck–Condon factors from the value of J. Thus the value q0,1 = 0.2206 was adopted for all rotational lines of the (0, 1) band. The small contribution of faint CN (5, 0) and (10, 4) bands of the CN red system was taken into account. A C2 dissociation energy of D0(C2) = 6.15 eV was adopted (Huber & Herzberg 1979). The wavelengths of the C2 features of the (0, 1) band were taken from Phillips & Davis (1968).
(b) C2 feature at 5086 Å. The oscillator strengths and wavelengths of C2 lines were taken from Lambert & Ries (1981).
(c) CH lines of the A2Δ–X2Π system. The oscillator strengths and wavelengths of the 12CH and 13CH lines were taken from the SCAN database (Jørgensen et al. 1996). The CH dissociation energy is well determined and is equal to D0(CH) = 3.45 eV (Lambert 1978).
Figure 1 shows the observed and synthetic spectra of both stars of our sample in the region around 5635 Å.

Figure 1. Observed (dotted line) and synthetic (solid lines) spectra in the region around the C2 molecule lines at 5635 Å for the stars HD 104340 (a) and HD 206983 (b). Note the strength of the C2 lines in HD 206983 compared to HD 104340. In the synthetic spectra of HD 104340, we show the syntheses for carbon abundances of log ε(C) = 7.16, 7.26, and 7.36 and for HD 206983, for carbon abundances of log ε(C) = 8.01, 8.06, and 8.11.
Download figure:
Standard image High-resolution image3.2. Nitrogen
The nitrogen abundances were obtained by comparing the observed and theoretical line profiles for the 12CN lines of the (2, 0) band of the CN red system A2Π–X2Σ in the 7994–8020 Å wavelength range. The oscillator strength of the (0, 2) band f2, 0 = 8.4 × 10⁻⁴ (Sneden & Lambert 1982) was used. Hönl–London factors were calculated using Schadee (1964) formula. The dissociation energy D0(CN) = 7.65 eV (Sneden & Lambert 1982; Bauschlicher et al. 1988) was used. The wavelengths of the 12CN lines were taken from Davis & Phillips (1963) and those of 13CN lines from Wyller (1966). Contamination of the CN features by the telluric H2 O lines was eliminated by dividing our spectra by the rapidly rotating hot star spectrum.
Figures 2 and 3 show the observed and synthetic spectra of HD 104340 and HD 206983 in the regions 8002–8005 Å and 8007–8013 Å.
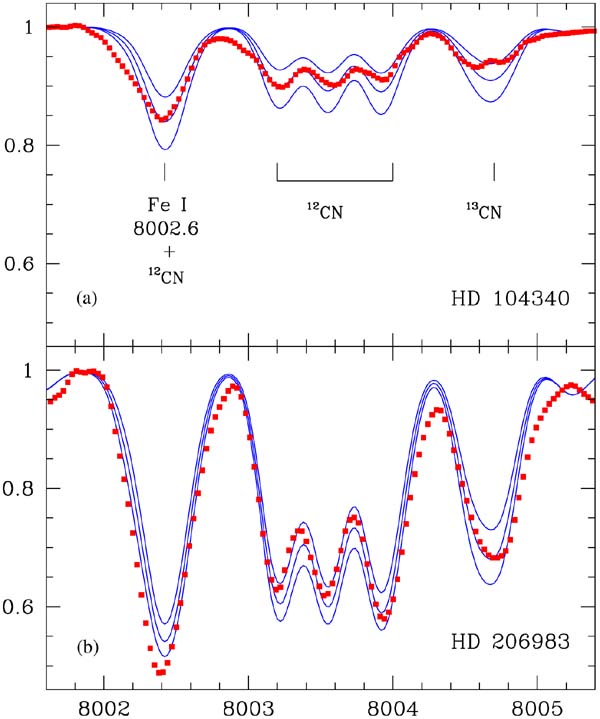
Figure 2. Observed (dotted line) and synthetic (solid lines) spectra between 8002 Å and 8005 Å for the stars HD 104340 (a) and HD 206983 (b). Note the strength of the CN lines in the spectrum of HD 206983 compared to HD 104340. In HD 104340, from top to bottom, we show the syntheses for the nitrogen abundances of log ε(N) = 7.05, 7.25, and 7.45 while for HD 206983 the nitrogen abundances are log ε(N) = 7.55, 7.75, and 7.95.
Download figure:
Standard image High-resolution image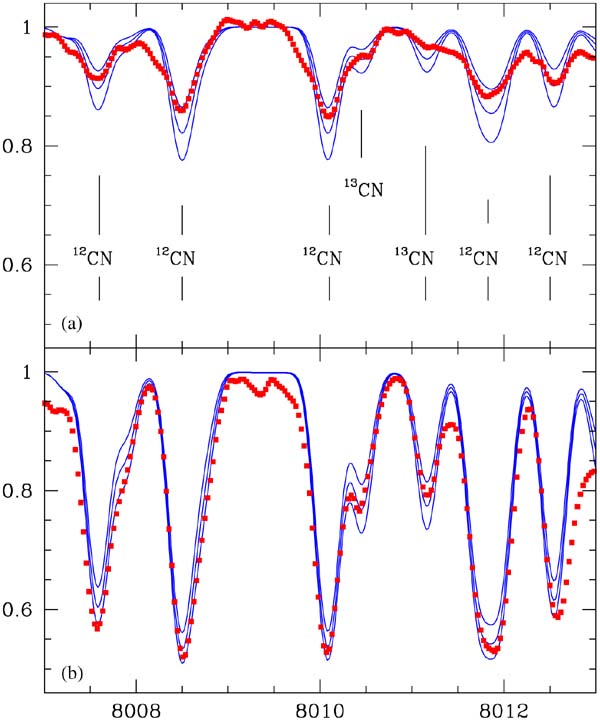
Figure 3. Same as in Figure 2 but for the region between 8007 Å and 8013 Å. Again note the strength of the CN lines in the spectrum of HD 206983 compared to HD 104340.
Download figure:
Standard image High-resolution image3.3. Oxygen
For the determination of the oxygen abundances, we used the [O i] forbidden line at 6300.304 Å. In our calculations, we used for this line the transition probability log gf = −9.717 obtained by Allende Prieto et al. (2001) in their analysis of solar oxygen abundance. This value is only slightly higher than the value of log gf = −9.75 suggested by Lambert (1978). The [O i] 6300.304 Å line is blended with the Ni i line at 6300.339 Å which makes only a small contribution to the oxygen line. The oscillator strength of the Ni i line, log gf = −2.31, was taken from Allende Prieto et al. (2001). Blending of the [O i] line with the weak rotational line of the CN (10, 5) band from the red system at 6300.265 Å was taken into account. Contamination of the [O i] 6300 Å line by the telluric O2 molecular lines was eliminated by dividing the spectra of the studied stars by the rapidly rotating hot star spectrum.
3.4. 12C/13C
The 12C/13C isotopic ratios were derived using the features of 12CN and 13CN molecules in the 7994–8020 Å spectral region. Figure 4 shows the observed and synthetic spectra of HD 104340 and HD 206983 in the 8006–8013 Å region.
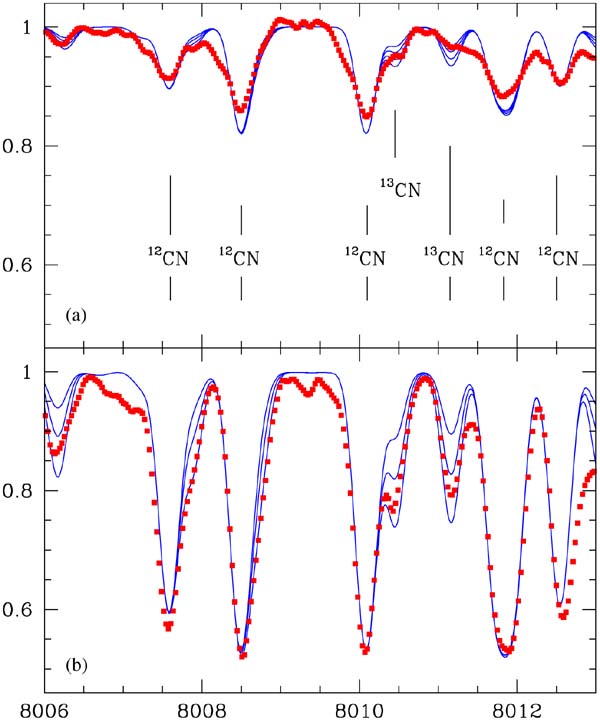
Figure 4. Determination of the 12C/13C isotope ratio. Observed (dotted line) and synthetic (solid lines) spectra between 8006 Å and 8013 Å for the stars HD 104340 (a) and HD 206983 (b) are shown. For HD 104340 from top to bottom, we show the syntheses with the 12C/13C isotope ratios of 8, 6, 4.5, and 3.6 while for HD 206983 the isotope ratios are 32, 16, and 8.
Download figure:
Standard image High-resolution image3.5. Lithium
Lithium abundances were derived from the synthetic spectra matches to the Li i 6708 Å resonance doublet. Special attention was paid to the identification of the s-process element lines in the vicinity of the lithium line. Using the databases VALD and D.R.E.A.M. we created a line list as complete as possible. For the lines appearing in both databases, the VALD oscillator strength values of the lines of s-process elements were replaced by those from the D.R.E.A.M. database. The Ce and Nd abundances determined by JP2001 were used in the synthetic spectra calculations. The CN lines in the vicinity of the Li i doublet were included in the line list. The wavelengths and oscillator strengths for the individual hyperfine and isotopic components of the lithium lines were taken from Smith et al. (1998) and Hobbs et al. (1999). A solar 6Li/7Li isotopic ratio (6Li/7Li = 0.081) was adopted in synthetic spectrum calculations.
Determined CNO and Li abundances and carbon isotopic ratios are shown in Table 2. For carbon, we present abundances obtained using three different spectral regions (specified in parentheses). The mean values of carbon abundances of HD 104340 and HD 206983 and the 12C/13C isotopic ratio of HD 104340 are shown in italic.
Table 2. CNO and Li Abundances and 12C/13C Isotopic Ratio for Our Sample Stars
| Star | log ε(Li) | log ε(C) | log ε(N) | log ε(O) | 12C/13C | [C/Fe] | [N/Fe] | [O/Fe] |
|---|---|---|---|---|---|---|---|---|
| HD 104340 | ≤−0.7 | 7.31(5086) | 7.17 | 8.03 | 4.5(8000) | +0.37 | +0.84 | +0.82 |
| 4350/1.2 | 7.26(5635) | 4.5(4360) | ||||||
| 7.06(4360) | ||||||||
| 7.21 | 4.5 | |||||||
| HD 206983 | −1.2 | 8.06(5086) | 7.74 | 8.15 | 9(8000) | +0.84 | +1.41 | +0.65 |
| 4200/1.4 | 8.03(5635) | |||||||
| 7.81(4360) | ||||||||
| 7.97 | ||||||||
| Sun | 1.1 | 8.56 | 8.05 | 8.93 | 89 |
Download table as: ASCIITypeset image
4. DISCUSSION
With the abundances and the isotopic ratio in hand, we may now discuss the evolutionary status of the chemically peculiar stars analyzed in this work. Our final values of the CNO and Li abundances and 12C/13C isotopic ratios are shown in Table 2 where we used the usual spectroscopic definition: [X/H] = log ε(X)* − log ε(X)⊙, and log ε(X) = log(NX/NH) + 12.0.
Table 2 shows that the carbon abundance determined from the CH band is lower than that determined from the other molecular bands for both stars. In fact, the small difference in the obtained carbon abundances for studied stars may be caused by the so-called Bond–Neff depression, a broad absorption feature present in the spectra of barium stars near 4000 Å and extending from about 3500 to 4500 Å (Bond & Neff 1969; Lu & Sawyer 1979). This difference in the carbon abundances of barium-enriched stars derived from CH lines in the 4200 Å region and from the longer wavelength C2 lines has already been pointed out in various studies (see, e.g., Sneden 1983).
We estimated the influence of model errors, such as uncertainties in the effective temperatures and surface gravities, on the derived CNO abundances. Moreover, as we have mentioned above, abundances of the CNO elements are interdependent, so uncertainties in the oxygen abundance determination affect the carbon abundance and vice versa. Uncertainties in the carbon abundance result in variation of nitrogen abundances, since the CN molecule lines are used for the N abundance determination. The variations of the abundance due to changes in effective temperature (±100 K), surface gravity (±0.4 dex), C, N, and O abundances are summarized in Table 3 for HD 104340. In the last column, we present the resulting abundance uncertainties, σtot, calculated as the square root of the squares of the various sources of uncertainties. Derived CNO and Li abundances are weakly sensitive to the variations of the microturbulent velocity since weak lines were used for their determination. Corresponding abundance variations for the other giant, HD 206983, have similar values. The other source of uncertainty in the molecular line analysis is the uncertainty in the molecule constants, mainly the dissociation energy of the CN molecule which is not yet well known (Lambert 1994). Our tests showed that variations of the CN molecule dissociation energy of ΔD0(CN) = +0.10 eV resulted in variations of nitrogen abundance Δlog ε(N) = −0.18. Calculations of the carbon isotopic ratios do not depend on the uncertainties in the C and N abundances and molecular parameters. The errors in the 12C/13C determinations are mainly due to uncertainties in the observed spectra, such as eventual contamination by unidentified atomic or molecular lines, or inappropriate consideration of telluric lines. Uncertainty in the carbon isotope ratio depends on its value, for HD 104340, having very low 12C/13C ratio; the uncertainty in the carbon isotope ratio is ±0.4, and for HD 206983 this value is ±1.
Table 3. Influence of Errors on the CNO Abundances Derived for HD 104340
| Element abundance | Δ Teff −100 K | Δ Teff +100 K | Δ log g −0.4 | Δ log g +0.4 | Δ log ε(C) +0.1 | Δ log ε(C) −0.1 | Δ log ε(O) +0.1 | Δ log ε(O) −0.1 | σtot |
|---|---|---|---|---|---|---|---|---|---|
| log ε(C) | +0.03 | −0.02 | −0.05 | +0.09 | ... | ... | +0.05 | −0.05 | ±0.09 |
| log ε(N) | −0.02 | +0.04 | −0.14 | +0.18 | −0.12 | +0.12 | +0.10 | −0.10 | ±0.22 |
| log ε(O) | −0.05 | +0.03 | −0.12 | +0.13 | +0.01 | −0.01 | ... | ... | ±0.13 |
Download table as: ASCIITypeset image
4.1. HD 104340: a Metal-Poor Star at the First Thermal Pulse
4.1.1. CNO Abundances
In Figure 5, we show the log O/N ratio versus the log C/N ratio for several classes of objects for which CNO abundances have already been calculated. We divided these objects into two main groups: in the upper panel, we include stars which follow the sequence M–MS–S–SC–C which is thought to be one of increasing the carbon-to-oxygen ratio with the transition from C/O < 1 to C/O > 1, that is, those stars which can be referred to as "intrinsic" stars. In the figure, we also include some post-AGB stars, those that are not enriched and those that are enriched in the elements which are synthesized via neutron capture in the s-process (van Winckel & Reyniers 2000; van Winckel 1997; Reyniers & van Winckel 2001; Pereira et al. 2004). The GK giants from Lambert & Ries (1981) are also shown. In the lower panel, we show the stars belonging to the barium star group, that is those which present an excess of s-process elements due to mass transfer from the companion which is now a white dwarf. These stars can be referred to as "extrinsic" stars (extrinsic AGBs). To this class belong classical barium stars (barium giants), subgiant CH stars and CH stars, MS/S stars with no Tc and symbiotic stars.
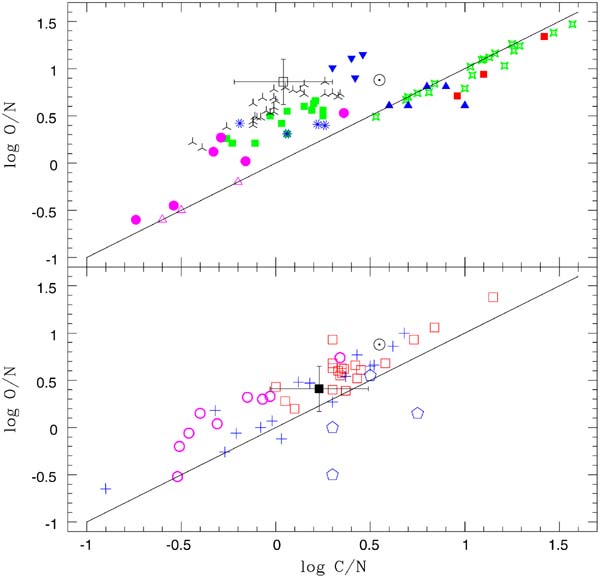
Figure 5. Relative abundance O/N versus C/N. Upper panel: M giants (green filled squares), MS giants (blue asterisks), S stars with Tc (magenta filled circles), SC stars (magenta open triangles), disk carbon stars (green starry points), GK giants (inverted "Y"), post-AGB stars not enriched in the s-process elements (blue upside-down filled triangles), post-AGB stars enriched in the s-process elements (blue filled triangles), and halo carbon stars (red square points). Lower panel: barium giants (red open squares), CH stars (blue open polygons), subgiant CH stars and HD 50264 and HD 87080 (blue plus sign), and S stars without Tc (magenta open circles); the stars analyzed in this work HD 104340 (open black square) and HD 206983 (filled black square). Abundance data for barium giant and dwarf stars are from Smith (1984), Barbuy et al. (1992), Allen & Barbuy (2006), Drake & Pereira (2006), and Sneden et al. (1981); CH stars from Vanture (1992b); M, MS, and S giants from Smith & Lambert (1985, 1986b, 1990); SC stars from Dominy & Wallerstein (1986); disk carbon stars from Lambert et al. (1986); and halo carbon stars from Kipper et al. (1996).
Download figure:
Standard image High-resolution imageThe upper panel of Figure 5 shows that there are two main regions in the log O/N–log C/N plane: the Sun and the G, K (inverted "Y"), M (green filled squares), and MS giants (blue asterisks) are in the upper left part of the diagram relative to the C/O = 1 line. In the other region, on the right side of this line, there are the disk carbon stars (green starry points) as well as some post-AGB stars that display the emission feature at the 21 μm (blue filled triangles). These stars show enhancement of carbon due to the He burning. S stars with Tc (magenta filled circles), S stars without Tc (magenta open circles), and SC stars (magenta open triangles) occupy the lower left part of such diagram due to an enhancement of nitrogen at the expense of carbon and oxygen.
The position of HD 104340 (open black square) in the upper panel compared to HD 206983 (filled black square), in the lower panel in this diagram, indicates that they are not members of the same class, since they have very different carbon and nitrogen abundances. HD 104340 was previously classified as a metal-deficient barium star by Luck & Bond (1991) and was also analyzed by JP2001. In these two studies, the authors were able to show that HD 104340 is enriched (although slightly) in the elements created by slow neutron capture nucleosynthesis, thus prompting its classification as a "barium star." However, Jorissen et al. (2005) showed that HD 104340 is located above the TP-AGB threshold, and measurements of its radial velocity with CORAVEL did not show any indication of orbital motion. Because of this, Jorissen et al. (2005) concluded that HD 104340 should not be recognized as a classical barium star; its barium syndrome is explained by internal nucleosynthesis. Figure 5 shows that HD 104340 has similar C/N ratio to those of the GK and M giant stars. In fact, HD 104340, GK giants, and M giants have C/N ratios, respectively of 1.1 ± 0.25, 1.1 ± 0.13, and 1.1 ± 0.18.
Figures 6, 7, 12, and 13 provide further evidence that HD 104340 and HD 206983 are in fact stars of different classes. Figures 6 and 7 show the abundance ratio [s/Fe] and [C/Fe], respectively, plotted as a function of the metallicity given by [Fe/H] only for the intrinsic stars, as defined in the beginning of this section, and HD 104340. As "s" we adopted the mean abundance of the six elements Y, Zr, Ba, La, Ce, and Nd. This definition varies from author to author and in some cases depends on the quality and/or on the wavelength range of the available spectra. In Figure 6, for the metal-poor AGB star CS 30322-023 (Masseron et al. 2006a), we used Sr and Pb to compute the [s/Fe]. For CEMP stars, we used the recent results of Aoki et al. (2007) in which [s/Fe] means [Ba/Fe]. In Figure 6, we plot the CEMP stars regardless their subtype (CEMP-s, CEMP-r/s etc.). For carbon stars, we used the mean of Rb, Sr, Y, and Zr (Abia et al. 2001). For SC stars, we used the results from Abia & Wallerstein (1998). For the field stars, with [Fe/H] ⩾−2.0, we used the results of Gratton & Sneden (1994) which used the same elements, (Sr, Y, and Ba) by François et al. (2003) while for even lower metallicities there is a larger scatter and we used the results obtained by Ryan et al. (1996) and François et al. (2003).

Figure 6. Diagram of [s/Fe] versus [Fe/H] for several classes of stars where the symbols have the same meaning as in the upper panel of Figure 5, with exception for the metal-poor TP-AGB star recently analyzed by Masseron et al. (2006a), red asterisk, and the CEMP stars (Aoki et al. 2007), black filled circles. The solid line is the mean 〈[s/Fe]〉 for field stars (Gratton & Sneden 1994; Ryan et al. 1996; François et al. 2003).
Download figure:
Standard image High-resolution image
Figure 7. Diagram of [C/Fe] versus [Fe/H]. Symbols have the same meaning as in Figure 6. The solid line is the mean 〈[C/Fe]〉 for field stars taken from Masseron et al. (2006a).
Download figure:
Standard image High-resolution imageWe note that Table 2 shows that the carbon abundance in HD 104340 is compatible with the trend due to the chemical evolution of the Galaxy, as seen in Figure 7. Its oxygen abundance is slightly above the trend seen for halo stars of such metallicity. The mean [O/Fe] for a star with a metallicity in the range of −1.0 to −2.0 varies from ∼+0.3 to ∼+0.7 (Masseron et al. 2006a). The C/O ratio is only 0.15 as is shown in Figure 9.
As far as nitrogen is concerned, the [N/Fe] ratio in HD 104340 shows evidence that a significant mixing of CN-cycled material has occurred which polluted its atmosphere. In addition, mixing seems to be efficient in HD 104340 as can be seen from its [N/Fe] ratio of +0.84. In fact, in metal-poor stars higher values for the [N/Fe] ratio have already been reported in the literature (Carretta et al. 2000; Spite et al. 2005) which is taken as evidence that mixing is more efficient.
The CN cycle modifies the initial composition of the stellar material making more 14N (and more 13C relative to 12C) at the expense of carbon, thus leaving constant the C + N abundance. At the ON cycle, the nitrogen abundance increases and the oxygen abundance decreases, and the O + N abundance is also constant. As a result of both cycles, the sum of C, N, and O abundances remains unchanged. During the helium burning, the carbon and the oxygen abundances are enhanced due to the triple-α and 12C(α, γ)16O reactions. So, in order to check whether the helium-burning products are brought to the surface in HD 104340, we should seek whether we observe an excess of C+N abundance.
The C+N excess is the difference between the total C+N abundance and the expected initial value. In unevolved objects, the nitrogen abundance scales with the iron abundance and for metallicities between +0.3 and −2.0, the abundance ratio is [N/Fe] = 0.0 (Wheeler et al. 1989). For carbon we took the trend [C/H] versus [Fe/H] seen in Figure 11 from Masseron et al. (2006a). In Figure 8, we plot total C+N abundance for HD 104340 and HD 206983 versus metallicity, where the solid line represents the expected initial abundance. In Figure 8, we can see that the CN excess in HD 104340 is ∼0.5 dex which can be taken as evidence of the third dredge-up. In a previous study, JP2001 showed that abundances of the s-process elements in HD 104340 are only mildly enhanced (see also Figure 6). Taking together these two facts, we may conclude that HD 104340 is a star at the first thermal pulse. As we shall see later, its luminosity (Section 4.1.3) puts another constraint on evolutionary status.
Figure 8. Observed Σ(C+N) abundance for HD 104340 (open square) and HD 206983 (filled square) plotted versus [Fe/H]. The solid line shows initial Σ(C+N) abundance (see text).
Download figure:
Standard image High-resolution image4.1.2. 12C/13C Ratio
Another peculiarity in the abundance of HD 104340 is the low 12C/13C ratio, 4.5 (Table 2), as compared with the giant stars, 20–30 (Iben & Renzini 1983). Although giant stars, while they are in the giant branch, may reach bolometric magnitudes around −3.95, depending on the metallicity (Salaris & Cassisi 1997), HD 104340 having Mbol = −2.6 should not be considered as a star in the first giant branch. Giant stars are neither carbon nor s-process-element enriched. Their mean [C/Fe] ratio for solar metallicity stars is −0.19 ± 0.15 (Lambert & Ries 1981).
Figure 9 shows the 12C/16O versus 12C/13C, for the stars analyzed in this work together with other classes of stars: GK giants, M, MS, SC giants, S giants (with and without Tc), carbon stars, barium giants, CH stars, and subgiant CH stars. Figure 9 also shows two straight lines whose values were taken from Smith & Lambert (1990). These two lines represent the addition of 12C material on the atmosphere of a star, in a region of the diagram of Figure 9, one starting at (12C/13C, 12C/16O) = (10, 0.4) and the other at (12C/13C, 12C/16O) = (20, 0.3). According to Smith & Lambert (1990), an increase in 12C by 2.5 times is necessary to change an M-type star to C-type star, as expected by the third dredge-up. Then, these two straight lines represent the limits given by the distribution of M stars where an addition of 12C in their atmospheres would change them from M-stars to C-stars (Smith & Lambert 1990).
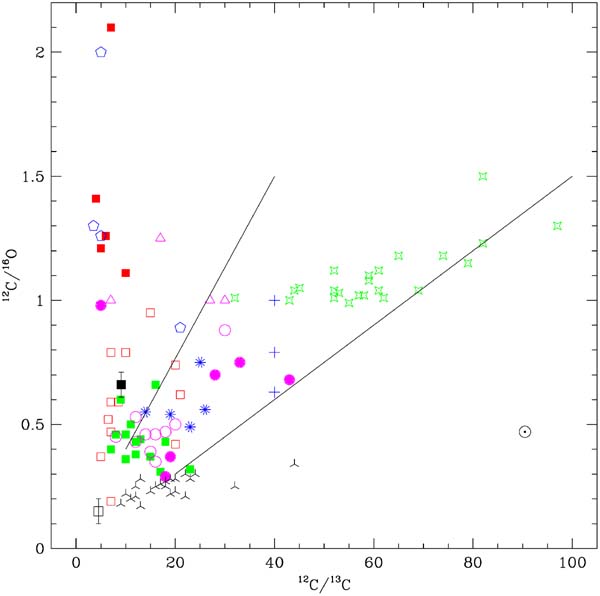
Figure 9. 12C/16O versus 12C/13C ratios for several classes of stars and the stars analyzed in this work. Symbols have the same meaning as in Figure 5. The solid lines represent the addition of pure 12C to 12C/16O and 12C/13C ratios which are found at the bottom of the GKM giants' location.
Download figure:
Standard image High-resolution imageIn this figure, we may possibly distinguish three main regions according to the 12C/16O ratio: 12C/16O ⩾ 1.0, 0.5 ⩽ 12C/16O ⩽ 1.0, and 12C/16O ⩽ 0.5. Those that have 12C/16O ⩾ 1.0 are the stars that have already suffered the effects of the third dregde-up (disk carbon stars and SC stars), or have been highly contaminated in the past by the mass-transfer phenomenon (CH stars). In another group of 0.5 ⩽ 12C/16O ⩽1.0, we find the MS giants, S stars (Tc yes), subgiant CH stars, and barium giants. Finally, those that have 12C/16O ⩽0.5 are GK giants, M giants, S stars (Tc no) and also some barium giants. These giants occupy the lower-left region of this diagram with 12C/16O ≈0.2–0.5 and 12C/13C ≈5–20.
Among several possible mixing and burning mechanisms to explain the low 12C/13C ratios and large nitrogen overabundances, we may highlight two of them: cool bottom processing (CBP) (Wasserburg et al. 1995; Boothroyd & Sackmann 1999) and hot bottom burning (Sackmann & Boothroyd 1992). Some other mixing processes are discussed in Masseron et al. (2006a). Since CBP also predicts lithium overabundance, we may rule out this process since we do not see any lithium enrichment in HD 104340. Hot bottom burning should also be ruled out since it is thought to occur only in the most massive AGB stars (between ≃4 M☉ and ≃7 M☉), and it also predicts lithium overabundance. In addition, the low metallicity and kinematics of HD 104340 suggest an old and hence lower mass nature. The low 12C/13C indicates that the reaction 12C(p, γ)13N(β+, ν)13C is taking place after carbon was enhanced by the triple-α reaction (Clayton 1968).
4.1.3. Lithium
For HD 104340, we determined the upper limit of Li abundance to be −0.7. In the thorough study of Li abundance in G–K giant stars, Brown et al. (1989) showed that the mean Li abundance for stars with Teff < 4500 K is log ε(Li) ≈ −0.4. They also noted the paucity of cool giants with Li abundance according to the standard theory. The low lithium abundance found for HD 104340 as well as high nitrogen-to-iron ratio ([N/Fe] = +0.84) imply a signature of severe mixing, which is confirmed by the low carbon isotope ratio (12C/13C = 4.5).
4.1.4. Photometric Variability and Line Profiles
The spectrum of HD 104340 shows signs of activity in the profiles of Hα and H&K Ca ii lines. In addition, the spectrum shows asymmetric profiles of absorption lines typical of a pulsating star. Spectral monitoring is needed to clarify the pulsation motion of the photosphere of this star. Figure 10 shows the spectrum of HD 104340 in the region around Hα and K Ca ii lines. These profiles suggest the presence of a stellar wind and give support in favor of the evolved nature of HD 104340. It is interesting to note that the same kind of Hα profile is seen in a metal-poor TP-AGB star CS 30322-023 (Figure 6 of Masseron et al. 2006a).
Figure 10. Hα and Ca ii K lines in the spectrum of HD 104340. Note the emission in the blue wing of the Hα profile and the central emission in the calcium line. The spectrum is not corrected for the radial velocity of the star.
Download figure:
Standard image High-resolution imageAnother observational evidence in favor of an advanced evolutionary stage of HD 104340 comes from its optical variability. As we have already mentioned above, HD 104340 has a photometric period of ≈95 days (Koen & Eyer 2002). Combining this information with the observed radial velocity variation given in Jorissen et al. (2005), we are able to show that a sine-wave curve with a period of about 99 days nicely fits the radial-velocity data. Figure 11 shows the radial velocity variation versus photometric phase. The poor fit in some data points may be caused by a semi-regular character of pulsation. In fact HD 104340 is classified in the SIMBAD database as a semi-regular pulsating star.

Figure 11. The variation of radial velocity as a function of photometric phase. A sine-wave curve with a period of 99 days is fitted to the radial-velocity variations measured by Jorissen et al. (2005).
Download figure:
Standard image High-resolution image4.1.5. Luminosity
Would it be possible to consider HD 104340 as a star in the TP-AGB phase? According to Vassiliadis & Wood (1993), a star in the AGB phase should exhibit two essential features: mass-loss and thermal pulses. In the previous section, we provided observational evidence of a stellar wind (asymmetric Hα line profile and central emission in H&K Ca ii lines) and photometric variations. Given its abundance, modest carbon and s-process overabundances, as well as its luminosity, it is probable that HD 104340 finds itself in a evolutionary status that is better classified as a star developing the first thermal pulse at the AGB. In fact, theoretical calculations show that at the first thermal pulse a star should present a luminosity of log L/L☉ = 3.2 (Mbol = −3.4, Lattanzio 1986), log L/L☉ = 3.1 (Mbol = −3.1, Vassiliadis & Wood 1993). Adopting the bolometric correction of −0.6 for metal-poor stars (Alonso et al. 1999) and with our derived absolute visual magnitude of −2.0, the final absolute bolometric magnitude is −2.6, which corresponds to log L/L☉ = 2.94, which is close to the theoretical value. In the above calculations, we have assumed  (Bessel et al. 1998).
4.2. HD 206983: a Metal-Poor Barium Star?
4.2.1. CNO Abundances
The lower panel of Figure 5 gives support for the classification of HD 206983 as a barium star. Its position shares similar C/N and O/N ratios of the classical barium stars. In fact, the mean C/N ratio for the barium giants is 2.0 ± 0.2 while for HD 206983 this value is 1.7 ± 0.3. In addition, the position of HD 206983 in Figures 12 and 13 shows that its mean heavy-element abundance as well as its carbon abundance is higher than the corresponding values for field stars of such metallicity which gives further support for its classification as a barium giant star, since its luminosity is too low for TP-AGB star (JP2001; Jorissen et al. 2005).

Figure 12. Diagram of [s/Fe] versus [Fe/H] for several classes of stars where the symbols have the same meaning as in the lower panel of Figure 5. The two peculiar stars HD 196944 and BD+75 348 are respectively represented by the green filled circle and red filled diamond. Yellow-symbiotic stars are represented by green filled diamonds and CEMP stars by red filled circles. The solid line is the mean 〈[s/Fe]〉 for field stars (Gratton & Sneden 1994; Ryan et al. 1996; François et al. 2003).
Download figure:
Standard image High-resolution image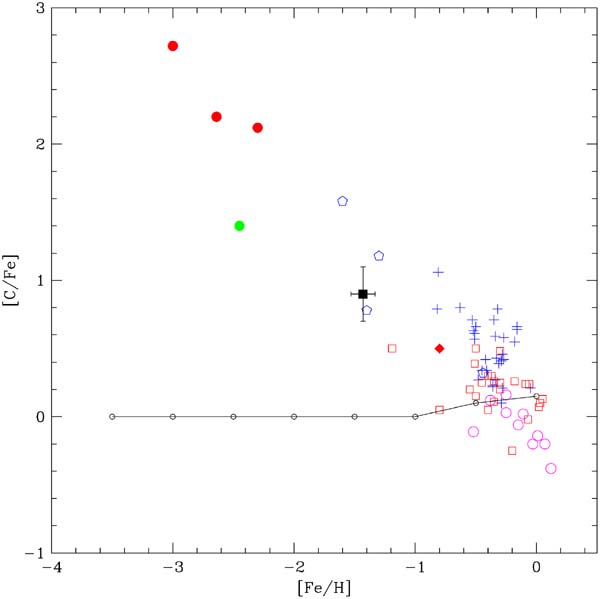
Figure 13. Diagram of [C/Fe] versus [Fe/H]. Symbols have the same meaning as in Figure 12. The solid line is the mean 〈[C/Fe]〉 for field stars taken from Masseron et al. (2006a).
Download figure:
Standard image High-resolution image
Relative to its main-sequence progenitor, a consequence of the first dredge-up is a reduced 12C abundance and nitrogen overabundance (Lambert 1981). However, some studies (Smith 1984; Barbuy et al. 1992) found that barium giants, relative to GK giants of similar Teff and log g, usually show excesses of carbon (in the form of 12C) and of the elements created by the s-process nucleosynthesis. The excess of carbon as well as of the heavy-element abundance is currently explained in terms of the mass-transfer phenomenon (Smith 1992). The nitrogen overabundance of +1.41 shows evidence of the operation of the first dredge-up. In addition, mixing seems to be efficient, as HD 206983 is a metal-poor star like HD 104340.
In some studies dedicated to obtaining the light element abundances in barium giants, the authors were able to show that the mean 〈[N/Fe]〉 ratio is always higher than the mean 〈[C/Fe]〉 ratio as evidence of the operation of the first dredge-up. For the 〈[N/Fe]〉 ratio, the results are 0.44 ± 0.18, 0.58 ± 0.16, 0.47 ± 0.12, and 0.34 ± 0.36 respectively from Sneden et al. (1981), Smith (1984), Barbuy et al. (1992), and Allen & Barbuy (2006) and for the 〈[C/Fe]〉 ratio the results are 0.22 ± 0.12, 0.30 ± 0.18, 0.08 ± 0.14, and 0.26 ± 0.17. For HD 206983, the [N/Fe] and [C/Fe] ratios are 1.41 and 0.84 (Table 2), respectively.
The oxygen abundance in HD 206983 follows the same trend as seen for halo stars of such metallicity. The mean [O/Fe] for a star with a metallicity in the range between −1.0 and −2.0 is ≈+0.5 (Masseron et al. 2006a).
Figure 8 shows that HD 206983 presents an excess of the CN products. Nitrogen is enhanced due to the first dredge-up and carbon due to the pollution of the star envelope by a former AGB companion. From Figure 8, the CN excess in HD 206983 is ∼0.9 dex while in the notation of [Σ(CNO)/Fe], is +0.86, which is the highest value observed among barium giants (Smith 1984; Barbuy et al. 1992; Allen & Barbuy 2006).
Figure 12 shows abundance ratios for the same sample of stars shown in the lower panel of Figure 5. Two peculiar stars HD 196944 (Začs et al. 1998) and BD+75 348 (Začs et al. 2000), the yellow symbiotic stars (Smith et al. 1996, 1997; Pereira et al. 1998) are also shown and three CEMP stars which are probably member of binary systems (Lucatello et al. 2005) are also shown. For these three stars, the mean [s/Fe] ratios were taken from Barbuy et al. (2005) and Aoki et al. (2002). For CH stars, we used the results from Vanture (1992c); for barium giant and dwarf stars we used the results from Allen & Barbuy (2006), Luck & Bond (1991), Smith et al. (1993), North et al. (1994), Pereira & Junqueira (2003), and Pereira (2005).
As discussed in Wallerstein (1997), the significant trend of increasing [s/Fe] with decreasing metallicity is the result of the operation of the reaction 13C(α, n)16O as a neutron source. It should also be noted that the scatter starts to increase down to [Fe/H] < -1.0 (Busso et al. 2001).
As well as the [s/Fe] index, the carbon abundance is also anticorrelated with the metallcity. Figure 13 shows the [C/Fe] abundance ratio plotted as a function of the metallicity given by [Fe/H] for the same objects as in Figure 12. In fact, such a trend was previously noted by Začs et al. (1998), Pereira & Junqueira (2003), Pereira (2005) and more recently by Masseron et al. (2006b) for a sample of metal-poor carbon-rich stars.
4.2.2. 12C/13C Ratio
In Figure 9, barium stars (open squares) occupy a region between the GKM giants and the SC and C stars. They closely follow the sequence that GK giants do, passing through the S and SC stars to become a carbon star along the TP-AGB phase. In CH subgiants, the 12C/13C ratio has been investigated by Sneden (1983). He showed that the 12C/13C ratio in CH subgiant stars is greater than 40. Compared to giants this is taken as evidence that the first dredge-up has not yet finished in these stars. In fact, in δ-Eri, a subgiant analyzed by Lambert & Ries (1981), this ratio is greater than 50. In normal giants, the 12C/13C ratio is 17.5 ± 0.21 (Lambert & Ries 1981), which is close to the predictions of 20–30 (Iben & Renzini 1983).
Among the chemically peculiar stars, specially those that present overabundances of the s-process elements, there are some CH stars that have low 12C/13C ratio (Vanture 1992a). Since barium and CH stars are the result of mass transfer, their abundance should reflect the composition of the AGB donor star and the unknown composition of the observed star. Thus, the carbon transferred from the AGB star will be dominated by that created by the triple-α reactions, i.e. by 12C, so that the 12C/13C ratio in the observed star should be high. In fact, observations of carbon stars by Lambert et al. (1986) show that this ratio lies between 30 and 100 (Figure 9). In barium giants, the 12C/13C ratio was investigated by Smith (1984, 1992), Barbuy et al. (1992), and Sneden et al. (1981). All of these studies showed that this ratio lies between 8 and 20. They all noted that this ratio for some stars is too low for their carbon overabundance. In fact, some stars lie between the two solid lines (Figure 9), which represent the predicted area of adding of carbon 12C material to the atmosphere of an M star. But there are still several other barium stars with 12C/13C ⩽10. HD 206983, analyzed in this paper, has also a low carbon isotope ratio, 12C/13C = 9.0 (Table 2).
In order to explain why barium stars (and also some CH stars) have very low carbon isotopic ratio, several scenarios have been discussed in Vanture (1992a) in order to explain how the accretion from an AGB star onto a main-sequence star (or a star at the first giant branch) would change this ratio. At the moment, no mechanism of the mass-transfer scenario, which could explain the observed very low carbon isotope ratio, has been proposed. One possible scenario is that the mass transfer would have happened when the observed star was on the main sequence, that is a classical barium star would be formed as a dwarf, before the occurrence of the first dredge-up. In fact, the large 12C/13C ratio obtained for barium dwarfs (Sneden 1983) seems to support a possible evolution from a barium dwarf to a barium giant since the large 12C/13C ratios observed in barium dwarfs would be lowered as a star ascends the first giant branch. In Barbuy et al. (1992), the authors claim that the low carbon isotopic ratio would be the result of two effects: the inversion of mean molecular weight resulting from accretion of AGB-star material and the occurrence of the first dredge-up. However, there is a point that could jeopardize the possible evolution from barium dwarfs to giants which was raised by Pereira (2005). Based on the metallicity distribution versus the [hs/ls] index, one can observe that there is a lack of barium giants with metallicities lower than [Fe/H] ⩽−0.5 and barium dwarfs with metallicities between 0.0 and +0.3. More light and heavy element abundance determinations, as well as carbon isotopic ratios, are needed for a large sample of barium stars in order to set some constraints on the possible scenarios as discussed by Vanture (1992a).
4.2.3. Lithium
For a long time, the observed Li abundances of the classical barium stars were found to be similar to those of CH subgiants (Pinsonneault et al. 1984; Smith & Lambert 1986a; Barbuy et al. 1992) which was in contradiction with the hypothesis of mass transfer. Barium giants with their deep convective envelopes should have Li abundances about a factor of 10 less than the observed values. This discrepancy led Smith & Lambert (1986a) to suggest that the CH subgiants were not the progenitors of the classical barium giants and that the CH subgiants and the classical barium giants were on separate evolutionary paths. Another explanation was proposed by Lambert (1987) who suggested that the 6708 Å Li i resonance doublet may be blended in the spectra of classical barium giants with an unknown line, probably belonging to the ion of the s-process element. Later, Lambert et al. (1993), studying high-resolution spectra of barium giants and CH subgiants, showed that an unidentified blend at ∼6707.74 Å is present within the feature previously ascribed to the Li i and CN in spectra of the classical barium stars. They noted that the strength of the missing line is well correlated with the strength of the s-process element lines. Consideration of this unidentified blend within the Li i resonance doublet permitted Lambert et al. (1993) to lower the observed Li abundance to the theoretical upper limit for the classical barium giants. In this way, they concluded that on the basis of their Li abundances, the classical barium giants may be considered as descendants of CH subgiants.
Creation of the D.R.E.A.M. database permitted the identification of various lines of rare-earth elements contributing to the absorption feature at 6708 Å. Shavrina et al. (2003), analyzing the spectrum of the roAp star HD 101065 (Przybylski's star), highly enriched in rare-earth elements, identified the Nd ii line at 6707.755 Å, very close to the position predicted by Lambert et al. (1993) of about 6707.74 Å. Use of a complete line list in the spectral region of the Li i line permitted the solution of the problem of the "shifted Li line" in the spectra of s-process enriched low-mass post-AGB stars. Several low-metallicity post-AGB stars were found to have enhanced Li abundance (Začs et al. 1995; Reddy et al. 1997, 1999, 2002). However, in all stars the Li i doublet was shifted redward by about 0.2 Å compared to the expected position based on the other photospheric lines. Reyniers et al. (2002) using the D.R.E.A.M. database proposed an alternative identification for the feature called a "shifted Li line" in the spectra of s-process enriched post-AGB stars and showed that this line is not due to the Li i but is due to the Ce ii transition at 6708.099 Å.
Our analysis of Li abundance in HD 206983 shows that this star has low Li abundance of log ε(Li) = −1.2, in accordance with the value expected for barium giants having deep convective envelopes. We also mention that the study of Denn et al. (1991) of cool carbon (non-J-type) stars showed that the Li abundance ranges from log ε(Li) = −0.6 to −1.7, with a mean lithium abundance of −1.2. This value is lower than the mean Li abundance found for K giants (−0.4, Brown et al. 1989). Transfer of the Li-poor material from a formerly carbon-star companion may lower the lithium abundance in the envelope of a barium star.
4.2.4. HD 206983 in Comparison with CH Stars
Luck & Bond (1991) singled out a small group of stars, although having a very strong CH band and very weak metallic lines that could not be categorized as "CH stars" once they lack the strong C2 bands usually seen in the classical CH stars. Luck & Bond (1991) proposed to call them as "metal-deficient barium stars." Motivated by this point, JP2001 found, after a search in the literature, another metal-deficient barium star candidate, HD 206983, which was also suspected to be a metal-poor star with a high radial velocity (Catchpole et al. 1977). As we have already seen, the position of HD 206983 in Figures 5, 12 and 13 gives support for its classification as a barium star. In fact, in JP2001 the authors showed that the luminosiy of HD 206983 (log L/L☉ = 2.1) is too low even for the first thermal pulse to occur. Therefore, the overabundances of s-process elements and carbon was taken as evidence that the atmosphere of HD 206983 was polluted by a former AGB companion.
In a recent paper, Jorissen et al. (2005) showed that several metal-deficient barium star candidates are, in fact, binaries including one from Luck & Bond's (1991) sample (BD+4 2466). In this study, the authors also showed that HD 206983 is a suspected binary. Since HD 206983 is a metal-poor star and a probable member of the halo population, a natural question arises of whether there would exist a connection between a CH star and a metal-poor barium star besides the fact that they are probably formed under the same mechanism, a mass-transfer episode from a TP-AGB star in the past which was the mechanism responsible for the observed overabundances. It seems that the basic difference between a CH star and a metal-poor barium star is the amount of carbon, as can be deduced from the C/O ratios. All of the C/O ratios available so far for CH stars show values higher than unity (Vanture 1992b). However, this ratio in some CH stars obtained in the above-mentioned paper should be viewed with caution since it is based on the assumption that [O/Fe] = +0.35. In two metal-poor barium star candidates, the C/O ratio is less than unity, in HD 206983 C/O = 0.66 (this work, Figure 9) and in HD 123396 C/O = 0.59 (Allen & Barbuy 2006). This explains why the strength of C2 lines in these stars is weaker than in CH stars. So, it seems that a good criterion to distinguish metal-poor barium stars from CH stars is the C/O ratio as this will result in the strength of the C2 lines. Another point which may be a source of confusion is the temperature of CH stars. Since CH stars are hotter than the metal-poor barium star candidates analyzed so far (CH stars have Teff ≈ 5200 K while metal-poor barium stars have Teff = 4200–4800 K), would a "hot" CH star look similar to a metal-poor barium star? This point can be illustrated by a set of spectra shown in Barnbaum et al. (1986). The spectrum of HD 26 is the one in which the strength of C2 is the weakest in comparison with the other cooler stars as a result of temperature sequence of CH stars. Unless a detailed abundance analysis is done, in some cases it would be difficult to distinguish between a metal-poor barium star and a CH star based on the spectral appearance alone.
5. CONCLUSIONS
The main conclusions from our abundance analysis, employing high-resolution optical spectra of HD 104340 and HD 206983 in order to obtain CNO and Li abundances and carbon isotopic ratio, can be summarized as follows.
- 1.HD 104340 is a metal-poor star but not a barium star as previously classified in the literature (Luck & Bond 1991; JP2001). Using data from the recent systematic search for radial-velocity variations by Jorissen et al. (2005), we show that a photometric period of 99 days nicely fits the radial-velocity data. In addition, the observed profiles of Hα and the K of Ca ii line suggest the presence of a stellar wind, thus giving support in favor of an evolved state for HD 104340. A (C+N) abundance excess is observed for this star and this is taken as evidence of the third dredge-up which, when coupled with the luminosity of HD 104340, leads to the conclusion that this star is a TP-AGB star in the early phase of thermal pulses. It is interesting to note that two of the four stars which are claimed to be metal-poor barium stars, by Luck & Bond (1991; HD 104340 and BD+03 2688) are, in fact, metal-poor TP-AGB stars (Jorissen et al. 2005). The general abundance pattern of HD 104340 in fact resembles in some aspects the abundance pattern observed for another metal-poor candidate for a TP-AGB star, CS 30322-023 (Masseron et al. 2006a). These stars have low carbon isotopic ratios and similar ["s"/Fe] ratios. The carbon overabundances observed in both stars are only moderate, and the location of HD 104340 in the [C/H] versus [Fe/H] diagram of Masseron et al. (2006a; Figure 11) lies slightly above the trend delineated by Galactic chemical evolution.
- 2.HD 206983 is a metal-poor barium star, not yet shown to be a binary system (Jorissen et al. 2005). However, its position in Figures 5, 12, and 13, as well as its low luminosity, give support to the interpretation that the observed overabundances of carbon and s-process elements in its photosphere are due to mass transfer from a companion, formerly a TP-AGB star. If HD 206983, as well as other stars such as HD 123396 (Allen & Barbuy 2006), BD+75 348 (Začs et al. 2000), and BD+4 2466 (Luck & Bond 1991), are indeed metal-poor barium stars, then the barium syndrome extends from disk metallicity stars to lower metallicities and also to the most extreme metal-poor stars, such as CS 29497-034, CS 22948-027, and CS 22942-019 (Lucatello et al. 2005). This point is very important for the mass-transfer paradigm since it can set a new constraint for the theory. The recent review by Frankowski & Jorissen (2006) nicely illustrates how the existence of metal-poor barium stars (yet to be proven as binaries) can be important in understanding the structure and evolution of chemically peculiar binary systems.
This research has made use of the SIMBAD database, operated at CDS, Strasbourg, France.
Footnotes
- *
Based on the observations made with the 1.52 m telescope at the European Southern Observatory (La Silla, Chile) under the agreement with Observatório Nacional (Brazil).