

Abstract
Much research has been carried out on the potential impacts of climate change on forest fire activity in the boreal forest. Indeed, there is a general consensus that, while change will vary regionally across the vast extent of the boreal, in general the fire environment will become more conducive to fire. Land management agencies must consider ways to adapt to these new conditions. This paper examines the impact of that changed fire environment on overall wildfire suppression capability. We use multiple General Circulation Models and carbon emission pathways to generate future fire environment scenarios for Canada's forested region. We then use these scenarios with the Canadian Forest Fire Behaviour Prediction System and spatial coverages of the current forest fuel composition across the landscape to examine potential variation in key fire behaviour outputs that influence whether fire management resources can effectively suppress fire. Specifically, we evaluate how the potential for crown fire occurrence and active growth of fires changes with the changing climate. We also examine future fire behaviour through the lens of operational fire intensity thresholds used to guide decisions about resources effectiveness. Results indicate that the proportion of days in fire seasons with the potential for unmanageable fire will increase across Canada's forest, more than doubling in some regions in northern and eastern boreal forest.
Export citation and abstract BibTeX RIS

Original content from this work may be used under the terms of the Creative Commons Attribution 3.0 licence.
Any further distribution of this work must maintain attribution to the author(s) and the title of the work, journal citation and DOI.
1. Introduction
The potential impacts of climate change on wildland fire danger in the boreal forest has been studied for decades and are well understood in general (Flannigan and Van Wagner 1991, Stocks 1993, Stocks et al 1998, Flannigan et al 1998, Flannigan et al 2001). This understanding is rooted in the linkage between weather, fuel drying and the subsequent ignition and spread of fire within wildland fuels; this has been the subject of study since the beginnings of modern wildfire research (Gisborne 1923, Wright 1932, McArthur 1966, Van Wagner 1968, Van Wagner 1977, Anderson 1970, Rothermel 1972). Studies of the impacts of climate change on landscape-scale area burned in North America's boreal forest have indicated increased disturbance levels through the current century (Flannigan et al 2005, Balshi et al 2009). Other studies have projected ignition increases due to decreased fuel moisture driven by the changed climate (Wotton et al 2003, Wotton et al 2005, Wotton et al 2010, Podur and Wotton 2010). While all General Circulation Model (GCM) projections indicate considerable spatial and temporal variability in changes in summertime rainfall amounts (both increases and decreases), it has been demonstrated that increases in fuel moisture due to projected increases in rainfall are more than offset by increased evapotranspiration from fuels on and in the forest floor (Flannigan et al 2016). While the level of absolute change in fire activity may be uncertain, particularly since many studies do not consider the increase in lightning activity (Romps et al 2014), overall it is clear that, barring very significant changes in forest composition, fire activity in the boreal forest will increase with climate change.
Despite the significant activity focussed on understanding general relationships between broad scale fire activity and climate change, there has been relatively little exploration on fire management (suppression) effectiveness. Studies of initial attack success using a complex simulation model of that process (Martell et al 1984, Martell et al 1994, McAlpine and Hirsch 1998) showed that relatively small increases in fire occurrence can lead to disproportionally large numbers of escaped fires. Wotton et al (2003) used that initial attack simulation model to examine changes in escaped fires in future fire weather scenarios and observed a non-linear response between escaped fires and fire occurrence; numbers of escaped fires increase disproportionately more than overall fire occurrence increases. Podur and Wotton (2010) simulated the fire growth and extended attack process in the province of Ontario to track impact of changed climatic conditions on large fire suppression and ultimately area burned. Increases in area burned were many times current levels. Here again the nonlinear relationship between increase in number of fires, number of escaped fires and ultimate area burned emerged. No detailed study of the fire behaviour characteristics of the fires simulated in that analysis was carried out but results from the simulation model suggested that the disproportionate increase in area burned was due to future fireline intensity frequently exceeding thresholds beyond which suppression resources, even resources such as water bombers, were able to have an effect.
Fireline intensity (Byram 1959) thresholds for fire suppression resources have been in use by fire management agencies for some time (Andrews and Rothermel 1982, Alexander and de Groot 1988), Hirsch and Martell (1996) provide a review of these limits and their ties to suppression resource effectiveness. Indeed the ubiquity of Byram's fireline intensity concept in fire management worldwide is a result of its use as a tool for characterizing fire suppression difficulty; fundamentally it characterizes the total energy release from a segment of a fireline and is thus well-related to flame length, wildfire buoyant power and convective and radiant energy. While some care must be taken in its interpretation across fuel types with significant structural differences (Cheney 1990), in Canada several key thresholds exist and are operationally used: at 2 MW m−1 ground resources begin to need support from aerial fire operations to be able to hold fireline, at 4 MW m−1 even aerial fire suppression resources (airtankers) begin to be ineffective at directly controlling fireline, and at 10 MW m−1 aerial resources (even heavy airtankers) are not directly effective at holding fireline (Alexander and de Groot 1988, Hirsch and Martell 1996).
The objective of our study was to use a set of well-accepted GCM and emission scenarios to examine potential change in fireline intensity in future fire seasons and its potential impact on the management of wildland fires in Canada's boreal forest. We were interested in not just overall potential changes in mean potential fire behaviour under scenarios of changed climates, but most importantly the changing frequency of exceeding certain established fire suppression thresholds.
2. Methods
2.1. Fuels
The study area was the entire forested area of Canada, effectively the landmass of Canada excluding the far north and the prairie regions in southern central part of the country (figure 1). The fuel data used in this study were rasters classified as one of the 16 Canadian Forest Fire Behaviour Prediction (FBP) System forest fuel types (FCFDG 1992), and were obtained from the Canadian Forest Service (B Simpson, personal communication 2016). The raster fuel layer for all of Canada was provided at 250 × 250 m resolution and contained 10 of the 16 different FBP fuel classes (see appendix A). The fine scale fuel raster was summarized into a 40 km by 40 km grid for the entire country; each 40 km cell was assigned a single FBP fuel type using a simple set of fuel coverage summary rules (appendix A). This summary of fuel type up to levels coarser than might be typical in targeted fire behaviour studies was a result of the broad extent of the forest under study (∼3 M km2) and the uncertainty in and spatial resolution of future projections of climate from GCMs; we felt there was little meaning in carrying out analysis at a very fine spatial scale.
2.2. Weather scenarios
Weather influences both the moisture content of fuels (and hence their receptivity to combustion) and also the spread of the fire itself and thus is a critical factor in fire behaviour assessment. Since day-to-day variations in weather can have a significant influence on an individual fire's growth we chose to develop scenarios of daily fire weather using the Canadian Forest Fire Weather Index (FWI) System (Van Wagner 1987) to estimate fuel moisture in differing layers of the forest floor important to different aspects of fire activity.
Fire weather in the FWI System is a once a day observation taken typically at 1 pm Local Daylight Time. We used mean daily outputs (and maximum daily temperature) from three GCMs to reconstruct daily fire weather observations for the entire country from the current time period to the end of the 21st century. The specific GCM's chosen for this study (CanESM2, HadGEM2 E S and CSIRO-Mk3.6.0) were chosen based an initial analysis of multiple GCMs (results not reported here); they presented a range of possible futures and were also found to also represent Canada's current climate well using a best performance method similar to that described by Perkins et al (2007). This assessment involved calculation of model skill scores for maximum temperature, minimum temperatures and precipitation within each Canadian ecozone; GCM output distribution was compared with Reanalysis II (Mesinger et al 2006) data. Future climate scenarios are based on differing levels of end of century radiative forcing and are denoted as RCP2.6, RCP4.5 and RCP8.5 (van Vuuren et al 2011). We chose to examine a baseline (or near-current) time slice from each scenario, 1971–2000, and four future 20 year time slices: the near future, 2021–2040; mid-century 2041–2060 and 2061–2080; and, end of the century, 2081–2099
2.3. Fire behaviour
The Canadian FBP System is the primary source of fire behaviour predictions for operational wildfire management in Canada and allows prediction of various aspects of daily fire behaviour in each of the major fuel types that make up the forests of Canada. It uses weather, fuel moisture derived from weather, and a fuel type categorization to estimate key aspects of fire behaviour, fuel consumption, spread rate, fire intensity, fire type, as well as many others. Our goal was to examine changes in headfire intensity between current and future time periods. Specifically we counted days in a season when important thresholds of fireline intensity were exceeded. These thresholds were 2 MW m−1, the limits of ground resources without significant aerial support; 4 MW m−1 for the limit where even aerial suppression becomes ineffective; and, 10 MW m−1, a limit at which it is well-accepted that even heavy water bombers are ineffective. In the process of calculating overall fireline intensity, the FBP System estimates the degree to which the overstory canopy are engaged and consumed in the fire an output, the crown fraction burned (CFB) (Van Wagner 1993). We also defined two thresholds on which we would summarize future scenarios using this indicator: 1) CFB > 0.1, defined in the FBP System as the transition from surface fire to an intermittently crowning fire and 2) CFB > 0.5, indicating over 50% of the overstory was engaged in crowning.
2.4. Analysis
To provide a reasonable look at future fire climate we summarized future daily projection of potential fire behaviour over 20 year time spans. We summarized future scenarios as both absolute means of indicators like temperature or fire intensity and as percent change in the average value from baseline average. For the key fire intensity thresholds we also summarized mean annual number of days above that threshold value and examined the percentage change from those values.
Podur and Wotton (2011) also examined the probability that an existing wildfire will actually spread actively and significantly grow on any day; they defined spread event day probability (SEP) as,
where FWI is the daily FWI value from the FWI System. We summed SEP annually (equivalent to the expected number of potential spread event days per year) and compared these annual averages to the current period.
3. Results
The extent of the fuels coverage (40 km by 40 km) used in this analysis is shown in figure 1. For each GCM and future carbon pathway we examined current and future conditions for two discrete study areas (each of about 16 0000 km2) in the western and eastern boreal forest (figure 1) and also mapped all results nationally. Mean annual values for fire behaviour indicators were summarized for each 20 year period starting in 2020 for each carbon pathway and GCM in these two study areas to provide contrast between the fire climate in eastern and western Canada (tables 1 and 2). We have presented just the near future (2020–2040) and the end of the century (2080 to 2100) in these results (tables 1 and 2) to provide contrast for policy makers.
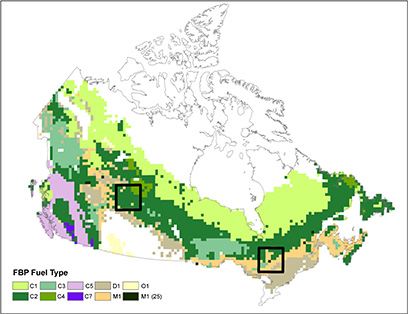
Figure 1. Extent of the forest area studied here, coloured by Canadian Forest Fire Behaviour Prediction (FBP) System fuel types (FCFDG 1992). The square areas outlined in the west central boreal and eastern boreal represent two summary units where changes in fire behaviour indicators were examined in detail.
Download figure:
Standard image High-resolution imageTable 1. Annual average values and changes for important elements of the wildfire environment for the entire fire season for the 160 000 km2 area in Eastern Canada (figure 1).
| Fire Indicatora | CGMC | HAD | CSIRO | ||||||||||||||||||
|---|---|---|---|---|---|---|---|---|---|---|---|---|---|---|---|---|---|---|---|---|---|
| baseb | RCP2.6 | RCP4.5 | RCP8.5 | base | RCP2.6 | RCP4.5 | RCP8.5 | base | RCP2.6 | RCP4.5 | RCP8.5 | ||||||||||
| 2030 | 2090 | 2030 | 2090 | 2030 | 2090 | 2030 | 2090 | 2030 | 2090 | 2030 | 2090 | 2030 | 2090 | 2030 | 2090 | 2030 | 2090 | ||||
| ∆Temp. | 0 | 1.0 | 1.3 | 1.1 | 1.6 | 1.3 | 4.9 | 0 | 1.4 | 1.4 | 1.1 | 2.6 | 1.5 | 4.9 | 0 | 1.2 | 1.4 | 1.0 | 1.9 | 1.0 | 3.3 |
| RAINratio | 1.0 | 1.1 | 1.1 | 1.1 | 1.1 | 1.1 | 1.1 | 1.0 | 1.0 | 1.1 | 1.1 | 1.0 | 1.0 | 1.0 | 1.0 | 1.0 | 1.1 | 1.0 | 1.2 | 1.0 | 1.3 |
| FFMC | 79.5 | 79.4 | 79.0 | 79.9 | 79.5 | 79.9 | 80.9 | 74.5 | 75.6 | 74.7 | 74.9 | 76.5 | 75.7 | 77.9 | 78.6 | 79.6 | 78.9 | 79.5 | 78.6 | 79.6 | 78.5 |
| DMC | 34.4 | 35.4 | 33.9 | 36.6 | 35.7 | 34.9 | 43.6 | 17.1 | 20.4 | 17.5 | 18.1 | 22.9 | 19.8 | 27.2 | 30.1 | 32.7 | 30.6 | 32.3 | 29.7 | 34.0 | 32.5 |
| HFI | 2746 | 3126 | 2907 | 3167 | 3251 | 2896 | 4356 | 718 | 1042 | 703 | 853 | 1286 | 1036 | 2045 | 3873 | 4804 | 4631 | 4663 | 4479 | 5058 | 5362 |
| ROS | 3.4 | 3.6 | 3.4 | 3.7 | 3.8 | 3.6 | 4.6 | 1.4 | 1.7 | 1.3 | 1.5 | 1.9 | 1.7 | 2.7 | 4.5 | 5.3 | 5.1 | 5.1 | 5.0 | 5.4 | 5.6 |
| #SEP | 68 | 79 | 76 | 79 | 86 | 77 | 104 | 32 | 39 | 35 | 36 | 46 | 38 | 61 | 60 | 69 | 67 | 67 | 68 | 70 | 78 |
| #CFB > 0.1 | 74 | 83 | 81 | 84 | 90 | 83 | 108 | 26 | 38 | 29 | 33 | 46 | 37 | 62 | 64 | 72 | 70 | 71 | 71 | 73 | 78 |
| #CFB > 0.5 | 49 | 59 | 56 | 59 | 64 | 57 | 83 | 12 | 19 | 12 | 15 | 24 | 18 | 39 | 47 | 55 | 53 | 53 | 53 | 56 | 62 |
| #HFI > 2 M | 62 | 72 | 70 | 73 | 79 | 72 | 98 | 17 | 27 | 19 | 23 | 34 | 27 | 50 | 56 | 64 | 62 | 62 | 62 | 65 | 71 |
| #HFI > 4 M | 41 | 52 | 48 | 51 | 57 | 49 | 75 | 8 | 14 | 8 | 11 | 19 | 13 | 32 | 41 | 48 | 47 | 47 | 47 | 50 | 56 |
| #HFI > 10 M | 16 | 21 | 19 | 21 | 25 | 18 | 36 | 2 | 3 | 1 | 2 | 5 | 3 | 12 | 21 | 26 | 26 | 25 | 26 | 28 | 34 |
a∆Temp. = change in overall mean temperature (future—baseline) (°C); FFMC = Fire Fuel Moisture Code (Van Wagner 1987); DMC = Duff Moisture Code (Van Wagner 1987); HFI = Head fire intensity (kW m−1); ROS = headfire Rate of Spread (m min−1); #SEP, expected number of fire growth days (Spread Event Days) per season; #CFB > 0.1 = number of days per season with intermittent or full crowning potential; #CFB > 0.5 = expected number of days per season with potential for >50% crown engagement; #HFI > 2 M = expected number of days per season that require airtanker support (intensity exceeds 2 MW m−1); #HFI > 4 M = number of days per season where airtanker effectiveness is at it's threshold of effectiveness (intensity exceeds 4 MW m−1); #HFI > 10 M = number of days per season where airtankers are definitely not effective (intensity exceeds 10 MW m−1). Values are fire season summaries averaged over the 20 years in each time period. bbase signifies the baseline period (1971–2000).
Table 2. Average annual values and changes for important elements of the wildfire environment for the entire fire season for the 160 000 km2 area in Western Canada (figure 1).
| Fire Indicatora | CGMC | HAD | CSIRO | ||||||||||||||||||
|---|---|---|---|---|---|---|---|---|---|---|---|---|---|---|---|---|---|---|---|---|---|
| baseb | RCP2.6 | RCP4.5 | RCP8.5 | base | RCP2.6 | RCP4.5 | RCP8.5 | base | RCP2.6 | RCP4.5 | RCP8.5 | ||||||||||
| 2030 | 2090 | 2030 | 2090 | 2030 | 2090 | 2030 | 2090 | 2030 | 2090 | 2030 | 2090 | 2030 | 2090 | 2030 | 2090 | 2030 | 2090 | ||||
| ∆Temp. | 0 | 1.7 | 1.7 | 1.5 | 1.8 | 1.4 | 4.4 | 0 | 1.7 | 1.9 | 1.3 | 3.3 | 2.2 | 5.9 | 0 | 1.4 | 1.2 | 0.6 | 1.4 | 1.1 | 3.5 |
| RAINratio | 1.0 | 1.0 | 1.2 | 1.0 | 1.1 | 1.1 | 1.1 | 1.0 | 1.0 | 1.1 | 1.1 | 1.0 | 1.0 | 0.9 | 1.0 | 0.9 | 1.0 | 1.0 | 1.1 | 1.0 | 1.0 |
| FFMC | 80.1 | 80.5 | 78.9 | 80.4 | 79.6 | 79.9 | 80.9 | 77.5 | 79.0 | 78.0 | 77.5 | 80.1 | 79.6 | 81.9 | 79.2 | 81.4 | 80.4 | 79.5 | 79.1 | 80.6 | 81.2 |
| DMC | 40.5 | 41.5 | 34.4 | 41.2 | 39.0 | 39.3 | 47.5 | 25.2 | 30.7 | 29.9 | 25.5 | 34.7 | 32.9 | 50.1 | 29.3 | 38.6 | 35.2 | 30.0 | 31.7 | 34.2 | 43.7 |
| HFI | 5200 | 5749 | 4463 | 5527 | 5176 | 5237 | 7223 | 2156 | 3186 | 3095 | 2430 | 4161 | 3827 | 8041 | 3873 | 8005 | 6975 | 5041 | 5752 | 6295 | 9950 |
| ROS | 5.0 | 5.4 | 4.5 | 5.2 | 4.9 | 5.0 | 6.1 | 2.8 | 3.6 | 3.4 | 3.0 | 4.4 | 4.1 | 6.8 | 4.5 | 7.5 | 6.6 | 5.3 | 5.7 | 6.2 | 8.4 |
| #SEP | 60 | 67 | 58 | 65 | 70 | 63 | 87 | 38 | 49 | 47 | 42 | 60 | 52 | 82 | 60 | 70 | 64 | 56 | 59 | 62 | 80 |
| #CFB > 0.1 | 90 | 97 | 85 | 95 | 101 | 92 | 118 | 56 | 74 | 66 | 59 | 88 | 76 | 110 | 64 | 96 | 87 | 80 | 81 | 87 | 104 |
| #CFB > 0.5 | 64 | 71 | 60 | 69 | 73 | 65 | 91 | 32 | 47 | 44 | 37 | 62 | 51 | 87 | 47 | 75 | 66 | 58 | 60 | 66 | 83 |
| #HFI > 2 M | 80 | 87 | 75 | 85 | 91 | 82 | 108 | 46 | 63 | 57 | 49 | 78 | 66 | 102 | 56 | 87 | 78 | 70 | 71 | 78 | 95 |
| #HFI > 4 M | 62 | 68 | 56 | 66 | 71 | 62 | 88 | 28 | 43 | 40 | 32 | 58 | 47 | 84 | 41 | 71 | 61 | 52 | 55 | 61 | 78 |
| #HFI > 10 M | 30 | 36 | 26 | 35 | 37 | 32 | 54 | 8 | 17 | 17 | 11 | 26 | 21 | 52 | 21 | 43 | 37 | 27 | 31 | 35 | 53 |
a∆Temp. = change in overall mean temperature (future—baseline) (°C); FFMC = Fire Fuel Moisture Code (Van Wagner 1987); DMC = Duff Moisture Code (Van Wagner 1987); HFI = Head fire intensity (kW m−1); ROS = headfire Rate of Spread (m min−1); #SEP, expected number of fire growth days (Spread Event Days) per season; #CFB > 0.1 = number of days per season with intermittent or full crowning potential; #CFB > 0.5 = expected number of days per season with potential for >50% crown engagement; #HFI > 2 M = expected number of days per season that require airtanker support (intensity exceeds 2 MW m−1); #HFI > 4 M = number of days per season where airtanker effectiveness is at it's threshold of effectiveness (intensity exceeds 4 MW m−1); #HFI > 10 M = number of days per season where airtankers are definitely not effective (intensity exceeds 10 MW m−1). Values are fire season summaries averaged over the 20 years in each time period. bbase signifies the baseline period (1971–2000).
Tables 1 and 2 show that, across all scenarios, temperatures increase in both the short and long term. As expected temperature increases are greatest (3 °C to 6 °C) for RCP8.5. The other less carbon emission intensive scenarios (i.e. RCP2.6 and RCP4.5) showed smaller increases (on the order of 1 °C to 2 °C). These changes are fairly consistent across the different GCMs. There is less consistency in the patterns of change in seasonal precipitation however. There are areas of decrease and areas of increase. Where increases are projected they tend to be fairly small however, on the order of 10%. While we used wind in the fire danger and behaviour calculations we found little overall change in overall mean fire season wind speed and thus do not report it in tables 1 and 2.
Fire Fuel Moisture Code (FFMC) and Duff Moisture Code (DMC) from the Canadian FWI System (Van Wagner 1987) are indicators of the expected dryness of fuels on and in the forest floor and operationally used indicators of the expected number of human- and lightning-caused fires (Wotton 2009). These fuel moisture indicators integrate daily temperature, humidity, previous drying and rainfall history. Their value reflects the level of dryness and ease of ignition of the fuel; higher values indicate drier fuels (i.e. lower moisture) and higher fire potential. There is some variability in the average changes observed in these elements (tables 1 and 2) though for larger temperature increases expected late-century in the 'business-as-usual' RCP8.5 there is generally increased dryness in forest fuels and consequently elevated fire ignition and spread potential.
Tables 1 and 2 reveal increased future fireline intensity as well as increases in fire rate of spread. While these values indicate a future forest environment with more intense and faster spreading fires, by themselves they don't provide much insight into the impact of the changed fire environment from the wildfire management perspective. The FBP System provides indicators of whether a fire might begin to engage the forest canopy in flaming and consequently transition to higher intensity, greatly increased flame lengths and ultimately become difficult to suppress. The Crown Fraction Burned (CFB) indicator in the FBP System summarizes the percentage of canopy involvement in flaming. The average number of days per fire season when this indicator was over 0.1 (an established threshold indicative of the start of crowning) were summarized (tables 1 and 2, figure 2) and showed increases across all scenarios; increases ranged from 3 to 40% for the near future (2020–2040) time period in the RCP8.5 scenario and much larger increased by the end of the century (30 to 140%). Figure 2 suggests the greatest of these increases will be observed in the northern parts of the boreal forest throughout the country and much of forested area in Eastern Canada (Ontario and east). Similar summaries were carried out for CFB > 0.5 to examine impact on days with substantially more crown engagement (tables 1 and 2). While fewer days overall achieved this level, increases were very similar in a relative sense.

Figure 2. Percent change from baseline in the mean annual number of days where intermittent crowning is possible (CFB > 0.1) for the RCP8.5 scenario for each GCM. The near future (2020–2040) and end of century (2080–2100) are shown.
Download figure:
Standard image High-resolution imageThe spread day probability model of Podur and Wotton (2011) is another way to consider potential for active fire growth; mean annual expected number of days where fire could be actively spreading increased 6% to 20% (across the GCMs and two study areas) for the near future decades (2020–2040) for RCP8.5 and 30%–92% for the more distant future (2080–2100) of that scenario (tables 1 and 2). Maps showing the extent of change (as a percentage above baseline) across the study area (figure 3) reveal relatively similar overall changes across the three different GCM's; some to moderate increase in these spread event days in the near future scenario of RCP8.5 and larger general increases across the entire forest area of Canada by the end of the century in the same scenario.

Figure 3. Percent change from baseline period in the expected number of days per fire season where active fire growth potential exists for the RCP8.5 scenario for each GCM. The near future (2020–2040) and end of century (2080–2100) are shown.
Download figure:
Standard image High-resolution imageChanges in average number of days per fire season when potential fireline intensity begins to exceed the ground-based suppression effectiveness threshold of 2 MW m−1 follow spatially a similar pattern (figure 4) to the CFB (figure 2); the strongest increases occurring earliest in the north portions of the boreal forest zone and broad increases across much of forested Canada by the end of the century. Increases above baselines numbers in the east and west study areas ranged from 2% to 55% in the near future and 28% to 195% by the end of the century using the RCP8.5 scenario (tables 1 and 2). Increases in the percentage of days at the >10 MW m−1 threshold (figure 5), which represents the limit well beyond which even direct attack by airtanker would be unsuccessful, show similar spatial patterns to that of the lower threshold, though the increases are more exaggerated due to the smaller number of days that exceed these thresholds in the current climate. Most of the GCMs for the RCP8.5 scenario projected close to a doubling of the number of days above this threshold, both in the east and the west.

Figure 4. Percent change from baseline period in the mean number of days per fire season where fireline intensity (at the head of a fire) exceeds 2 MW m−1 for the RCP8.5 scenario for each GCM. The near future (2020–2040) and end of century (2080–2100) are shown.
Download figure:
Standard image High-resolution image
Figure 5. Percent change from baseline period in the mean number of days where fireline intensity (at the head of a fire) exceeds 10 MW m−1 for the RCP8.5 scenario for each GCM. Near future (2020–2040) and end of century (2080–2100) are shown.
Download figure:
Standard image High-resolution image
4. Discussion
Future projections of temperature from GCM to GCM tend to be relatively consistent in terms of their spatial distribution of large and small changes across the forested area of Canada. In terms of climate change impact on wildfire activity, the wildcard has always been rainfall change, since rains wet fuels and wet fuels do not readily burn. However, recently Flannigan et al (2016) demonstrated that, overall across Canada, seasonal precipitation increases associated with climate change must be on the order of 15% to offset every 1 °C rise in temperature. Results here are consistent with those general observations. Precipitation increases, while quite spatially variable across the country, were typically on the order of 10% in the GCM projections; thus the increase in temperature projected (which tended to be around 1 °C in the most benign scenario of the near future and higher in others) leads to increased fuel dryness across the country. This increased dryness was reflected in changes in the FWI System's FFMC and DMC moisture indicators; increased values in these values represent drier fuel conditions. Models of fire occurrence have linked ignition likelihood to moisture content in both litter (for human-caused fire) and organic layer (for lightning-caused fire) in Canada's boreal forest zone (Martell et al 1987, Martell et al 1989, Vega-Garcia et al 1995, Wotton et al 2003, Wotton and Martell 2005). In an absolute sense, overall change in mean moisture content is small; however similarly small increases in average moisture have been shown to lead to an almost doubling of fire occurrence across Canada by the end of the century (Wotton et al 2010). Furthermore, these changes in overall fire occurrence, even when they are relatively small (e.g. early in the 21st century) have been shown to lead to larger increases in escaped fires and suppression resource demand (Wotton et al 2005, Wotton and Stocks 2006, Podur and Wotton 2010). This current study does not explicitly couple ignition with fire spread potential, but the results, which highlight significant increases in the frequency of exceeding important spread and fire suppression thresholds, are consistent with previously reported changes and would exacerbate any observed changes in fire occurrence rate.
The fire behaviour outputs summarized here were indeed spatially noisy, due to the influence of fuel type on the fire behaviour; however results from each of the GCMs consistently indicated that throughout much of the boreal the potential for crown fire occurrence will be rising in future (figure 4). The magnitude of that change varied spatially and from GCM to GCM but it was consistently large across the boreal forest. Thus, we can expect the boreal to be disturbed by an increased frequency of crown fire as the century unfolds, given the current distribution of forest type throughout the region. Increased crown fire occurrence would lead to increased crown fuel consumption and consequently increased overall carbon emissions from fire as well. This may be an important consideration in the future, but exploration of the detailed implications of changing fire behaviour on carbon emissions was beyond the focus of this paper.
Results from the spread day probability model, which is independent of the FBP System prediction methods, corroborated the general projections of crown fire frequency, indicating that the number of days of active fire growth will be more frequent in the future (figure 3). Thus, we will likely have bigger fires as well as more crown fires on the landscape (though these two factors are likely coupled), unless suppression methods can eliminate these spread potential days. Indeed similar studies of future area burn potential predict larger area burned on boreal landscapes under climate change (Wotton et al 2005, Flannigan et al 2005, Balshi et al 2009, Podur and Wotton 2010).
Increased dryness of fuels and the associated increased fire ignition potential, or increases in the number of days with crown fire potential or active fire growth potential, do not necessarily imply increased area burned; one might speculate that fire management organizations may increase fire suppression capacity to combat such environmental changes. Indeed Wotton and Stocks (2006) showed that increased fire occurrence could potentially be addressed by increased fire suppression resources. However, their analysis, using a complex level of protection analysis simulation of the province of Ontario's Initial Attack response system (McAlpine and Hirsch 1998), suggested that a doubling of resources was needed to compensate for the impact of just a 15% increase in overall fire occurrence. That study did not explicitly look at changed fireline intensity and suppression resources effectiveness thresholds in the extended attack of escaped fires, but only focussed on the initial attack phase. Podur and Wotton (2010) examined large fire growth and the extended attack side of the wildfire management system and found very significant increases in area burned (more than doubling of area burned) for a relatively moderate increase in future fire occurrence and fire danger. They speculated that these large increases were due to the interaction of both the increased escape fire load and the more frequent exceedance of air tanker effectiveness limits in the future, which allowed fires to grow unconstrained. Results here across all GCMs show large increases in the number of days where existing suppression resources become ineffective in future scenarios. In the Canadian GCM the number of days where the fireline intensity was above 10 MW m−1 (a threshold above which airtanker direct attack is considered operationally ineffective) doubled in eastern Canada (table 1) by the end of the century in the RCP8.5 scenario, and even showed increases of about 20% in the near future time period (2020–2040). Increases in the number of days above this critical threshold were also observed in the other more benign RCPs. The maps in figure 5 indicate that these increases are widespread across the boreal forest of Canada (greater in some areas less in others) and overall imply that we can expect not just increased incidence of crown fire, but increased incidence of unmanageable crown fire.
The specific absolute increases observed in this study (e.g. 24 more days that have potential for fire beyond the 10 MW m−1 threshold) should be interpreted with some caution. These absolute values are quite spatially variable because of the changing fuel types across the country (figure 1) and also vary from GCM to GCM. The important message is the broad general increases projected in the number of days where established resource effectiveness thresholds are exceeded. This increased intensity of actively spreading wildfires is not a problem that can be solved by more suppression resources (i.e. more airtankers). Broader use of indirect attack methods, which involve burning out in advance of a fire to limit its progression, as well as promoting fragmentation of the landscape by allowing wildfires to burn larger areas where it is socially and economically feasible, may be part of the solution to these problems.
When interpreting these results it is important to remember also that these fire intensity and suppression effectiveness thresholds are not absolute limits established by fundamental laws of physics; Hirsch and Martell (1996) provide a good review of the provenance of these thresholds and their use. They should be interpreted here as general indicators or guidelines about typical limitations of different suppression methods. The 2 MW m−1 limit is an operationally well-established limit where it is expected that ground resources will need the support of aerial water bombing to hold fireline. Whether this limit is 1.500 MW m−1 in a specific environment or 3 MW m−1 in another does not affect the results here. Similarly the 10 MW m−1 threshold is a common operationally used boundary for the most extreme fire intensity class in Canada that would be well-accepted operationally as indicating a point where airtanker attack is ineffective (more often the operationally-used aerial suppression effectiveness threshold is 4 MW m−1). Our choice of 10 MW m−1 was designed to simply be a very conservative choice to provide more distinct contrast to the 2 MW m−1 ground suppression threshold. Whether the limit beyond which aerial suppression becomes ineffective is 4, 6 or 10 MW m−1 does not really matter to the overall general message; climate change will increase the number of days where unmanageable crown fire can spread in Canadian forest.
5. Conclusions
Each of the GCM's and carbon emission scenarios studied showed increases in fuel dryness and fire behaviour starting from 2020 through to the end of the century. While previous work has demonstrated the increased fire occurrence that results from increased forest floor dryness, here we focussed on the potential change in the intensity and type of fires that occur throughout Canada's boreal forest. All future scenarios saw increases in the number of days where crown fires were likely. Furthermore, not only were crown fires more likely but overall the number of days when fire intensities could exceed the capabilities of suppression resources (even large airtankers) also increased substantially (doubling in some end of century scenarios). The challenges of wildfire management through the 21st century include not just dealing with an increased number of fires, but also an increased incidence of unmanageable crown fire.
Acknowledgments
We would like to thank Brian Simpson (NRCan-CFS) and Francois Robinne (U of Alberta) for help with organizing and processing various pieces of our fuels, weather and GCM data.
Appendix A: Supplementary description of methods of dataset assembly
A.1. Fuels
The baseline fuel grid comprised of 250 × 250 m cells for all of Canada (B. Simpson, CFS-NRCan, personal communication, 2016), and each of these small cells is classified with a single Canadian Forest Fire Behaviour Prediction (FBP) System fuel type (FCFDG 1992). This fuel type raster included 9 of the 16 FBP fuel types (with two main representations of the M-1 mixedwood type). These FBP System fuel types were C-1 (open spruce lichen woodland), C-2 (boreal black spruce), C-3 (mature jack or lodgepole pine), C-4 (immature jack or lodgepole pine), C-5 (red and white pine), C-7 (open Douglas fir or Ponderosa Pine), D-1 (leafless aspen), M-1 (boreal deciduous and conifer mixedwood with 50% conifer or greater), M-1(25) (boreal deciduous and conifer mixedwood with 25% conifer or less), O-1 (open grassland), and non-fuels.
The small cells were grouped into 40 × 40 km blocks and each block was assigned a single FBP System fuel type using a simple set of rules for assessing the fuel type most likely to influence fire behaviour in that block. The method for large cell fuel assignment in order of operations is as follows:
- 1.The percentage of each fuel type (including non-fuel) within the larger cell was determined
- 2.Percentage of open, conifer, deciduous, and general forested fuel types was calculated
- 3.If a cell contains greater than 75% non-fuel, it was assigned as a non-fuel, otherwise it is fuel
- 4.If a cell contains greater than 66% open fuel types among all fuel types, it was assigned the largest percentage of the open fuel type within the larger cell, otherwise it is considered closed canopy forest
- 5.If a cell contains greater than 50% conifer forest among forested fuel types, the highest percentage of the conifer fuel type was assigned, otherwise it is deciduous
- 6.Finally, if a cell contains greater than 50% deciduous forest among forested fuel types, the highest percentage of cover of deciduous fuel type is assigned.
The thresholds described above are based on a weighting of the relative fire behaviour potential for each of the cells. This relies on an assumption that if 'more volatile' and 'less volatile' fuels are distributed throughout a study cell, fire will burn through the more volatile fuels more readily.
For the purposes of FBP System calculations of fire behaviour in this study, the O-1 fuel type is assumed O-1a if the calculation day is before June 1 and O-1 b otherwise. While this date may not be representative for all grassy regions in all seasons, we feel that June 1 is a conservative and reasonable estimate for the general transition from matted to standing grass.
A.2. Weather interpolation to the fuel grid
For each of the historical and future climate scenarios we interpolated all daily GCM data to our 40 km fuel grid using ordinary Kriging methods in R (R Core Team 2014). Specifically, the krige function from the gstat package (Pebesma 2004) alongside the autofitVariogram function in the automap package (Hiemstra et al 2009). Next, the length and date of the fire season was determined at each gridpoint using the maximum temperature threshold of 3 continuous days above (below) 12 (5) °C to start (end) the season. Since the temperature may rise above and fall below these thresholds several times over the year, for this study, the longest continuous stretch of days with the fire season 'on' at each grid point was assigned as the fire season for the year. FWI and FBP System outputs were calculated at each gridpoint for each day of each year of each fire season using the fwiRaster and the fbp functions in the cffdrs package (Wang et al 2017).