

Abstract
This paper presents an overview of the state of measurement and monitoring capabilities for forests in the context of REDD+ needs, with a focus on what is currently possible, where improvements are needed, and what capabilities will be advanced in the near-term with new technologies already under development. We summarize the role of remote sensing (both satellite and aircraft) for observational monitoring of forests, including measuring changes in their current and past extent for setting baselines, their carbon stock density for estimating emissions in areas that are deforested or degraded, and their regrowth dynamics following disturbance. We emphasize the synergistic role of integrating field inventory measurements with remote sensing for best practices in monitoring, reporting and verification. We also address the potential of remote sensing for enforcing safeguards on conservation of natural forests and biodiversity. We argue that capabilities exist now to meet operational needs for REDD+ measurement, reporting, and verification and reference levels. For some other areas of importance for REDD+, such as safeguards for natural forests and biodiversity, monitoring capabilities are approaching operational in the near term. For all REDD+ needs, measurement capabilities will rapidly advance in the next few years as a result of new technology as well as advances in capacity building both within and outside of the tropical forest nations on which REDD+ is primarily focused.
Export citation and abstract BibTeX RIS

Content from this work may be used under the terms of the Creative Commons Attribution 3.0 licence. Any further distribution of this work must maintain attribution to the author(s) and the title of the work, journal citation and DOI.
1. Introduction
Policies to reduce emissions from deforestation (RED) and forest degradation, which constitute about 10%–15% of global greenhouse gas (GHG) emissions, have been advanced within an international United Nations Framework Convention on Climate Change (UNFCCC). The REDD+ mechanism, as laid out in various UNFCCC decisions, involves payments made based on emission reductions that have been measured, reported, and verified (MRV) relative to reference levels (RLs) (or baselines), and subject to various safeguards (e.g. to protect indigenous rights, biodiversity and ecosystem services). Each of these components of REDD+ is reliant to some degree on technologies for forest measurement and monitoring.
In this paper we present an overview of the current state of capabilities for monitoring deforestation, forest degradation, and carbon stock changes for emissions reporting requirements under the REDD+ framework. The paper is meant to be accessible to non-specialists and focuses on four key topics:
- ◯ UNFCCC requirements,
- ◯ measurement and monitoring needs,
- ◯ technological approaches,
- ◯ status and trends.
Because REDD+ is based on the fundamental premise of payment-for-performance, where performance is the reduction of forest losses and associated carbon emissions to the atmosphere, it is critically important that measurements of emissions are accurate, meaning they have low uncertainty, and are repeatable. The better changes in forest cover and carbon stocks are documented, the more valuable they will be in emerging carbon markets or other performance-based payment systems. Moreover, monitoring of natural forest cover and biodiversity can demonstrate compliance with environmental safeguards of REDD+. Meeting these measurement and monitoring needs requires consistent and repeatable views of forest landscapes around the world, which can only be accomplished using satellite and aircraft remote sensing that has been calibrated and validated with field and forest inventory measurements.
To reduce GHG emissions from forest loss, Parties to the UNFCCC developed REDD+. The basis for the emergence of REDD+ was the recognition that carbon emissions associated with land use change, including conversion of forests to other land uses, have generated about 20%–30% of historical global GHG emissions (Woodwell et al 1983, Houghton et al 1987). Today the annual number is closer to 10%–12% due to the rapid growth rate of fossil fuel emissions relative to GHG contributions from land use change (Pan et al 2011, Grace et al 2014. Nonetheless, efforts to reduce climate warming can be substantially advanced by mitigating or avoiding these emissions (Goodman and Herold 2014), while also preserving essential ecosystem services and multiple co-benefits (e.g. biodiversity, livelihoods) provided by forests (MEA 2005, Brandon 2014, Mullan 2014). A policy mechanism to RED was first formally introduced to the UNFCCC in 2005 at the 11th Conference of the Parties (COP) in Montreal. At the 13th COP in Bali, RED was expanded to include emissions from forest degradation (REDD), partly to avoid issues related to defining and differentiating between deforestation and forest degradation. In 2008, at the 14th COP in Poznan, REDD was further expanded to include forest conservation, sustainable management, and enhancements to forest carbon stocks, thereby marking the addition of the 'plus' to REDD, i.e. REDD+.
As currently conceived, REDD+ is an incentive-based policy mechanism often described as a payment-for-performance system. Participating developing countries receive financial incentives (i.e. payments) for their verified successes (i.e. performance) in reducing carbon emissions to the atmosphere from deforestation and/or forest degradation, as well as from enhancing the removal of carbon from the atmosphere through 'plus' related activities. These 'verified successes' may be quantified in units or credits typically equal to one metric ton of carbon dioxide equivalent. Payments may potentially be received when verified carbon credits are either purchased on international carbon markets by governments or businesses seeking to offset their emissions, compensated for by government supported funds, (e.g. Brazil's Amazon Fund), or by some combination of the two.
The system agreed by the UNFCCC for calculating emission reductions through REDD+ includes RLs, MRV, and safeguards. The level of forest-related emissions resulting from the implementation of REDD+ activities is calculated by comparing MRV emission reductions to a benchmark rate termed a RL. RLs are ideally based on the historical rate of emissions and adjusted if necessary to account for national circumstances. Finally, finance is contingent upon respecting social and environmental do-no-harm requirements, termed safeguards.
All three of these elements rely to some extent on technologies for monitoring forests. The UNFCCC Subsidiary Body on Scientific and Technological Advice (SBSTA) has developed guidelines for MRV. This guidance, provided initially at COP15 in Copenhagen, is associated with the development of national systems for monitoring and reporting REDD+ activities and associated RLs5 . The decision by SBSTA also stipulates that national monitoring systems for REDD+ and RLs provide measurement and monitoring estimates that are transparent, consistent and accurate, with reported uncertainties. At the16th COP in Cancun a decision was made to create a mechanism for positive incentives and associated safeguards for REDD+. The decision stipulates that these capabilities can be established over time, in order to allow countries with less limited technical capacity to advance their readiness for implementation. MRV systems may have different operational needs depending on whether they are being developed for globally comparable measurements or for countries' own national forest monitoring systems, discussed in sections 2.1 and 4.2 below. This distinction is fundamental for several of the sections that follow.
With the advent of REDD+ and the opportunity for payment-for-performance, a new era of forest measurement and monitoring is underway. In particular, satellite-based technologies to measure and monitor forest cover change and biomass density have advanced tremendously in recent decades. For example, when the first in NASA's series of Landsat Earth observation satellites was launched in 1972, analyses of what would now be considered low quality images required hours of visual assessment and manual delineation of land surface features. A single Landsat scene, covering about 31 000 km2, might take the better part of a day for a researcher to analyze. Today some 500 scenes from the latest satellite in the Landsat series are processed on a daily basis with unprecedented quality (i.e. much greater fidelity for repeat measurements) and for a wide range of land cover monitoring applications. It is now possible to use the entire Landsat archive to systematically map forest losses and gains globally on an annual basis (see figure 1) (Hansen et al 2013). In a related development, national space agency programs have made it possible for some tropical countries to routinely monitor their own forests, a capability that was in its infancy when Landsat 1 was launched in 1972 and came into early adolescence when initial maps of deforestation of the Amazon were published in 1993 (Skole and Tucker 1993). Countries such as Brazil now have alerting systems that utilize a range of satellite imagery to target illegal logging and forest conversion activities—an important policy-relevant achievement that allows for enforcement of domestic forest protection policies (discussed in section 4).
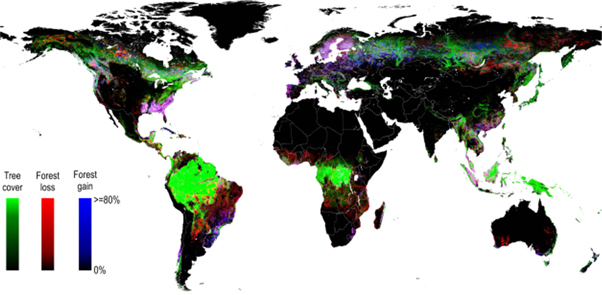
Figure 1. Global map of tree cover losses and gains generated from a time-series analysis of 654 178 Landsat images acquired over the period 2000 through 2012 (from Hansen et al 2013). The colors indicate where change in the extent and density of tree cover occurred. Greens indicate areas that remain unchanged, reds indicate losses, and blues show gains over the 12 year period. Magenta colors indicate areas where rapid turnover occurred, with both loss and gain occurring during the period.
Download figure:
Standard image High-resolution imageMeasurements from forest inventories and other field data are valuable for calibrating and validating remote sensing data and so ensure changes in forest properties mapped from satellite or aircraft are consistent and accurate. Additionally, inventories are valuable for national reporting based on statistical sampling and numerical summaries of forest change. However, forest inventories tend to lack consistency among countries and some less developed nations, particularly across the tropics, have little or no inventory systems at all. Nonetheless national forest inventories have an important role to play in evolving REDD+ programs that require standardized reporting of forest change under the UNFCCC. They provide a basis for assessing change through time at permanent plot locations, as well as the potential for collecting additional relevant information on both social and biodiversity safeguards relevant for the sustainability of the REDD+ mechanism.
Because of the limitations of existing forest inventories, new capacities are being developed in many countries. This capacity building requires tremendous investment, and so efforts to advance and standardize inventory systems, and associated technical capacity (including data collection, management, analysis, quality control and review) are underway as part of UN-REDD (a combination of UN agencies including the UNDP, UNEP and the FAO) and other organizations. Related efforts focus on technological capacity building to incorporate inventories with satellite and aircraft remote sensing of forests and thereby document changes through time over larger areas than field sites or inventory locations. Many of these efforts focus not only on building capacity with government forestry agencies, but also on community forestry user groups and including indigenous communities, thereby empowering REDD+ stakeholders on the ground (Torres 2014). Marked improvements in most countries ability to monitor their forests in the context of REDD+ has already been documented (Romijn et al 2015).
As a result of the advances in remote sensing and the development of forest inventories, the state of the science on forest measuring and monitoring has matured to meet operational REDD+ needs. These advances include the ability to measure and map the past and current extent of global forests (from the 1970s onward), their percent canopy cover (allowing for threshold definition of what constitutes a 'forest' and thus 'deforestation'), the gains and losses of forest cover on an annual basis globally (figure 1), their biomass density (carbon stocks), and even their vertical canopy structure (e.g. for habitat and related biodiversity assessments). Combining these various sources of information with inventory data, particularly on forest cover and carbon stocks, allows for GHG emission estimates that can meet the needs of REDD+ MRV.
2. Reference levels and measuring, reporting and verification
Measuring and monitoring of carbon stock change and associated emissions for any given area, whether arising from deforestation or forest degradation, are needed for national reporting purposes for REDD+. Since REDD+ payment is based on performance, i.e. emission reductions, RLs and MRV form the backbone of REDD+. Emission reductions are measured as verified emissions (via MRV) subtracted from a benchmark or baseline rate of emissions (RL). Both RLs and MRV rely on monitoring of forest emissions from deforestation, degradation, 'plus' carbon stock enhancement within regrowing forests and conservation of forests that remain forest. The monitoring needs for each of these three activities is described here. Text applies to both RLs and MRV except where noted otherwise.
2.1. Monitoring the first D: emissions from deforestation
Deforestation is defined as the conversion of forest to a non-forest land use, and emissions from deforestation can be calculated by combining information on the area deforested ('activity data') with information on how much carbon is lost to the atmosphere as a result of those changes ('emission factors'). In this Intergovernmental Panel on Climate Change (IPCC) 'gain-loss' approach, activity data is information on area of change, and can include management practices. For example, an activity is how many hectares of forest had been converted to other uses in a country over a 10 year-period.
Emission factors account for the carbon content of various biomass components (above- and belowground biomass, dead wood, litter and soil organic matter) (Herold et al 2009, Maniatis and Mollicone 2010). These components are considered 'key categories' useful for countries to focus their emissions reduction strategies (Grassi et al 2013), which in the context of REDD+ nearly always includes deforestation and degradation of forest aboveground biomass. Emission factors for these key categories are needed because not all forests have the same carbon content. For example, a dry forest in Brazil may have 40 tons of carbon per hectare in standing vegetation, while a rainforest in the Congo Basin may have over 200 tons of carbon per hectare. Belowground carbon also varies widely, with mangrove and peat-swamp forests being particularly carbon-rich (Page et al 2002). If measurements of emission factors are sufficiently dense and representative of a given area (or strata), a second IPCC 'stock difference' approach can be used to estimate emissions without explicit information on activity data. This option is explored further in sections 2.1.2 and 5.1.
Using a gain-loss method, activity data and emission factors are obtained from a combination of forest inventory and satellite data (discussed in the following two sections), and emissions of carbon to the atmosphere can be calculated as the product of forest area lost (activity data) and carbon density (emission factors) of lands prior to deforestation or forest degradation. This calculation yields an estimate of committed emissions, that is, the amount of carbon that will be released to the atmosphere eventually, even if not all of it is actually released in the year of disturbance. For example, when deforestation is accompanied by burning, much of the carbon stored in the vegetation is emitted almost immediately as carbon dioxide while some of the unburned biomass decays (and emits carbon) more gradually. With committed emissions, such releases are all counted during the year of the activity. Additional approaches to emission estimation, varying in complexity, are discussed below in the context of measurement needs.
2.1.1. Forest cover change/activity data
Remotely sensed data enable mapping and monitoring of forest cover and change over large areas at regular intervals, providing information on where and how changes are taking place at annual or even finer time scales. Satellite remote sensing provides the capability to measure and monitor changes taking place at relatively fine spatial resolution (<1 ha) over very large areas (regions to continents). Moreover, because satellite-based sensors such as Landsat (owned and operated by the US Geological Survey and NASA) collect data on a daily basis as they circle the Earth, and because the data are typically distributed at minimal to no cost to users, monitoring of forest clearing can be implemented consistently and accurately across large regions as compared to a much smaller portion of the landscape that can be monitored as part of traditional forest inventory efforts. For example, 30 years ago (in the mid-1980s), it would cost a researcher $5000 to obtain a single Landsat image (covering an area 170 km by 183 km). A country the size of Brazil requires at least 20 such images to entirely cover its territory, even for a single acquisition timeframe, and many times that number may be needed to obtain cloud-free coverage. Now, anyone with a fast internet connection can obtain these data for free, and processing time has been reduced dramatically as a result of advances in computing and data serving.
The Landsat program provides a robust data set for measuring and monitoring deforestation. Three developments have facilitated dramatic advances in measuring and monitoring deforestation from Landsat data in recent years. These are: (i) opening of the Landsat archive in 2008 making the data freely available to and downloadable by users, (ii) improved computing capabilities enabling rapid processing of large data volumes, and (iii) development of mapping methodologies designed to take advantage of these large volumes. Enabling the use of the entire Landsat database has allowed users to largely overcome issues of cloud cover and other factors that previously resulted in missing coverage. Landsat is in many ways ideal for measuring deforestation because unlike other Earth observation systems it: (i) has a global acquisition strategy, meaning every part of the land surface is imaged systematically over time, (ii) makes data freely available through the USGS, (iii) provides data access through multiple delivery portals, (iv) ensures high fidelity image characteristics, meaning data are of consistently high quality and (v) provides pre-processed data to enhance usability, including geometric and radiometric corrections applied to all archived images. No other system currently has these features, which have been implemented with Landsat since 1999. Data from 1972 to 1999 lack the systematic global acquisition strategy but have all other features.
A number of satellite-based national programs for monitoring forest cover loss are already operational. The standard to date for national monitoring is Brazil's Amazon Deforestation Monitoring Project (PRODES) and associated data produced and distributed by the Brazilian National Institute for Space Research (INPE). INPE provides annual updates of deforestation for the states of the legal Amazon, including spatially detailed digital maps. While other countries also have satellite-based deforestation mapping programs (e.g. Australia and India), they do not provide map products to the public as INPE does. We expect more countries will emulate Brazil in delivering timely and publicly available information on historic and current deforestation patterns and rates.
The continuity of the satellite observational systems into the future will enable the quantification of longer-term trends in deforestation, a requirement for carbon measurement, monitoring and reporting relative to baselines6 (GFOI 2013, GOFC-GOLD 2014, Hewson et al 2014). Having a consistent set of measurements is critical to establishing trends in forest cover over time. Because of the advances noted above, an unprecedented global map of forest losses and gains, based on changes in tree cover density, was developed from Landsat data for the period 2000–2012 (Hansen et al 2013) (figure 1). This data set can be visualized by all interested parties via a Google Earth Engine web platform7 . The data products are also included in a web platform called Global Forest Watch (globalforestwatch.org), which makes the data available to anyone in a user-friendly format, thereby advancing transparency across the entire user base and ensuring users of the data can aid development of improved data products through time. The continued availability of forest monitoring capabilities like those conveyed by Landsat are critical for a wide range of Earth science and resource management applications, including REDD+. However, it is important to note that the maintenance and replacement of existing sensors is not guaranteed so continuous efforts are needed to ensure operational funding. Broad-based awareness of the value of Landsat and other satellite missions, and associated political support, will help to ensure that the line of continuous and consistent earth observation remains unbroken. Moreover, the implementation of earth observation sensor systems with similar and expanded capabilities and data policies is needed. For example, Brazil's open and free data policy will be made more valuable to the global community as it extends the coverage of its China-Brazil Earth Resources Satellite data acquisitions8 , and the European Space Agency's Sentinel series of satellites has a planned data access policy similar to that of the Landsat system9 . Moving such land imaging systems into operational modes will ensure the accurate, consistent and long-term monitoring of global forest resources.
2.1.2. Carbon stocks/emission factors
The second key component required for tracking emissions associated with the conversion of forest land to other land uses is the measurement of emission factors, or the carbon stocks associated with areas that have undergone change. Regardless of the vegetation type, about half of its aboveground woody biomass consists of carbon, and is thus commonly referred to as the vegetation aboveground carbon density or carbon stock. Information on carbon stocks is not only important for REDD+ but it is also commonly used in the modeling of global carbon budgets (see www.globalcarbonproject.org), providing valuable information on the potential for carbon sequestration from the atmosphere via plant growth (i.e. through net photosynthesis).
All tropical forests are not equal with respect to their potential to mitigate emissions from deforestation and degradation. In the context of REDD+, data on the distribution of carbon stock across landscapes is critically important because carbon stock density can be quite uneven and patchy. If deforestation takes place in an area of high carbon stock, more carbon will be emitted to the atmosphere, all else being equal. A comparably sized area of deforestation in a low carbon stock area will, conversely, emit less carbon to the atmosphere. This is important when considering how extensively to distribute field sites in order to adequately measure changes in emissions from deforestation or forest degradation. Many field plots have historically been located in sites that were not altered or disturbed by human activity, in so-called primary forests, and so were not necessarily representative of many landscapes, particularly in the tropics where disturbance is commonplace. Moreover, because field measurements are time consuming and thus relatively expensive, it is difficult to achieve sampling densities that can adequately capture local spatial variability across diverse landscapes and large tropical countries such as Brazil, Indonesia or the Democratic Republic of the Congo. Nonetheless, field data are essential for providing a basis to extend local measurements over larger areas, and remote sensing provides the means to do so. In addition to allowing for the calibration of aircraft or satellite observations, subsets of field measurements held in reserve are necessary for validating (i.e. assessing the accuracy) of carbon stock maps derived from the combination of field and remote sensing measurements.
2.1.2.1. Aboveground carbon stocks/emission factors
The most promising and robust ways to map aboveground carbon stock across landscapes rely on the synergistic use of field measurements (e.g. from forest inventories, research plots, and/or long-term monitoring sites) and remote sensing measurements (whether from aircraft, satellite or both). Here we briefly describe a few approaches to meet this need and, in the process, increase the resolution of carbon stock density maps to a point they are comparable to the resolution of the forest cover change maps discussion in section 2.1.1 above. We provide a greater level of detail (and reference material) in this section because we view it as one of the areas where technological advances have had, and will have, a substantial impact on advancing REDD+ implementation.
2.1.2.2. Synthesis of field plots and national forest inventories with cover type classification
A basic method for producing maps of carbon densities is to generalize carbon densities calculated at field plots to different types of forest (e.g. dry, moist, or wet tropical forest). This approach assigns average carbon stock values to vegetation types, land use types or even ecoregion types (e.g. Gibbs et al 2007). This so-called 'stratify and multiply' approach is somewhat limited in that, as noted earlier, an average value may not adequately represent variation in carbon stock within a given generalized type class. At the national-scale, more detailed forest type discriminations can be applied and related to average carbon stock estimates, but ultimately there are limitations to the degree of cover types that are practical and reasonable to discriminate. For example, aboveground carbon loss in the Democratic Republic of Congo has been estimated by applying average carbon stock estimates to satellite-derived maps of wetland and dryland primary, secondary and woodland forest types (Tyukavina et al 2013). Follow-on work extended that analysis to the entire tropical forest region using a tropics-wide stratification scheme (Tyukavina et al 2015), while also identifing changes in natural versus managed forests (discussed more in section 4.1). Methods combining sampled carbon stock data with satellite-derived carbon stock strata and loss data offer a comparatively simple and straightforward way to integrate activity and emissions factor data. However, areas where carbon stock was estimated in the field may not and often do not match the conditions where disturbance is actually taking place, and this can introduce substantial uncertainty in estimates of carbon stocks and associated emissions (Goetz et al 2009, Houghton et al 2009).
2.1.2.3. Synthesis of field plots and aircraft remote sensing measurements
Maps of carbon stock can also be estimated over large areas (hundreds of km2) by calibrating remotely sensed measurements from aircraft with estimates of carbon stock density from field plots. These estimates are more accurate than those produced through stratification by forest type described above. Aircraft-acquired light detection and ranging (LiDAR) data is particularly valuable for carbon stock mapping because it provides estimates of canopy height, cover and vertical structure that together are highly correlated with aboveground carbon stock (Dubayah et al 2000, Næsset and Bjerknes 2001, Asner et al 2010). LiDAR is a technique that sends a laser pulse from an apparatus mounted on an airplane or a satellite orbiting the Earth to collect three-dimensional data on forests. In the same way that new medical imaging technologies can look beyond the skin into the human body, LiDAR can penetrate through the upper canopy to reveal the density of vegetation profiles beneath, all the way to and including the ground surface topography.
There have been many applications of LiDAR to estimate carbon stock (see Zolkos et al 2013 for meta-analysis). Such studies have shown accuracies that have ranged from about 20 to 200 Mg/ha at plot scales (i.e. 30 m to as large as 1 ha). Relative to mean biomass levels, which ranged between 20 and 600 Mg/ha, the errors in these studies have a mean of about 20%, which can be improved as systems are advanced and sampling density increases. Reported errors vary with the magnitude of field biomass reported. This in turn is often related to the size of the area that is being assessed, since larger areas typically have lower averages than smaller field plots, particularly when the latter are located in 'pristine' areas that have not been recently disturbed. Because few studies provide spatial maps of error or uncertainty, it is important to note that accuracies reported for larger areas tend to be better than the accuracies reported more locally because, in the absence of bias, error is reduced as more observations are available to capture spatial variability and estimate the average.
Aircraft remote sensing, particularly with LiDAR sensors, has substantially advanced mapping of aboveground carbon stock. However mapping large areas with aircraft has been estimated to cost up to $250 million—a somewhat expensive proposition, albeit only 5% of total current pledged funding for REDD+ (Mascaro et al 2014). To overcome these challenges, approaches linking samples of LiDAR acquisitions with continuous coverage satellite data are being rapidly advanced (Goetz and Dubayah 2011, Baccini and Asner 2013), as are efforts to establish vegetation lidar measurements on spaceborne platforms (next section).
2.1.2.4. Synthesis of field plots and satellite measurements for monitoring
Finally, maps of carbon stock can be estimated over very large areas (e.g national to global scales) by calibrating satellite measurements with estimates of carbon stock density from field plots. Estimating the carbon content of forests and its dynamics using aircraft has driven a desire for a space-based LiDAR mission appropriate for carbon stock mapping and monitoring. New carbon stock maps have been developed at sub-kilometer resolution using a combination of LiDAR data from an instrument designed for ice sheet monitoring (the Geoscience Laser Altimetry System, GLAS, onboard a satellite called ICESAT-1) and imaging satellite observations from MODerate spatial resolution Imaging Spectroradiometer (the MODIS). These maps have been produced for large areas of Canada (Boudreau et al 2008), Siberia (Neigh et al 2013) and even the entire tropical region (Saatchi et al 2011, Baccini and Asner 2013) (see figure 2). Reported errors on the plot data used to develop the models for these maps were on the order of 5% whereas individual location errors in the derived maps are typically higher. When aggregated nationally or to a continental scale, errors are again reduced via the effect of spatial averaging to around 5%. Once carbon stock maps exist they can be readily combined with activity data using either sampling (e.g. Achard et al 2014) or wall to wall approaches (e.g. Baccini et al 2012, Harris et al 2012) to estimate and spatially map emissions. Several group efforts are now underway to extend the synthetic approach to mapping carbon stock at higher spatial resolution, through time, across the globe. Radiowave Detection and Ranging (RaDAR) imagery can assist this effort as well because, unlike optical imagery or LiDAR, it has the unique ability to penetrate cloud cover and can be acquired either during the day or night.
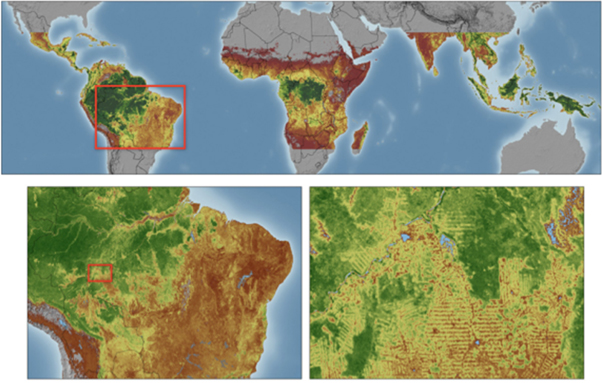
Figure 2. Map of live woody vegetation aboveground biomass across the pan-tropical region, derived from a combination of multitemporal MODIS imagery and GLAS LiDAR measurements co-located with standardized field inventory measurements in 12 tropical countries (after Baccini et al 2012). Greens indicate high biomass areas (up to ∼200 tC/ha) and browns indicate low values (<30 tC/ha). Gray areas are unvegetated or outside the area mapped. Red boxes indicate the area enlarged.
Download figure:
Standard image High-resolution imageA significant advance in monitoring of forest carbon stocks between 50° North andSouth latitude will be possible in the next few years with the installation of a LiDAR instrument on the International Space Station (ISS). Development of the mission, called Global Ecosystem Dynamics Investigation (the GEDI) was initiated in July 2014. The ISS orbits around the equator and GEDI will acquire extensive data sampling (some 15 billion locations within a year of operation) that will allow derivation of carbon stock maps across large areas (e.g. regions, continents, the pantropical domain) at higher resolution and lower error than is currently possible. This capability will also vastly improve the potential for assessing changes in carbon stocks across tropical forest areas. Other upcoming missions advancing remote sensing technological capability are summarized in section 5.
2.1.2.5. Belowground carbon stocks/emission factors
Belowground biomass is also an important carbon pool (or key category) that is receiving increasing attention in the context of REDD+, because a fraction of this carbon is released to the atmosphere following deforestation. Belowground carbon includes carbon contained in living biomass (e.g. roots) as well as organic carbon in the soil. Soil organic carbon, in turn, may include both mineral soils and, in peatlands, rich organic soils. Soil carbon is particularly important in peatland ecosystems where deforestation can lead to the draining of deep organic soils and sometimes soil burning, generating large carbon emissions to the atmosphere (Page et al 2002). In general, however, 70%–90% of carbon in tropical forested ecosystems is concentrated aboveground (i.e. in the trees) (Cairns et al 1997), which is also the component of the ecosystem most vulnerable to disturbance (whether through logging, land conversion, fire, insects, windthrow, etc), and is thus more readily released to the atmosphere.
Ratios of above to belowground biomass have been estimated for different ecosystems (e.g. Jackson et al 1997) and can be used to roughly approximate belowground values once aboveground carbon stocks have been estimated (IPCC 2003, 2006). While this approach is probably overly simplified, it provides a basis for approximating the potential of belowground carbon emissions associated with vegetation biomass (albeit not the carbon in organic soils, which cannot be readily estimated using remote sensing). In general, most of the dynamics of carbon emissions are associated with changes in aboveground carbons stocks, but in some key regions belowground carbon stocks are large and important because of their potential to release carbon to the atmosphere if deforested. Those regions need to be better characterized, but remote sensing has limited capabilities for estimating the stocks of belowground carbon except where it can be associated with specific types of aboveground vegetation.
Summary: advances in both the mapping of forest cover change and carbon stock density are enabling more accurate estimates of emissions from deforestation than ever before. Mapping forest cover change (activity data) using moderate resolution imaging sensors (such as Landsat) is now commonplace, and routine operational monitoring is done in several tropical countries, particularly in Brazil. Major advances have recently been made in mapping the losses and gains of forest cover at the global scale, annually, for multiple years, and this capability is being extended both forward and backward in time to set and assess RLs. Thus satellite remote sensing is already providing essential capabilities for meeting REDD+ operational needs.
In terms of aboveground carbon stock density, REDD+ implementation would benefit greatly by reducing uncertainties associated with the carbon stocks of specific areas that have been deforested. In this regard, field inventories and remote sensing measurements are equally essential, and are most effective when used synergistically in an integrated manner. Implementing monitoring schemes that measure changes in stocks includes both field and LiDAR data, but neither of these is available with continuous coverage over large areas. As a result, relationships derived between field and LiDAR measurements need to be translated to imaging sensor data sets (whether optical or RaDAR) in order to map widely and consistently. Recent efforts have shown it is possible to do this well, and improvements in accuracy will continue to increase through time as more extensive field and remote sensing data become available. The approaches for meeting vegetation carbon stock and associated emission factor needs that we describe are not mutually exclusive and, in fact, can complement one another and thus provide multiple lines of evidence that make for more reliable and repeatable measurements going forward.
2.2. Monitoring the second D: emissions from degradation
The second 'D' in REDD refers to forest degradation and the associated emissions from such activities, defined as the loss of aboveground biomass from forests. In the context of REDD+, degradation is the loss of carbon stock that occurs within forested land but without a change in the designated type of land use, i.e. what was forest still qualifies as forest despite the reduction in carbon stock (Maniatis and Mollicone 2010). But it is worth noting that forest degradation is not as well quantified as deforestation10 , partly because of past ambiguity of definitions and partly because the activities that lead to degradation can be highly variable, ranging from selective industrial logging to progressive degradation in agroforestry systems to fuel wood removal and charcoal production. Nonetheless, the IPCC clearly defines forest degradation as loss of aboveground biomass in areas that remain forest.
The UNFCCC allows degradation to be determined on a national level. For consistency across methodologies, as well as across nations for reporting purposes, it is useful to utilize a standardized criteria of change in aboveground carbon stock. The ability to map carbon stock degradation is relative to the amount of biomass removed and the timeframe of the degradation process. In some cases continuous degradation pressure over a longer timeframe can lead to the loss of most if not all forest cover, which is equivalent to deforestation when cover thresholds defining forests are passed.
2.2.1. Emissions from degradation over time
Calculating emissions from degradation is more difficult than calculating emissions from deforestation for two reasons: estimates of biomass density at multiple points in time are required, and carbon sequestration due to regrowth must be considered. As with estimating emissions from deforestation, described in section 2.1, both forest area (extent) and carbon stock density are needed to capture the components of forest degradation emissions to the atmosphere. Unlike the case of deforestation, however, emissions from forest degradation are more uncertain for two reasons. First, to estimate the emissions from degradation, multiple estimates of biomass density (before and after degradation) must be obtained, from which the difference is an estimate of the committed emissions. In contrast, emissions from deforestation require only a single estimate of biomass density. Degradation may also be more difficult to measure in the field than deforestation because, unlike deforestation, which is usually a short-term conversion from forest to non-forest, degradation can take place gradually over years.
The second issue that adds to the complexity of estimating the emissions from degradation is the possibility that degrading processes (logging, burning, grazing) may be followed by recovery. When wood is selectively harvested from a forest, for example, the carbon density of the forest is reduced as a result. But if the land is not converted to another use, the harvested forest will accumulate carbon again as the forest grows back. Does the accounting for carbon in forest degradation include only the gross emissions, or does it include the net effect of loss and recovery? If one is interested in only the gross emissions of carbon from degradation, then the recovery is irrelevant. But if one is interested in the net emissions, and if a harvested forest returns to its initial carbon stock density, the net effect over the longer term is zero. Fully accounting for stock changes requires repeated observations over a time scale of decades. We consider the issue of regrowth in the section 2.3, but it is important to acknowledge its relevance to the measurement of degradation as well.
2.2.2. Assessment of forest degradation with high resolution imagery
Imagery with higher resolution than Landsat can be used to map local losses of tree cover that result from various types of degradation. For example, logging roads can be readily mapped using Landsat, but degradation associated with canopy gaps of felled trees and skid trails where trees are dragged to roads typically requires imagery of higher resolution (on the order of a few meters). The area affected by these canopy disturbances can accumulate to be many times larger than disturbances associated with tree felling alone (Laporte et al 2007) (figure 3). This is important in the context of REDD+ in order to assess the fuller impacts of degradation on canopy cover and biomass. Use of high resolution (e.g. 5–10 m) optical satellite imagery (such as IKONOS or Quickbird) is helpful for delineating the affected areas, and is a low-technology solution since such imagery can be visually inspected and hand-digitized.
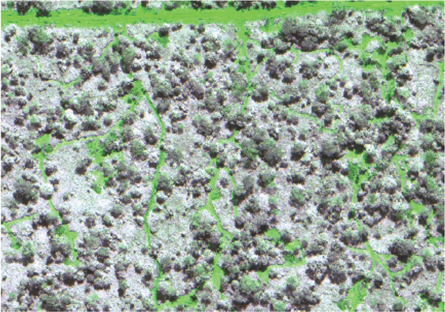
Figure 3. High resolution imagery of selective logging activity in tropical Africa showing canopy gaps from tree felling and skid trails from log dragging. This figure shows the impacts of forest degradation from selective logging are substantially greater than just the area directly affected by logging road development (after Laporte et al 2007).
Download figure:
Standard image High-resolution imageA related variation of this approach is informing finer scale assessments based on moderate resolution imagery (such as Landsat). In the case of selective logging, which targets specific tree species of high value and large size (e.g. African mahogany), loss of tree cover (and diversity) may be small relative to the biomass removal, but canopy cover removal can be substantial and therefore detectable with Landsat (Souza et al 2005). Other types of degradation, such as fuel wood removal, also require higher resolution imagery to detect. As with the case of deforestation, attributing the changes from such land uses and management requires field observations in combination with remote sensing. Currently, the detection of lower levels of carbon stock degradation (<30% biomass loss) using remote sensing is difficult unless based on a combination of field and LiDAR data sets, which means they are currently restricted to relatively small areas where aircraft LiDAR are typically flown (hundreds of km2).
Consistently and accurately mapping most types of forest degradation at regional scales, particularly over short time intervals, benefits from the use of nested multi-scale imagery. This is because the ability to accurately map the area and associated change in carbon stock associated with degradation is, as described earlier, a function of the time period over which the various types of degradation take place. A multi-scale approach, i.e. making use of several data sources at variable resolution, will allow one to increase the ability to detect degradation-related changes in forest cover, while also increasing the likelihood of detecting degradation over shorter time intervals. Like any other approach, this is most effective and accurate when accompanied by appropriate validation efforts and relatively frequent (e.g. annual) repeat measurements. A good example of this type of nested multi-scale approach, making use of a wide range of image data sources, is that being conducted in Guyana as part of a bilateral agreement with Norway11 , which has robust MRV procedures in place.
2.2.3 Assessment of forest degradation using indirect proxies
A quicker and easier but less accurate method to estimate degradation over larger areas is to extrapolate local-scale assessments of degradation using approaches that incorporate more indirect indicators of degradation, such as buffers around or distances from villages and roads (including logging roads) or proximity to previous forest clearing (Potapov et al 2008, Herold et al 2011, GOFC-GOLD 2014). For example, a reasonable estimate of fuelwood removal from a forest area surrounding a group of villages could be obtained by assuming that degradation declines at a constant rate as forests are increasingly remote from villages. Assessing errors in such methods is more difficult than assessing errors based on more direct approaches, but indirect approaches can help approximate degradation and plan more targeted observations (such as high resolution imagery or LiDAR acquisition).
Recent work indicates that a combination of indirect proxies and field observations of the area and carbon stock of degraded lands can provide assessments of emissions associated with forest degradation from both selective logging and shifting agriculture. For example, Pearson et al (2014) used field measurements of changes in carbon stocks in selectively logged areas to estimate the carbon emissions from three different components of wood harvest: the extracted log, incidental damage to surrounding trees, and infrastructure (e.g. logging roads). In contrast, Margono et al (2012) and Zhuravleva et al (2013) linked degradation to remote sensing in the Democratic Republic of the Congo by using Landsat imagery and LiDAR data to quantify structural differences between primary intact, primary degraded and other forests. While these two approaches to estimating forest biomass loss (Pearson et al 2014) and forest cover degradation (Margono et al 2012, Zhuravleva et al 2013) advance what can be done using indirect proxies, extending field measurements of degradation to a national scale benefits from additional, more direct links with remote sensing of biomass losses (and gains) such as those described in the previous section 2.2.2.
Summary: degradation can be assessed using approaches that capture change in canopy cover coupled with measurements of carbon stocks. In this sense measurement of degradation is similar to that of deforestation, but degradation is complicated by biomass gains that can partially or wholly offset biomass losses in the same forest. To simplify this complexity for purposes of REDD+ accounting, one can measure net degradation (including both losses and accumulations) of carbon stock at repeated time intervals. The accuracy of doing so depends on the combined accuracy of field measurements of aboveground stocks, and the sensitivity of remote sensing to the density of those aboveground stocks. Detecting the net effect of gains and losses within areas that remain forest thus benefits from use of high resolution imagery, and can be effectively augmented with field measurements of carbon stock changes as well as the biomass sensitivity conferred by LiDAR measurements. Related approaches make use of proxies of degradation, such as the area of forests that have been disturbed relative to areas that have no record of disturbance in the satellite record.
2.3. Monitoring the 'plus' from regrowth
Removal of carbon from the atmosphere through forest carbon stock enhancement, restoration and regrowth is gaining substantial attention with the advent of REDD+. The 'plus' in REDD+ includes forest regrowth, conservation and management activities. This means that countries participating in REDD+ could be eligible for performance-based payments related not only to reducing emissions by avoiding deforestation and forest degradation, but also for increasing the carbon stocks in existing forests. Here we briefly discuss monitoring regrowth using remote sensing, and the potential for differentiating regrowth and loss in both managed and natural forests. Distinguishing these types of forests is discussed further in section 3.
The measurement need for forest regrowth is similar to that for forest degradation, described earlier, except that the change in forest cover and carbon stocks is in the direction of enhancement. That is, positive change in forest carbon stocks as atmospheric carbon is sequestered over time in biomass. While deforestation is principally a discrete event, and forest degradation is more gradual, forest recovery is typically an even slower process. Monitoring of tree cover gain requires the tracking of regrowth over time before a determination of recovery to a forested state can be established. For example, recovery of forest biomass after selective logging can be substantial. Recent studies of time-series inventory data from logging sites in the Central African Republic revealed significant biomass recovery after disturbance with aboveground biomass rates of recovery proportional to disturbance intensity and recovery of aboveground biomass often greater than 100% after just 24 years (Gourlet-Fleury et al 2013), although 50 or more years is probably more typical for more heavily degraded areas.
A recent global analysis using Landsat imagery between 2000 and 2012 included not only forest losses (refer to figure 1) but also areas of non-forest returning to forest (i.e. forest gains). These maps clearly show forestry landscapes characterized by rapid rotation of plantation or naturally regrowing forests used as crops for timber, pulp, fuel wood and other purposes (Hansen et al 2013). This shows the potential for monitoring reforestation and afforestation mitigation activities, although the maps of regrowth require additional field assessment for validation purposes, and they are already being refined. Nonetheless, this potential also highlights the importance of implementing and monitoring safeguards on distinguishing natural forests from plantations in the context of eligibility for compensation under REDD+ (discussed in section 3.1).
Whereas optical and RaDAR imagery can be used to measure forest carbon stock gains associated with forest restoration and regrowth, additional information is required to capture carbon stock gains associated with growth and recovery within existing forests. This can be partly addressed through longer time series of image data, but it can also be inferred through canopy height and structure information provided by LiDAR measurements. figure 4, for example, shows how repeat-pass LiDAR data acquired from aircraft can be used to document height and biomass change with time. In moist tropical regions, where vegetation regrowth tends to be rapid, one can use the height structure and biomass information to infer age and thus distinguish rotational forestry from somewhat longer-term recovery of forest via natural regeneration and regrowth. The latter areas tend to take longer to reach greater height and biomass density than plantation forestry rotations, and tend to be harvested on a longer rotation cycle.
Summary: monitoring areas where forest regrowth has occurred as part of REDD+ can be done quantitatively using remote sensing imagery, and in fact has been done globally using Landsat imagery. Thus the technology for measuring and monitoring the 'plus' in REDD+ is in place and becoming increasingly operational at a global scale. It becomes more difficult to observe gains in carbon stocks using image data in areas where canopy cover has closed, but change in these areas can be measured with a combination of field and LiDAR data. Monitoring changes in carbon stocks of managed areas, such as forestry operations, also requires the additional information on canopy height and structure that are captured in LiDAR measurements. This capability is not yet available from space, and so likewise not available everywhere across the tropics, but is currently feasible where data are acquired by aircraft, and where associated calibration—validation data are available from field measurements. Significant advances in monitoring regrowth will also be possible when the GEDI LiDAR instrument is installed onboard the ISS.
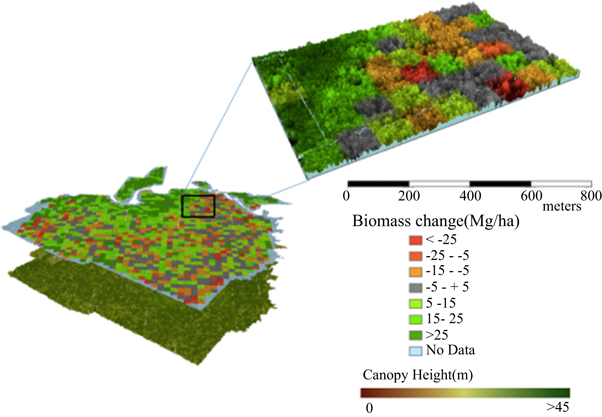
Figure 4. Map of forest carbon stock change distributed across a landscape in Costa Rica as derived from a combination of LiDAR and field measurements (Dubayah et al 2010). While not available everywhere, this map shows the potential of repeated LiDAR measurements for monitoring both carbon stock losses and gains (from Goetz and Dubayah 2011).
Download figure:
Standard image High-resolution image3. Monitoring the safeguards on conservation of natural forests and biodiversity
The Cancun Agreements adopted at the 16th COP in 2010 included environmental safeguards designed to prevent unintended negative consequences from actions associated with maintaining or enhancing forest carbon stocks under REDD+. The safeguard provisions make clear that REDD+ actions should be consistent with the conservation of natural forests and their ecosystem services, e.g. biological diversity, and should not support the conversion of natural forests to plantation forests12 . That said, there is ambiguous guidance as to how individual countries implement such safeguards. We focus our attention here on two of the Cancun Safeguards for which forest monitoring technology is a particularly important consideration: conservation of natural forests and protection of biodiversity.
3.1. Distinguishing natural from managed and plantation forests
The distinction between natural and plantation forests is important because the biological diversity and ecosystem services provided by the two systems differ greatly. For the purposes of monitoring the Cancun Safeguard on conservation of natural forest, maps are needed that distinguish long-lived natural forest cover from managed tree plantations. Such maps, routinely updated, would allow identification and attribution of cases where forests are replaced not only by grazing land or crops, but also industrial oil palm or eucalyptus plantations. Several natural or 'primary' forest data sets exist, the best known being INPE's PRODES representation of intact and degraded natural forest that is annually reduced in extent as these forests are cleared and converted to other land uses. The primary forest layers provided by Observing by Satellite the Forests of Central Africa for the Republic of Congo and Democratic Republic of Congo (osfac.net) is a similar data source (Potapov et al 2008). In Indonesia, a primary (undisturbed) forest layer has recently been published and used to document Indonesia's increased clearing of primary forest (Margono et al 2014). Such layers represent the high-value conservation forests that remain, and are thus of significant interest to REDD+ monitoring objectives.
The body of literature addressing the identification and monitoring of plantation forest extent and change through time using remote sensing has to date been relatively limited, but several advances have made such monitoring more feasible. Managed plantations such as those of oil palm, acacia, or eucalyptus tend to be characterized by rapid canopy closure within just a few years of plantation establishment. With increasing canopy maturity, they can appear quite similar spectrally (i.e. in terms of foliage density) as well as structurally (i.e. in terms of size, shape, and orientation of foliage, branches and stems) to that of secondary and other tropical forest types (Morel et al 2011, Gutiérrez-Vélez and DeFries 2013). As a result, remote sensing of managed forests has mostly relied on manual, operator-intensive methods (e.g. visual interpretation of imagery) to ensure accurate stand identification and area delineation. More automated approaches have been advanced by emphasizing multi-temporal (i.e. time series) and multi-sensor (e.g. RaDAR-optical-LiDAR) data fusion techniques, as we briefly describe here.
3.1.1. Moderate resolution time-series imagery
Given rapid growth in the commercial oil palm industry across the tropics, particularly in Indonesia, the vast majority of remote sensing research to address the monitoring of plantation forests has focused on the conversion of natural forest to oil palm plantations. Oil palm thrives in regions otherwise occupied by dense humid tropical forest, which means regions that are also frequently obscured by heavy cloud cover. Hence, sensors such as Landsat (30 m) and MODIS (250 + m), which provide for relatively frequent image acquisitions (e.g. nominally every 16 days for Landsat and daily for MODIS) and so have a greater likelihood of capturing cloud-free imagery, are useful for one-time mapping as well as longer-term change monitoring. For example, Carlson et al (2013) used visual interpretation of Landsat time-series data to assess carbon emissions from oil palm plantations in Kalimantan, Indonesia, over a 20 year period (1990–2010). Where image coverage overlapped, oil palm detected with Landsat was confirmed using high-resolution optical data available in Google Earth and/or RaDAR imagery, in this case from the Japanese Advanced Land Observing Satellite (ALOS).
In another recent example, Gutiérrez-Vélez and DeFries (2013) assessed the tradeoffs between spatial and temporal resolutions among different satellite sensors to map oil palm expansion from 2001 to 2010 for the Peruvian Amazon. This analysis automatically classified MODIS time-series data to map annual forest conversion to oil palm for events larger than 50 ha with an accuracy of 73% at 250 m resolution. Total forest conversion to oil palm (939 204 km2) was subsequently calculated in annual time steps based on visual delineation of Landsat images. Analyses were also conducted using a combination of Landsat and ALOS RaDAR data (both at 30 m resolution) within a subset of the area (2158 km2) for conversions larger than 5 ha with an accuracy of 94%. The data and approaches used for these studies of oil palm are applicable to other plantation forests, such as eucalyptus.
3.1.2. High resolution imagery
As more high-resolution imagery is acquired and archived, monitoring the conversion of natural forests to plantations with such imagery can become more routine, as can larger area assessments of the kind now only practical with moderate-resolution imagery. A number of countries, such as Mexico, are systematically acquiring high-resolution imagery (e.g. 5 m resolution imagery) for the purpose of producing detailed classifications of land cover including the discrimination of natural versus managed lands (see figure 5). Because high resolution imagery can be expensive and quickly adds up to large volumes of data, using it routinely to map large areas (1000s of km2) requires the availability of significant computing and processing capabilities. With increasingly more powerful computers the former issue is generally being overcome; however, consistent data processing of large data volumes requires systems that can properly address cloud cover, calibration and many other issues that arise among adjacent scenes through time.

Figure 5. High resolution image from Indonesia showing the ability to discriminate plantation from primary forest, as well as recently deforested areas.
Download figure:
Standard image High-resolution imageAs described above, these issues are more easily overcome with moderate resolution imagery (i.e. Landsat and MODIS), but are increasingly available for application to higher resolution data sets like those being used in Mexico and elsewhere. With the advent of constellations of 'micro-satellites', including the recent acquisition of Skybox by Google (www.skyboximaging.com) and the launch of Planet Labs (www.planet.com), these challenges are increasingly likely to be overcome in the near term (next few years) rather than decades from now. Moreover, taking advantage of platforms like GoogleEarth allows users in many parts of the world with limited computational infrastructure to conduct their own interpretations using high resolution imagery, as long as they have reliable internet access.
Summary: using multi-sensor data sets that combine the advantages of each data source allows accurate discrimination of oil palm plantations from natural forests, and thus the ability to monitor the extent of plantations and the associated conversion of natural forests to plantations. Because many oil palm plantations are large (hundreds of hectares), moderate resolution imagery like that of Landsat and even coarser resolution MODIS is often adequate for mapping and monitoring plantation forests relative to natural forests, as well as the conversion of the latter to the former. Higher resolution imagery is becoming increasingly more common, with some countries acquiring 'wall to wall' mapping of their forested lands, and these data provide additional accuracy in mapping plantations and the conversion of natural forests. While high resolution image analysis of large areas requires greater data storage, computing and processing capacity to ensure continuity of mapping efforts, these capabilities are rapidly advancing. Also, such imagery will continue to become more readily accessible via web platforms such as GoogleEarth, and can be relatively easily interpreted visually by trained technicians, so use of this technology is accessible to countries with varied levels of technical capacity—particularly for more local mapping efforts.
3.2. Plant and animal diversity within forests, and changes through time
Because conservation of natural forests is synonymous with the conservation of biological diversity of forest species, both plant and animal, there has been substantial effort through the UNFCCC and other forums to ensure biodiversity safeguards are included in REDD+ initiatives. Although the current UNFCCC articulation of the social and environmental safeguards remains general13 , operational guidelines for applying biodiversity safeguards in REDD+ have been proposed by the United Nations Environment Program's World Conservation Monitoring Center (UNEP-WCMC) (Epple et al 2011). These guidelines affirm the importance of spatial information, such as that conveyed by remote sensing observations, as an important component of biodiversity assessments. They also recommend a number of key elements that should be incorporated into mapping and monitoring protocols, as capacities permit, including the identification of high conservation value areas, distributions of priority and indicator species, and types of natural forests and ecosystems. Targeting the areas with both climate change mitigation potential (i.e. avoided emissions) and high biodiversity value would help to meet REDD+ co-benefit objectives. That is, the idea behind these efforts is not only to minimize potential conflict between REDD+ priorities and biodiversity conservation priorities, but to leverage the opportunity that REDD+ provides to harmonize priorities and thereby maximize the multiple benefits of forest conservation (e.g. Parrotta et al 2012).
There is thus an opportunity to achieve both climate change mitigation and biodiversity conservation by better preserving and protecting forest habitat. Positive synergies can be captured in the geographic locations of specific REDD+ forest conservation efforts, but these can also be extended many-fold when existing protected areas are connected. Recent efforts have suggested these connections can be established with corridors that traverse high carbon stock areas, and the corridors can be prioritized for REDD+ by considering their vulnerability to deforestation and their relative expense to conserve (e.g. with respect to foregone opportunity costs of other uses, like agriculture) (Jantz et al 2014). The value of such an approach is accounting for multiple criteria (carbon stocks, biodiversity deforestation threat, conservation expense) to prioritize specific locations where the implementation of REDD+ would not only achieve climate change mitigation objectives, but also safeguard biodiversity well into the future by keeping protected areas connected and allowing species to migrate.
With the advent of REDD+ as a mechanism for funding climate change mitigation in developing countries, as well as conservation and sustainable management, the UNFCCC hopes to align protection of forest carbon and biodiversity, while maintaining their provision of ecosystem services14 . A first step in meeting the objective of climate change mitigation and biodiversity conservation co-benefits is to document the diversity of areas that are priorities for avoiding emissions (i.e. areas of high carbon stocks/emissions potential, described in section 2). Being able to identify the diversity of these areas, by linking field surveys with remote sensing of habitat characteristics beyond cover and type, such as canopy vertical structure information, would augment the broad scale data sets on species richness and endemism distributed by the UNEP-WCMC, the International Union for the Conservation of Nature (IUCN15 ) and Birdlife International16 . Here we briefly touch on remote sensing capabilities for mapping tree species diversity, and then the links between unique forest habitat characteristics and animal species diversity.
3.2.1. Distinguishing forest trait diversity with remote sensing
Characterizing the tree species diversity of forests, understood here as the number and distribution of individual species or assemblages of species, was considered beyond the capability of remote sensing technologies until relatively recently. Tropical rainforests present a particularly unique challenge given the large number of species per unit area together with high structural complexity (e.g. number of different shapes and sizes of trees) and spatial heterogeneity (i.e. number of species within tens of square meters or less). Recent advances in remote sensing of tree reflectance spectra combined with canopy structure from lidar has changed our view of what is possible in terms of mapping aspects of biodiversity (e.g. Leutner et al 2012). As with approaches to measuring and monitoring forest cover and carbon stocks, these approaches to mapping patterns of forest traits and canopy chemistry can be divided into so-called direct approaches capable of detecting the individual tree diversity or communities themselves, and indirect approaches that depend on proxies such as environmental characteristics (i.e. aspect, elevation, soil type, etc) or physical structural features (e.g. tree height, crown size, etc).
Technologies to measure and monitor forest biodiversity in tropical ecosystems have advanced rapidly as a result of the evolution of new sensor classes including LiDAR and hyperspectral remote sensing, with the latter also known as imaging spectroscopy. Whereas LiDAR is capable of characterizing forest biodiversity based on detailed measurements of canopy three-dimensional structure (Bergen et al 2009), imaging spectroscopy sensors are capable of sensing the canopy's chemical and physiological properties or 'fingerprints' of plant spectra (Asner et al 2015). Imaging spectroscopy is currently operational onboard both airborne and satellite remote sensing platforms. However, because satellite sensors provide only moderate resolution data (Hyperion: 30 m; CHRIS: 17 m) and both air- and satellite acquisitions are generally only available to researchers on a geographically limited basis, the overall utility of these data for detailed species-level mapping across large areas remains limited. As a result, and because a number of studies have successfully demonstrated the potential of imaging spectroscopy in a variety of environments (Schimel et al 2015), there are ongoing efforts to advance our capability to distinguish and map forest canopy chemistry and trait diversity from a spaceborne platform at high resolution.
3.2.2. Canopy habitat links with animal diversity
Being able to more directly map the distribution patterns of animal species diversity would provide additional REDD+ benefits of ensuring biodiversity conservation (e.g. of threatened and endangered species). Animal diversity distributions have been estimated using field surveys, often rapid assessments, linked with vegetation type maps, climate and other environmental variables to extrapolate over larger areas. Valuable global biodiversity data sets distributed by the IUCN, UNEP-WCMC and Birdlife International, among others, are based on this approach. In addition, one of the best-known proxies for forest species diversity is canopy habitat and three-dimensional canopy structural diversity (i.e. the horizontal and vertical distribution of canopy elements), particularly for arboreal species like birds and primates (Davies and Asner 2014). Canopy structure data sets have not been widely available before but with the advent of LiDAR remote sensing, these data are now much more widely and consistently available than was possible from limited field studies. A number of studies have shown the utility of airborne LiDAR data for predicting not only bird richness (Vierling et al 2008) but also individual species preferences and competition for specific habitats and nesting locations (e.g. Goetz et al 2010). Thus characterizing multi-dimensional habitat heterogeneity with remote sensing, particularly LiDAR coupled with field observations, is extremely useful for identifying and mapping biodiversity patterns.
Summary: the state-of-the-art in species-level mapping and monitoring of subtropical and tropical forest ecosystems combines the spectral sensitivity of imaging spectroscopy with the canopy structural sensitivity of LiDAR measurements. This combination provides for unprecedented discriminating power in three dimensions, improving upon the information that either sensor type is capable of providing alone, and thereby also providing capability to map tree composition, animal species richness, habitat diversity and use, and changes in these ecosystem attributes through time. These data will not be available everywhere but they provide valuable information on the biodiversity of forests that is useful for REDD+ safeguards by augmenting what is currently available more generally around the globe.
4. Monitoring to support policies and measures to reduce deforestation
The UNFCCC rules for REDD+ largely leave decisions about how to reduce deforestation up to individual countries. Monitoring technologies can help countries reduce deforestation in a variety of ways. For example, they can help attribute deforestation to particular land uses or industries, suggesting targeted policies that can address the proximal and ultimate causes of deforestation and forest degradation. Furthermore, high-frequency deforestation alert systems can assist law enforcement agencies (EAs) in enforcing forest laws. We can only briefly address these issues here and so encourage interested readers to follow up with some of the literature we cite.
4.1. Analyzing the drivers of deforestation
In order to reduce deforestation it is useful to understand who or what is responsible for deforestation. The UNFCCC encourages public and private actors to take actions to reduce the drivers of deforestation, but this is not a requirement in the same way that RLs, MRV, and safeguards are required. Forest monitoring technologies can assist in identifying drivers17 of deforestation in at least four ways, briefly described below: distinguishing anthropogenic from non-anthropogenic forest loss; directly attributing forest loss to particular owners or forest users based on ownership or use maps; attributing forest loss to particular land uses or industries based on remote sensing signatures; and assessing the relative contributions of multiple causal factors using econometric techniques.
4.1.1. Distinguishing anthropogenic from non-anthropogenic forest loss
Because REDD+ is a pay-for-performance mechanism, it is important to distinguish between anthropogenic (i.e. of human origin) and non-anthropogenic (i.e. natural) causes of deforestation. This allows agencies in forest countries to penalize (or reward) the emission (or sequestration) of carbon resulting from management activities but not those resulting from natural processes. In the tropics, most clearing is the result of human action on the landscape, but there are also natural changes resulting from wildfires, wind storms or other causes. A recent example attributing deforestation from natural versus anthropogenic causes in Peru (Potapov et al 2014) nicely demonstrates the potential of distinguishing these different causes using remote sensing, as well as the value of close partnerships between the policy and research communities (see also Pelletier and Goetz 2015).
Natural and human causes of fire also interact, for example where degraded forests may have more fuel conducive to carrying fires initiated from a natural cause (like lightning). Proximate causes of human-induced forest loss include mechanical removal of vegetation and the intentional setting of fire, both of which are often employed in the clearing of tropical forests. Natural processes like drought also exacerbate the likelihood of fire. Thus identifying the direct cause of forest disturbance would improve carbon emissions estimations and their attribution to human or natural origins.
Remote sensing of fire disturbance is well advanced and routinely used in a number of temperate countries for fire management efforts. Aside from 'hotspot' detection of fires and burned area delineation (using MODIS and Landsat) (e.g. Justice et al 2002, Boschetti et al 2010), remote sensing of fire disturbance in the tropics has focused largely on direct fire event emissions into the atmosphere (Giglio et al 2013) or the proximity of fire events to populated areas and roads (Kumar et al 2014). Using frequent repeat remote sensing can often assist in identifying the sources of different disturbance types, given timber harvest, forest cutting for shifting agriculture, and other forest conversion and degradation processes have unique patterns on the landscape. However it is usually necessary to inform remote sensing of these patterns with additional ancillary information, such as the indirect methods discussed in sections 2.2.3 and 3.1.
4.1.2. Attributing forest loss to particular land uses or owners
To the extent it is possible to distinguish the land use to which previously forested land is converted, attribution to particular land uses, owners or industries can be made. As noted in the previous section, it is often possible to match patterns of deforestation with obvious indication of human activity, such as extension of roads into the affected areas. When available, data on land ownership and land use rights can provide additional information on the probability of accurate attribution to human drivers as agents of change. A nice example of this approach is Killeen et al (2008) documenting land transformations by different social and economic groups in Bolivia over multiple decades.
Land use in recently deforested or disturbed areas can also be discerned by statistically relating (regressing) the patterns and the texture of the land surface to areas where deforestation and degradation has already been attributed to human land use (e.g. pastoralists and shifting agriculture). Data from observational platforms such as Landsat are a prerequisite to these efforts.
4.1.3. Assessing the relative contribution of multiple causes of deforestation
Where multiple causal factors contribute to deforestation, statistical techniques can be used to assess their relative contributions and suggest promising interventions. These techniques, termed spatially explicit econometrics, analyze the relationship between spatial patterns of deforestation and maps of potential driver variables (Ferretti-Gallon and Busch 2014).
4.2. Law enforcement
Forest policy implementation often requires law-enforcement activities. There is a wide range of forest monitoring technologies that can assist forest law enforcement. We touch on two of them here; one from Earth observing satellites in space and one based in monitoring devices deployed in situ, in the forest environment.
4.2.1. Deforestation alert systems
Sensors that can detect hotspots of forest-cover change activity on a frequent basis can be used to target law-enforcement actions. For example, INPE's DETER program detects, in near-real time, clearings within the Brazilian Amazon. DETER data have been used to support enforcement of land use regulations by prosecuting illegal deforestation. The system was launched in May 2004 and has been instrumental in allowing rapid reaction to signs of deforestation and thereby reducing emissions associated with such activities (figure 6) (Arima et al 2014). Monthly alerts are generated by INPE and sent to the EAs at the federal and state level, including IBAMA (the Brazilian Institute of Environment and Renewable Natural Resources). Based on this information the EAs can define priority areas for action in the field as well as refine the process of distinguishing legal and illegal deforestation.
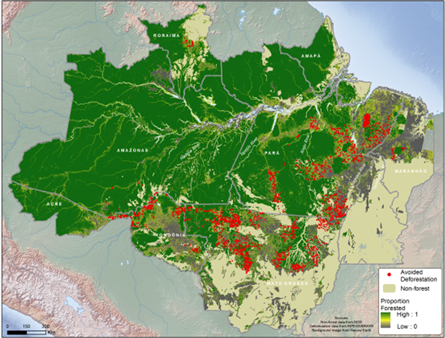
Figure 6. Avoided deforestation in Brazil between 2009 and 2011 attributed to alert and enforcement efforts based on rapid-response satellite remote sensing of forest conversion (after Arima et al 2014).
Download figure:
Standard image High-resolution imageBecause the DETER data and maps are made publically available via the internet, the program has allowed other institutions to develop their own monitoring systems, such as System of Alerts on Deforestation (SAD) from IMAZON (Amazon Institute of People and the Environment). This transparency also decreases the potential for corruption since available data allow investigation of illegal activity by all interested parties. The DETER and SAD systems have the potential to be extended to the entire humid forests of the tropics as part of the FORest Monitoring for Action (FORMA) program, launched in 2014 but developed and tested for years earlier (at the Center for Global Development and the World Resources Institute). FORMA is now part of the Global Forest Watch effort (see section 2.1).
Brazil's DETER system, and the extension of it to other tropical forest areas via FORMA, are based on data from NASA's MODIS sensors, which acquire relatively coarse spatial resolution imagery but with high frequency (i.e. 250–1000 m data acquired daily). This high-temporal acquisition frequency provides the most rapid update of the land surface currently available while increasing the probability of cloud-free acquisitions. MODIS thereby provides the ability to detect deforestation associated with many human activities, such as the expansion of frontiers of deforestation, soy agriculture, and other activities.
The best use of MODIS for forest monitoring is as an alarm or indicator of larger 'hotspots' of forest loss rather than to calculate specific changes in forest area. This is because the moderate spatial resolution of MODIS is somewhat limited for observations of forest cover loss because forest disturbances often occur over areas that are smaller than MODIS pixels (i.e. sub-pixel scale). Landsat, RaDAR and other higher resolution data sources can then be used to establish specific measurements of forest loss in the affected areas. Using these systems together, along with other data sources, is a powerful means to enforce policies. Moreover, because MODIS acquires data more frequently than Landsat, it can be used to determine the timing of deforestation, which can be important in some cases for attributing change to human versus natural causes. Recently, an updated version of DETER (called DETER-B) was developed using higher resolution imagery from Landsat and the Brazilian AWIFs system, rather than the 250 m MODIS imagery (Diniz et al 2015). The updated system allows detection of areas smaller than 25 ha and has improved accuracy resulting in more efficient enforcement action.
4.2.2. In situ monitoring
Another set of technologies that can aid detection of illegal activity and enhance enforcement activities is in situ monitoring devices. These include motion-detection cameras and audio devices that can detect the sound of chain saws (from logging) and gun shots (from poaching). Motion activated cameras are now widely used for wildlife monitoring, but also have utility for detecting illegal logging, particularly when installed to image larger areas (e.g from high in a forest canopy). Audio detection and alert transmission systems have been in development for a number of years and some make use of proven technology that is widely available (e.g. wildlandsecurity.org). Related recent efforts make use of discarded cellular telephones for detecting audio signals and then transmitting alerts to enforcement authorities or conservation groups18 . These techniques are likely to become more readily available and so available for broader adoption.
Summary: the distinction between forest change attributable to human activity versus natural processes is advanced by systematic remote sensing of forest conversion though time, and by incorporating additional data sources to make attribution more reliable. It is often possible to infer attribution using remote sensing based on patterns across the landscape unique to timber harvest or plantations, as well as proximity to the expansion of roads and towns, coupled with local knowledge and field observations. Detection systems that make use of frequent satellite observations to identify hot-spots of change are also valuable for attribution and are used to alert EAs to deforestation and to deter illegal operations, with Brazil having the most advanced capabilities for this type of near real-time monitoring. Related capabilities that help with enforcement include in situ motion cameras and audio sensors that are triggered by potentially illegal activities. These detection and alert systems have had a measurable impact on reducing deforestation related emissions and associated illegal land conversion in Brazil. Similar systems can be implemented in other countries by learning from and building upon these advances.
5. Emerging trends
In addition to the progress described thus far, there are exciting new advances in remote sensing technology and monitoring capabilities that are already underway. Currently there are missions that will launch within the next 5 years that will install a LiDAR instrument on the ISS and two RaDAR satellite missions in different wavelengths (L- and P-band). The combination of these missions will be particularly useful for mapping forest biomass more accurately and also for better capturing the timing and magnitudes of change in aboveground carbon stocks. Assessment of changes in forest cover will be continued from the current MODIS data series into the future using the VIIRS (Visible Infrared Imaging Radiometer Suite) instruments onboard the Suomi satellite and eventually by a series of planned Joint Polar Satellite Systems, as well as the European Sentinel satellite series and continuation of the US Landsat series. There are also previously mentioned micro-satellite systems (Skybox, PlanetLabs) that are likely to rapidly proliferate in the commercial value-added remote sensing domain. When combined, these missions will substantially and significantly advance our ability to measure, monitor, report and verify REDD+.
5.1. Mapping biomass change directly
Recent developments in estimating carbon stock density with combined field and aircraft LiDAR, as well as demonstrations of satellite LiDAR, indicate it will soon be possible to routinely and remotely measure changes in forest carbon stock directly. This will continue to require calibration and validation with field measurements, but it is significant and will be transformational because it means we can systematically monitor aboveground carbon stock changes, and their associated emissions or sequestration, even if they are not associated with changes in forest area. Although the definitions of forest and deforestation can be arbitrary (20% tree cover is often assumed to be an appropriate cut-off for defining forest), direct measurement of carbon stock provides a continuum of densities rather than a small number of different classes. In theory there is no threshold cut-off and no need for definitions of forest or deforestation. What matters is the change in carbon stock, whether it results from deforestation, degradation, or regrowth.
Indeed, the synergistic measurement of change in density suggests that a new approach for calculating emissions may be appropriate, i.e. no longer assigning a carbon density to a change in forest area, but rather applying a more direct estimate of change in carbon stock density. The approach will make use of space-based LiDAR and RaDAR missions, sensitive to changes in three-dimension canopy structure, measured at much higher sampling densities and with higher accuracy that any previous observational system. The BIOMASS mission of the European Space Agency is developing a RaDAR long wavelength (P-band) system that enables penetration through dense forest canopies and does not saturate at moderate aboveground biomass densities (∼50 MgC/ha) as other RaDARs do. The NISAR mission underway jointly with NASA and the Indian Space Agency will provide L-band RaDAR satellite that will complement and significantly augment the capabilities of the L-band Japanese ALOS-2 launched in 2014. When combined with the new mission to install a LiDAR sensor onboard the in ISS, these will substantially advance our capability to map aboveground biomass and canopy structure changes from current reference baselines into the future.
5.2. Direct measurement of carbon fluxes from forests
The launch of the Orbiting Carbon Observatory (OCO) in early 2014, which measures gas concentrations in the atmosphere and enables fluxes to be estimated, will provide an independent assessment of terrestrial fluxes of carbon to and from the atmosphere. The spatial resolution of OCO is coarse (hundreds of km2), but the frequency of repeat measurements (every 16 days) may allow for seasonal estimates of carbon flux at national scales. The estimated fluxes will include those from all pools of carbon (living biomass, dead biomass, aboveground, belowground, and soil). They will also include the effects of both management and natural processes. The data will not likely be appropriate for national REDD+ reporting purposes but they will be useful as an independent check on full carbon accounting at a regional level.
5.3. Measurement of habitat and biodiversity
In terms of biodiversity applications and safeguards, the technologies now available for mapping the types and trait composition of tropical forests are maturing and new spaceborne imaging spectroscopy sensors are expected to overcome or greatly reduce the limitations (i.e. data cost, access, coverage) that currently constrain the use of these data. Examples of near-future satellite sensors include the US Hyperspectral Infrared Imager (HyspIRI, with 210 spectral bands) slated for launch within a decade and the German Environmental Mapping and Analysis Program (EnMAP; 242 spectral bands) slated for launch in 2017. These will be complemented by the new satellite LiDAR and RaDAR missions described above, as well as others in development, which together will dramatically improve our ability to monitor not just forest composition but also the multi-dimensional aspects of forest habitat that support biodiversity across the tropics and around the globe.
Each of these emerging trends, and others that are beyond the scope of what we can cover here, will continue to not only advance technological capabilities but also the transfer of those capabilities to the operational realm. This transition includes more than just making data sets and validated measurements available more widely, even though that alone has dramatically advanced over what was possible just a decade ago (see Romijn et al 2015). Technology transfer and transition to the operational realm has to occur hand-in-hand with capacity building efforts, which will take time, and will likely be incremental and geographically uneven. Nonetheless, the transition is already proceeding apace and should be embraced as an essential component of monitoring systems required for effective climate change mitigation and safeguarding the multiple benefits of forest conservation.
6. Conclusions
Satellite-based technologies to monitor forest cover and biomass density (i.e. carbon stocks) have advanced tremendously in recent years. The state of the science on forest measuring and monitoring is now sufficiently mature to meet operational REDD+ needs for MRV and RLs. For some other areas of importance to REDD+, such as monitoring for biodiversity safeguards, the techniques are not currently operational but the science is rapidly advancing (see figure 7).
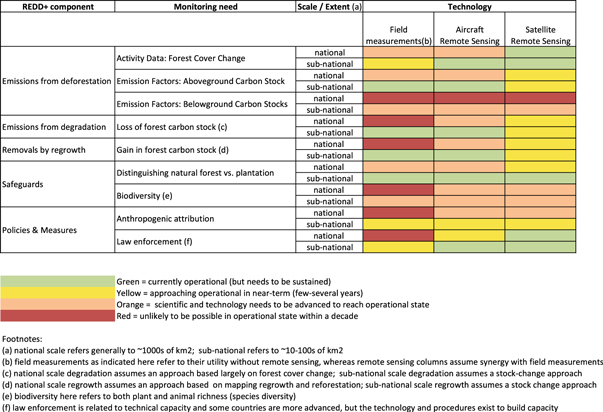
Figure 7. The state of the science on forest measuring and monitoring has matured to meet a range of operational REDD+ needs. This table summarizes our view of the current state of readiness, as assessed herein, and identifies areas where there are limitations to current capabilities. We emphasize prioritizing capabilities that can be gained by synergies between the technology sources, recognizing that capabilities will not be available everywhere and will be uneven geographically depending on internal technical capacities and available resources.
Download figure:
Standard image High-resolution image
Here we have presented an overview of the current state and near future potential of capabilities for measuring and monitoring deforestation, forest degradation, and associated carbon stocks and emissions. We also addressed, in somewhat less depth, some of the safeguards on biodiversity and ecosystem services that are being advanced through the REDD+ negotiations.
Our primary focus was the operational status of approaches that deliver MRV and other technical needs for REDD+ that are relevant on a wide scale (national, region, sub-national) but at the same time deliver intensive characterization of smaller areas (including use of field inventory measurements). In all cases, the overarching objective is focused on repeatable measurements that are consistent over time and transparent for the purposes of systematic monitoring, as outlined in the Warsaw agreement19 and other UNFCCC decisions discussed herein.
A mix of remote sensing and field measurements is necessary for REDD+ reporting purposes. Remotely sensed data enable large area mapping and monitoring of forest cover and change at regular intervals, providing information on where and how changes are taking place at bi-annual or even annual time scales. Field data provide a basis for linking to remote sensing and thereby extending measurements to much larger areas (e.g. national scales). Land satellite (Landsat) data sets in particular are routinely used to measure and monitor forest changes over time, providing operational monitoring of deforestation used in a number of national programs.
The second key component required for REDD+ is the estimation of emissions associated with the conversion of forested lands to other land uses. This requires measurement of carbon stock density, or emission factors in IPCC terminology. Because carbon density varies spatially, the quantity of carbon lost to the atmosphere due to deforestation is dependent on the specific forest areas that have undergone change. Tropical forests have a wide range of carbon content and thus have a wide range in their potential for mitigating emissions from deforestation and degradation.
Calculating emissions from degradation is more difficult than calculating emissions from deforestation because degradation happens at finer scales (albeit not necessarily smaller areas), and because removal and regrowth of trees often take place at the same time. Therefore multi-scale imagery is useful to consistently and accurately map degradation, particularly over short time intervals. Degradation can be assessed using approaches that capture change in canopy cover coupled with field measurements of carbon stocks, or more synergistically via field data calibration of remote sensing maps of stock changes through time.
Regrowth of forest carbon stocks, associated with forest restoration and sustainable management of forests, is part of REDD+ and lately gaining substantially more attention. The measurement need for forest regrowth is similar to that for forest degradation except forest cover and carbon stocks increase through time. Landsat satellite data are capable of detecting regrowth through time, and LiDAR data are particularly useful for measuring, mapping and monitoring the carbon stocks associated with forest growth and recovery (as well as forest degradation). Some of the approaches are useful to monitor other land-based mitigation activities already implemented in the Clean Development Mechanism of the Kyoto Protocol, including reforestation and afforestation.
Environmental safeguards are designed to prevent unintended negative consequences from actions associated with maintaining or enhancing forest carbon stocks under REDD+. Remote sensing can and has been used to unambiguously distinguish long-lived natural forest cover from managed tree plantations, in order to monitor safeguards on conservation of natural forest and the ecosystem services they provide and the biodiversity they support. Given rapid growth in the oil palm industry across the tropics, remote sensing has been used to monitor natural forests and to track the expansion of plantations. As more high-resolution imagery is acquired and archived, monitoring the conversion of natural to managed and plantation forests becomes more accurate, as does larger area assessments of the kind now only practical with moderate-resolution imagery (e.g. Landsat).
Biodiversity safeguards can also be informed by directly detecting and characterizing the diversity of tree species within forests, as well as indirectly assessing animal diversity by the habitat characteristics of the forest. Until recently these capabilities were considered beyond the capability of remote sensing technologies, but we discuss how they have advanced rapidly in the past decade. Maps of local variation in patterns of species diversity provide a basis for prioritizing and managing lands to promote conservation (e.g. of threatened and endangered species or ecosystems), while also mitigating additional climate change that would alter species' distribution patterns in the future. The state-of-the-art in species-level mapping and monitoring of subtropical and tropical forest ecosystems combines high spectral sensitivity with high canopy structural sensitivity (e.g. canopy height variability). These capabilities are not currently available everywhere but will become increasingly more available with a rapid transition underway from research and development to 'off the shelf' systems and a greater number of commercial data providers competing for business.
Finally, in the context of policies and measures for achieving REDD+, it may be useful to distinguish between natural and anthropogenic (i.e. of human origin) causes of deforestation and forest degradation, and to distinguish the land use to which previously forested land is converted in order to attribute changes to human activity. The distinction between emissions attributable to management and emissions attributable to natural processes enables law enforcement activities. Deforestation alert systems can identify human sources and detect illegal logging activity. Brazil's DETER program is an example where regular monitoring has made it possible to identify forest conversion within the Brazilian Amazon and to enforce regulations by prosecuting illegal deforestation.
Current and near future remote sensing systems provide for continuity of forest measurement and monitoring capabilities for REDD+ as well as additional essential information to ensure safeguards are met (figure 7). Remote sensing, when coupled with forest inventory measurements, provides essential information that has and will continue to improve our collective ability to conduct monitoring, reporting and verification of the many dimensions of REDD+. Many of these capabilities are already operational in a number of tropical nations participating in REDD+. In the next few years these capabilities will advance even more rapidly and be implemented even more broadly. Investments in human resources associated with use of these technology advances will ensure this broader implementation takes place as rapidly as possible, and where it is most needed.
Summary: state of science and technology on forest monitoring needs for REDD+.
Globally consistent maps of forest cover loss based on Landsat at 30 m resolution are freely available online. These data are being regularly updated and improved, and can be made more relevant for national reporting by combining with country-specific information (e.g. from forest inventories and aircraft data).
Pan-tropical maps of aboveground forest carbon stocks at 500 m resolution are freely available online and are rapidly being improved in spatial resolution, global scope, and time series. These data can be made more relevant for national reporting by combining with country-specific information (e.g. from forest inventories and aircraft data). Combined aircraft and field measurements can produce maps of forest carbon stock within countries at high resolution.
Belowground forest carbon stocks can be extrapolated indirectly from aboveground carbon stocks using published ratios, combined with other data (topography, wetland maps). Remote sensing appears unlikely to be able to directly map belowground carbon stocks in the near future. Estimates of carbon emissions released by the degradation of peat soil would benefit from continued research.
Forest carbon stock loss can be measured at the plot scale using inventory data and within countries using aircraft. These data can be extended globally using moderate resolution satellites (e.g. Landsat). In 2018 space-borne LIDAR will enable globally consistent time series of forest stock losses using densely sampled 23 m resolution data.
Maps of forest cover gains have been estimated globally at 30 m resolution based on satellite. Carbon stock gains within forests that have not undergone disturbance can be measured within countries using a combination of aircraft and inventory data, but not yet systematically at national scales. In future space-borne LIDAR will enable globally consistent time series of forest stock gains.
Natural forests can be distinguished from plantations within countries using human visual classification of high or moderate resolution imagery. Automated algorithms have been developed in some places and are being improved for global use.
Many maps of plant and animal species distributions exist based on biological and environmental information. Spatial variability in the biodiversity of forests can be proxied by aircraft or satellite-derived estimates of forest cover and density, and will be improved with the development of LIDAR and RADAR measurement of three-dimensional canopy structure. Remote sensing technologies have been used to directly map canopy traits but cannot yet directly map animal species diversity.
Biweekly deforestation alert systems based on moderate-resolution satellite (MODIS) are enabling law enforcement in Brazil through its DETER system. Global deforestation alert systems (e.g. FORMA) can be adapted for law enforcement in other countries or used by independent monitors.
Acknowledgments
We acknowledge the Center for Global Development for supporting production of an earlier version of this review, as part of their Why Forests? Why Now? Series, to assist policymakers understand the degree to which measurement and monitoring needs for REDD+ can be achieved with technologies that are currently available or will soon become available. We also acknowledge support from the NASA Carbon Cycle Science and Applied Sciences Programs (SERVIR grant NNX12AL27G). We thank Frances Seymour for initiating and encouraging the review, and helpful critiques from Marc Steininger, Fred Stolle, Alex Lotsch, Naikoa Aguilar-Amuchastegui, David Wheeler and Johanne Pelletier on earlier drafts. We also thank the anonymous reviewers for their constructive comments and suggestions.
Appendix: selection of articles and rules of evidence.
Articles included in this review were identified through a variety of means. Publications were initially acquired and screened through a broader systematic review process described in detail by Petrokofsky et al (2012). In the years following that effort additional publications, both peer-reviewed and otherwise, were identified through Google Scholar and Web of Science alerts using keywords focused on use of remote sensing to estimate deforestation, degradation and carbon stocks. Additional alerts identified recent articles that cited a subset of the previously identified publications (typically synthesis papers). For content that we addressed here which was not part of the review process described by Petrokofsky et al (2012), such as monitoring for safeguards (section 3) and monitoring to support policies (section 4), we relied on targeted searches specific to those topics, using the same search engines. In all cases we relied on expert knowledge of the authors as well as the reviewers identified in our acknowledgments to identify and assess the evidence. In all cases we tended to weight more heavily those papers that included error and uncertainty analysis. We also tended to use papers we considered exemplary or synthetic on a given topic. As in any review synthesizing a diverse range of evidence on a wide array of topics, there is some element of quality assessment that is not well quantified, thus the views presented here—particularly those on the state of technology readiness—are those of the authors alone based on what we deemed the best available evidence.
Footnotes
- 5
A decision in 2009 at the 15th COP in Copenhagen (paragraph 71(c) of Decision 4/CP.15) recognizes the establishment of robust and transparent national forest monitoring systems and, if appropriate, subnational systems as part of national monitoring systems, that use a combination of remote sensing and ground-based forest carbon inventory approaches for estimating, as appropriate, anthropogenic forest-related GHG emissions by sources and removals by sinks, forest carbon stocks and forest area changes.
- 6
These documents summarize IPCC guidance on MRV in substantial detail.
- 7
- 8
- 9
- 10
The UNFCCC defines deforestation as the permanent conversion of forest land to non-forest land.
- 11
- 12
Decision 1/CP.16; Annex 1/paragraph 2.
- 13
Dec. 1/CP.16; Annex 1/paragraph 2.
- 14
We note the identification of 'high-conservation value' forests, a term that has yet to become well-defined but which nevertheless is taking on an increasing role in the voluntary corporate supply chain commitments, are complementary to REDD+.
- 15
- 16
- 17
- 18
- 19
Decision 11/CP.19, paragraph 3.