
Abstract
Objective. Concurrent changes in physiological signals across multiple listeners (physiological synchrony—PS), as caused by shared affective or cognitive processes, may be a suitable marker of selective attentional focus. We aimed to identify the selective attention of participants based on PS with individuals sharing attention with respect to different stimulus aspects. Approach. We determined PS in electroencephalography (EEG), electrodermal activity (EDA) and electrocardiographic inter-beat interval (IBI) of participants who all heard the exact same audio track, but were instructed to either attend to the audiobook or to interspersed auditory events such as affective sounds and beeps that attending participants needed to keep track of. Main results. PS in all three measures reflected the selective attentional focus of participants. In EEG and EDA, PS was higher for participants when linked to participants with the same attentional instructions than when linked to participants instructed to focus on different stimulus aspects, but in IBI this effect did not reach significance. Comparing PS between a participant and members from the same or the different attentional group allowed for the correct identification of the participant's attentional instruction in 96%, 73% and 73% of the cases, for EEG, EDA and IBI, respectively, all well above chance level. PS with respect to the attentional groups also predicted performance on post-audio questions about the groups' stimulus content. Significance. Our results show that selective attention of participants can be monitored using PS, not only in EEG, but also in EDA and IBI. These results are promising for real-world applications, where wearables measuring peripheral signals like EDA and IBI may be preferred over EEG sensors.
Export citation and abstract BibTeX RIS

Original content from this work may be used under the terms of the Creative Commons Attribution 4.0 license. Any further distribution of this work must maintain attribution to the author(s) and the title of the work, journal citation and DOI.
1. Introduction
Selective attentional engagement is critical for efficient and effective learning (Jiang et al 2001). Sustaining attention to a single continuous stream of information is a constant challenge, especially when competing sensory stimuli are present. Individuals who suffer from learning disabilities in particular have troubles narrowing the focus of their attention (Richards et al 1990). To assist students with learning disabilities or to evaluate learning materials, it would be helpful to continuously and implicitly measure selective attentional engagement. Such continuous and implicit measures of attention may be extracted from physiological signals, such as brain potentials as measured through the electroencephalogram (EEG), electrodermal activity (EDA) or heart rate. Rather than investigating responses for specific events and individual observers as is commonly done in research using physiological measures to monitor mental state, one may also determine the relationship between individuals' physiological measures. Interpersonal analyses of physiological synchrony (PS) as analyzed though inter-subject correlations (ISC) in brain signals were found to be a strong marker of shared attentional engagement to narrative movie or audio clips (Hasson et al 2004, Hanson et al 2008, Dmochowski et al 2012). Note that we refer to the term physiological synchrony not only to cover synchrony in peripheral measures, such as EDA and heart rate, but also to cover synchrony in neural measures, such as EEG. Moments of high PS correlated strongly with general expressions of interest and attention (Dmochowski et al 2014), supporting the validity of PS as a measure of attention. In addition, individuals with neural responses that were more synchronous to the group that was attending to a narrative stimulus, remembered more information about this stimulus (Cohen and Parra 2016, Cohen et al 2018). A first step toward real-time inference of engagement in the classroom was taken by Poulsen et al (2017), who demonstrated that shared attention to narrative stimuli may be quantified using PS in wearable EEG among students in a classroom. Other recent studies in the educational domain also found promising results regarding neural PS as measure of attentional engagement. PS in EEG among students reflected classroom engagement and social dynamics (Dikker et al 2017). Further results suggested that the interaction between an instructor and a learner is reflected by the degree of PS in neural activity between the two (Zheng et al 2018, Bevilacqua et al 2019, Pan et al 2020). In some cases the degree of PS between an instructor and a learner predicted learning outcomes (Zheng et al 2018, Liu et al 2019, Pan et al 2020), although others did not find this relation (Bevilacqua et al 2019). PS in brain activity has also been related to attentional engagement in other settings, such as in responses to political speeches (Schmälze et al 2015) or music (Madsen et al 2019).
There is also a body of literature on synchrony in measures of the peripheral autonomic nervous system, such as heart rate and EDA (reviewed by Palumbo et al 2017). Rather than as indicators of shared attention, these have generally been interpreted as indicators of some form of connectedness between people or as indicators of shared affective and cognitive processes related to specific events in the world. Studies are conducted in a broad range of application areas, including psychotherapy (Koole et al 2020), marital counseling (Wilson et al 2018, Tourunen et al 2019) and collaborative learning (Malmberg et al 2019). PS in autonomic activity has for example been associated with relationship quality of romantic couples, empathy in therapist-patient dyads and team-performance of team-mates (Levenson and Gottman 1983, Marci et al 2007, Elkins et al 2009). Findings in this literature may also have been driven by mechanisms of shared attention. Shared attention has been emphasized in models of social rapport during social interaction (Tickle-Degnen and Rosenthal 1990).
In our view there are two gaps in current literature. First, it remains unclear how PS in central and peripheral modalities are related when capturing shared attentional engagement. In fact, in earlier work we did not find any studies concurrently monitoring PS in EEG and measures of autonomic nervous system activity (Stuldreher et al 2019). For future real-world studies and applications, autonomic measures may be preferred over neural measures as they can more easily be monitored through wearable sensors that are broadly available (e.g. Garbarino et al 2014). The second gap in current work is studying PS as a measure of attention during selective attention, i.e. under conditions where an individual has to focus on one type of stimulus when other stimuli are concurrently present. A specific, famous example of such a situation is the cocktail party problem (Cherry 1953), where listeners are capable to selectively attend to one of several simultaneously speaking voices. Research has shown that EEG in relation to sound characteristics can indicate which speaker the participant attended to in such problems using single-trial analysis (Horton et al 2014, O'Sullivan et al 2015). Even though PS is not dependent on sound characteristics, it may thus be expected that PS for individuals attending to the same speaker will be stronger compared to situations in which different speakers are attended to. In addition, while PS has not been used to distinguish the focus of attention on two concurrently presented stimuli, it has been shown that PS in EEG distinguishes conditions in which individuals attend or do not attend to external stimuli (Ki et al 2016, Cohen et al 2018).
In the current work we try to fill the two abovementioned gaps. We compare PS across EEG, EDA and electrocardiographic inter-beat interval (IBI). We aim to determine selective auditory attention of individuals who are all presented with the same auditory stimulus and are all attending to it, but to different stimulus aspects. Reminiscent to a classroom setting where students hear the teacher talk as well as hearing other, potentially interesting sounds like the school bell or whispering students, we present our participants with an audiobook, interspersed with short auditory stimuli. Participants are instructed to attend either to the narrative of the audiobook (audiobook-attending—AA), or to the interspersed stimuli (stimulus-attending—SA). Unlike the popular cocktail party paradigm, the two stimulus streams used in the current paradigm are not homogeneous. We selected this custom design for two main reasons. First, the selected design roughly mimics the environment of a dynamic classroom, where a long, continuous lecture is interspersed with short, inconsistent distractors. During the continuous lecture of a teacher, some students focus continuously to the lecture. This group of students is represented by the AA group in our current design. Another group of students may focus their attention more to other environmental events, such as whispering students or cars driving by outside. This group is represented by the SA group in our current design. It can be argued that during realistic cocktail parties, listeners also rather filter one speaker out of a great variety of sounds rather than out of a homogeneous collection of voices. For this reason, we also chose to present the audiobook and the interspersed stimuli both to the left and right ear, rather than one stream of sound in each ear. Second, including multiple stimulus sets that intersperse the audiobook allowed us to investigate whether PS may occur more reliably during a specific type of stimulus than during other stimulus types.
We formulated the following research questions. First, is PS of participants higher when paired with participants that received the same selective attentional instructions (within-group) than with participants that received instructions to focus on the other stimulus aspects (between-group)? If this is indeed the case, our second research question is whether the selective attentional focus of a participant can be identified based on synchrony in physiological responses with participants that have known attentional instructions. While participants in the SA group are instructed to ignore the narrative, this is probably hard to do at times without concurrent short-stimuli. Our third research question therefore is: does zooming in on intervals with interspersed stimuli increase classification accuracy? We hypothesize that classification of the selective attentional focus is enhanced when zooming in on intervals with interspersed stimuli, whereas zooming in on intervals with data from 'audiobook only' intervals results in decreased classification performance. We also expect that results are different for different measures. Because mental workload mainly affects EEG (Hogervorst et al 2014), we hypothesize the group-distinguishing capability of PS in EEG to work well during the beep counting task. As emotional stimuli have been strongly related to sympathetic nervous system activity as measured through EDA (Boucsein 1992, Bradley and Lang 2000), we hypothesize the group-distinguishing capability of PS in EDA to work well during the affective sounds. Our fourth research question is: does PS of participants paired with participants attending to a stimulus aspect correlate with performance metrics reflective of paid attention? Based on earlier work relating the degree of synchrony with an attending group to stimulus retention (Cohen and Parra 2016, Cohen et al 2018), we hypothesize that this is the case. To get a grip of what drives possible effects of attentional instruction on PS, we also obtain physiological response traces locked to the onset of interspersed stimulus events. Our final research question is: do traces of EEG, EDA and IBI locked to the onset of the interspersed stimuli differ between the attentional groups? We hypothesize stronger deflections in EEG, EDA and IBI traces for participants attending to the interspersed stimuli than for participants attending to the narrative of the audiobook.
2. Methods
2.1. Participants
Before recruitment, the study was approved by TNO's Institutional Review Board. The approval is registered under the reference 2018–70. Twenty-seven participants (17 female), aged between 18 and 48 (M = 31.6, SD = 9.8) years, were recruited from the institute's participant pool. Prior to the experiment all participants signed informed consent, in accordance with the Declaration of Helsinki. After the experiment they received a small monetary reward for their time and travel costs. None of the participants indicated problems in hearing or attention. Participants were randomly assigned to one of the two experimental groups. Data of one participant were discarded due to failed physiological recordings, resulting in equal group size.
2.2. Materials
EEG, EDA and electrocardiogram (ECG) were recorded at 1024 Hz using an ActiveTwo Mk II system (BioSemi, Amsterdam, Netherlands). EEG was recorded with 32 active Ag/-AgCl electrodes, placed on the scalp according to the 10–20 system, together with a common mode sense active electrode and driven right leg passive electrode for referencing. The electrode impedance threshold was set at 20 kOhm. For EDA, two passive gelled Nihon Kohden electrodes were placed on the ventral side of the distal phalanges of the middle and index finger. For ECG, two active gelled Ag/-AgCl electrodes were placed at the right clavicle and lowest floating left rib. EDA and heart rate were also recorded using wearable systems (Movisens EdaMove 4 and Wahoo Tickr, respectively). These data are not discussed here.
2.3. Stimuli and design
Participants performed the experiment one by one. Each participant listened to the same audio file, composed of a 66 min audiobook (a Dutch thriller 'Zure koekjes', written by Corine Hartman) interspersed with other auditory stimuli. The 13 participants in the AA group were asked to focus on the narrative of the audiobook and ignore all other stimuli or instructions and the 13 participants in the SA group were asked to focus on the other stimuli, perform accompanying tasks and ignore the narrative. Figure 1(a) and (b) visualizes the experimental paradigm and participant instructions. The order of interspersed affective sounds and beeps was randomly determined, but was identical for each participant. Intervals between the end of one stimulus and the onset of the next stimulus varied between 35 and 55 s ( ,
,  s). In the supplementary material (tables 1–3) (available online at stacks.iop.org/JNE/17/046028/mmedia) the exact types and order of interspersed stimuli can be found. The short auditory stimuli were affective sounds, blocks of beeps, and the instruction to sing a song.
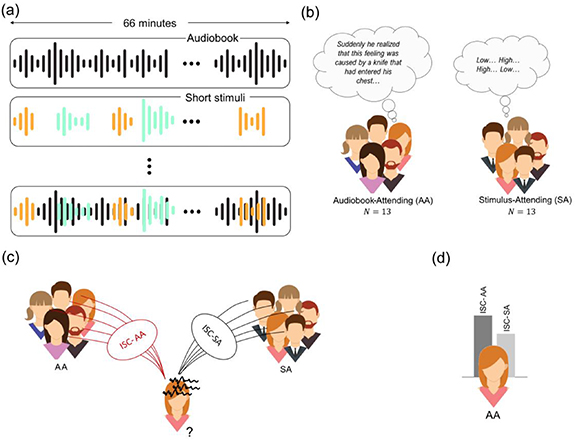
Figure 1. Overview of the experimental paradigm. (a) The paradigm consists of a narrative auditory stimulus of 66 min that is interspersed with short auditory cognitive (depicted in green) and affective (in orange) stimuli. (b) Half of the participants were instructed to focus their attention on the audiobook (AA group), while the other half of the participants were instructed to focus on the interspersed stimuli (SA group). (c) For each participant, the inter-subject correlations (ISC) of her/his EEG, electrodermal activity and inter-beat interval with those of all other participants in the AA condition (ISC-AA) and SA condition (ISC-SA) are computed. (d) If the physiological responses of a participant are more correlated with those of participants in the AA group, the participant is classified as a AA participant, if the responses are more correlated with those of participants in the SA group, the participant is classified as a SA participant.
Download figure:
Standard image High-resolution imageAffective sounds were taken from the second version of the International Affective Digitized Sounds (IADS) (Bradley and Lang 2007). The IADS is a collection of six second acoustic stimuli that have been normatively rated for emotion, based on valence, arousal and dominance. Examples of stimuli are the sound of a crying baby or a cheering sports crowd. We selected 12 neutral sounds (IADS number 246, 262, 373, 376, 382, 627, 698, 700, 708, 720, 723, 728), 12 pleasant sounds (110, 200, 201, 202, 311, 352, 353, 365, 366, 367, 415, 717) and 12 unpleasant sounds (115, 255, 260, 276, 277, 278, 279, 285, 286, 290, 292, 422) based on their normative ratings of valence and arousal.
Beeps were presented in blocks of 30 s, with every 2 s a 100-ms high (1 kHz) or low (250 Hz) pitched beep. SA participants were asked to separately count the number of high and low beeps presented in a block, as in (De Dieuleveult et al 2018). This task was practiced with them beforehand. In total, 27 blocks of beeps were presented.
At the end of the audiobook, the instruction was presented to sing a song aloud after the subsequent auditory countdown reached 0. This instruction had to be followed by the SA group and was expected to induce stress and a strong increase in EDA and a strong decrease in IBI (Brouwer and Hogervorst 2014). Physiological data obtained after this stimulus are discarded in further analysis as some participants started talking during or right after this stimulus. In total, we consider 3800 s of data in further analyses, out of which 1026 s involved concurrent presentation of the audiobook and interspersed stimuli.
After the experiment, all participants were asked to answer two questionnaires. In the first questionnaire, participants used a slider on a horizontal visual analogue scale running from 'not at all' to 'extremely' to rate their mental effort, distraction and emotion during the short emotional sounds, and the level of stress induced by the sing-a-song assignment. The second questionnaire was on the content of the stimuli: participants were asked to report as many emotional sounds as they could remember, they were asked to estimate the average number of beeps in a block, and they were asked questions about the content of the narrative. The questions and correct answers can be found in the supplementary material (table 4).
2.4. Analysis
2.4.1. Pre-processing
Data processing was done using MATLAB 2019a software (Mathworks, Natick, MA, USA). EEG was pre-processed using EEGLAB v14.1.2 for MATLAB (Delorme and Makeig 2004). To remove potentials not reflecting sources of neural activity, like ocular or muscle-related artefacts, logistic infomax independent component analysis (Bell and Sejnowski 1995) was performed. EEG was first downsampled to 256 Hz and high-pass filtered at 1 Hz. This relatively high cut-off frequency has shown to work better for independent component analysis compared to lower cut-off frequencies (Winkler et al 2015). Data were then notch filtered at 50 Hz, using the standard finite-impulse-response filter implemented in EEGLAB function pop_eegfiltnew. Channels were re-referenced to the average channel value. Independent component analysis was performed and the Multiple Artifact Rejection Algorithm (Winkler et al 2011) was used to classify artefactual independent components, i.e. components not reflecting sources of neural activity, but ocular or muscle-related activity. Components that were marked as artefactual were removed from the data. Then, samples whose squared amplitude magnitude exceeded the mean-squared amplitude of that channel by more than four standard deviations were marked as missing data ('NaN') in an iterative way with four repetitions to remove outliers. By doing so, 0.8% of data were marked as missing.
EDA was downsampled to 32 Hz. The fast changing phasic and slowly varying tonic components of the signal were extracted using Continuous Decomposition Analysis as implemented in the Ledalab toolbox for MATLAB (Benedek and Kaernbach 2010). In further analyses we use the phasic component, as this component of the EDA signal is mainly related to responses to external stimuli.
ECG measurements were processed to acquire the inter-beat interval (IBI—inversely proportional to heart rate). After downsampling to 256 Hz, ECG was high-pass filtered at 0.5 Hz. R-peaks of the ECG signal were detected following Pan and Tompkins (1985), resulting in a semi-timeseries of consecutive IBIs. This IBI semi-time series was transformed into a timeseries by interpolating consecutive intervals at 32 Hz.
2.4.2. Computation of inter-subject correlations as a measure of physiological synchrony
For EEG, we computed ISC in the time-domain as a measure of PS. Rather than treating EEG signals separately, the ISC were evaluated in the correlated components of the EEG (Dmochowski et al 2012, 2014). The goal of the correlated component analysis is to find underlying neural sources that are maximally correlated between participants, using linear combinations of electrodes. The technique is similar to the more familiar principle component analysis, differing in that projections capture maximal correlation between sets of data instead of maximal variance within a set of data. EEG data from each participant were projected on the component vectors. Participant-to-group ISC were then computed as the sum of correlations in the first three component projections. Correlations in higher order projections are usually discarded as they are close to chance level correlations (Ki et al 2016).
For EDA and IBI, we also computed ISC in the time-domain as a measure of PS. We followed the approach of Marci et al (2007). Pearson correlations were calculated over successive, running 15 s windows at 1 s increments. The overall correlation between two responses was computed as the natural logarithm of the sum of all positive correlations divided by the sum of the absolute values of all negative correlations. Participant-to-group ISC were computed by averaging over all correlations with other participants in the group.
2.4.3. Identifying selective attention through comparing within-group and between-group physiological synchrony
To investigate whether within-group PS was higher than between-group PS, we computed for each participant the ISC with participants with the same attentional instructions (within-group) and the ISC with participants with other attentional instructions (between-group). For EEG, correlated component vectors were extracted from both the AA and SA groups. Data from each participant were then projected on both of these component vectors. Data from the to-be tested participant were excluded in the component extraction step of EEG. We then tested whether the ISC scores were normally distributed using the Shapiro-Wilk tests for both the AA and SA groups in EEG, EDA and IBI. If the null hypothesis of normally distributed data was not rejected, we conducted paired-sample t-tests to test for differences between within-group PS versus between-group PS, otherwise the non-parametric Wilcoxon signed rank test was used.
To examine how well PS can be used to identify whether an individual participant had been attending to the narrative of the audiobook or to the interspersed stimuli, we also classified each participant into the attentional condition that he or she showed more synchrony with, for EEG, EDA and IBI. Chance level classification performance was determined using surrogate data with 100 renditions of randomly shuffled attentional condition labels. For each shuffle the same procedure as above was followed. Two sample one-tailed t-tests were conducted to test whether classification performance was above chance level. Figures 1(c) and (d) visualizes the classification paradigm.
2.4.4. Influence of interspersed stimuli on the difference between within-group and between-group physiological synchrony
We hypothesized that differences between attentional groups are present during interspersed stimulus presentation, but not or to a lesser extent when the audiostream only contains the audiobook. Therefore, we zoomed in on intervals with concurrent audiobook and stimulus presentation, and, as a comparison, audiobook parts without interspersed stimuli. We computed within-group and between-group PS three extra times; when considering only physiological responses recorded during blocks of beeps; during presentation of affective sounds; and during parts of the audiobook without interspersed stimuli. For EEG, we extracted new correlated components in each of the three data selections before computing correlations in the projections. Procedures that followed were identical to those for the whole narrative stimulus; we used paired-sample t-tests or the non-parametric Wilcoxon signed rank test to test for differences between within-group and between-group PS and we classified the attentional condition of each participant as the condition of the attentional group he or she showed more synchrony with.
2.4.5. Behavioral performance and its association with physiological synchrony
To examine whether participants followed their attentional instructions, we tested if the performance metrics on the questionnaires about the content of the interspersed stimuli and narrative differed between groups using non-parametric Wilcoxon rank sum tests. We then tested whether higher PS with respect to an attentional group also results in higher performance on the post-audio questions about that group's stimulus content. Outliers in the performance metrics were first removed. Three participants were left out for this analysis because of outlying performance data. Two of these participants reported '395' and '110', respectively, to the number of beeps, while the correct answer was 15; one correctly identified 25 of the 36 IADS sounds. Values were then ranked based on relative performance across all participants: the participant performing best on a question received score 26, the worst performing participant received score 1. This was done for each of the three metrics of performance (correct questions of the narrative, number of reproduced affective sounds and absolute deviation from the correct number of beeps). The correlations between these performance scores with ISC toward the AA group and ISC toward the SA group were computed. We also tested whether a large difference between PS with respect to both attentional groups in a participant leads to a large difference between the performance metrics reflective of attention toward the AA and SA groups. To do so, for each participant ISC toward the AA group was subtracted from ISC toward the SA group. The score corresponding to narrative performance was subtracted from the average of the affective sound score and beeps score (e.g. for a participant with a score of 10 for the narrative, a score of 26 for the affective sounds and a score of 16 for the beeps this thus results in a score of 10−(26 + 16)/2 = − 11). We computed the correlations between the subtracted ISC metric and the subtracted performance-metric.
As an exploratory comparative analysis, we also computed correlations between the self-reported measures of mental effort, distraction and emotion with the performance metrics reflective of paid attention.
2.4.6. Short-stimulus response traces
To get an understanding of what drives possible effects of attentional instruction on PS, response traces were extracted for EEG, EDA and IBI in response to the beeps and affective sounds. EEG event-related potentials were obtained from the parietal site on the anterior-posterior midline of the scalp (Pz). We chose this location as responses here have been shown to reflect attentional, emotional and working memory processes (Polich and Kok 1995, Polich 2007, Hettich et al 2016). Pre-processed EEG was cut in 1100 ms short stimulus-locked epochs (100 ms pre-stimulus onset, 1000 ms post-stimulus onset) and baseline corrected based on the average value of the 100 ms before stimulus onset. For the blocks of beeps, responses were locked to each beep in a block and then averaged over all beeps in that block. Grand-average potentials were obtained by averaging over all participants in each condition. Running independent-sample t-tests were conducted to test for significant between-group differences over time. Tests were adjusted for multiple comparisons by controlling the false discovery rate (FDR) using the Benjamini–Hochberg procedure (Benjamini and Hochberg 1995). In this procedure, р-values are sorted and ranked. The smallest value gets rank 1, the largest rank N. All р-values are then multiplied by N and divided by their rank to obtain adjusted  values. The FDR threshold was set at
  . Phasic EDA and IBI were cut in 31 s stimulus-locked epochs (1 s pre-stimulus onset, 30 s post-stimulus onset) and baseline corrected based on the average value of the 1 s before stimulus onset. As for EEG, grand-average responses were obtained by averaging over all participants in each condition. Phasic EDA was standardized into
  scores—i.e. mean of zero, standard deviation of one—following Ben-Shakhar (1985). Running independent t-tests corrected for multiple comparison using FDR were conducted to test for significant between-group differences over time.
3. Results
3.1. Physiological synchrony as a measure of selective attention
Figure 2 shows the within-group and between-group ISC averaged across AA participants and SA participants in EEG, EDA and IBI. Within-group and between-group ISC of individual participants are plotted on top of the bars. Figure 2(a) shows ISC over the whole audiobook. Results for EEG are in line with our hypothesis. ISC are higher for participants when paired to participants from their own attentional group compared to participants from the other group. This is the case both for participants in the AA group ( ,
,  ) and SA group (
 ,
,  ). EDA partly follows our hypothesis. Within-group PS is higher than between-group PS for SA participants (
 ,
,  ), but not for AA participants (
 ,
,  ). In IBI, no significant group-level effects were found: (AA:
  ,
,  , SA:
, SA:  ,
,  ).
).
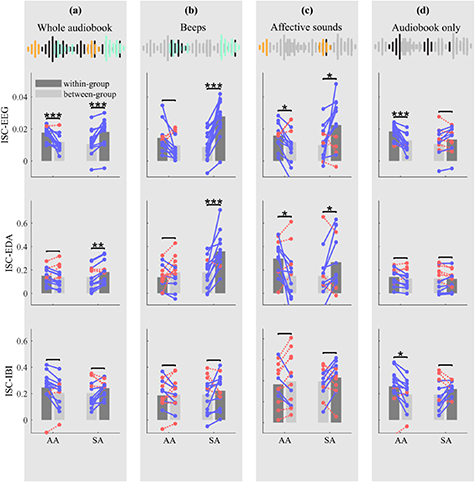
Figure 2. Within-group and between-group inter-subject correlations (ISC) for audiobook-attending participants (AA, left bars) and stimulus-attending participants (SA, right bars) for EEG, electrodermal activity (EDA) and inter-beat interval (IBI). (a) shows ISC computed over the whole audiobook, (b) when considering only parts with concurrent beep presentation, (c) when considering only parts with concurrent affective sounds and (d) when considering only audiobook parts without interspersed stimuli. Connected dots display participant-to-group ISC of each participant, where blue lines indicate participants for whom within-group ISC are higher than between-group ISC and red dotted lines indicate individuals for whom between-group ISC are higher than within-group ISC. Paired sample t-test were conducted to test whether within-group correlations were higher than between-group correlations (*  , **
, **  , ***
, ***  ).
).
Download figure:
Standard image High-resolution imageWhen assuming for each participant that she or he follows the attentional instruction as indicated by the group with whom she or he shows the highest averaged synchrony, classification accuracies are high and well above chance level, as shown in the first column of table 1. Using this leave-one-participant-out paradigm, ISC in EEG correctly identifies the attentional condition of all but one of the participants. Using EDA and IBI, 73% of the participant are correctly identified.
Table 1. percentage of participants of which the attentional condition is correctly identified using inter-subject correlations in EEG, electrodermal activity (EDA) and inter-beat interval (IBI) considering all four time intervals. In brackets the mean and standard deviation chance level classification performance is shown. Grey cells depict classification accuracies significantly higher than this chance level distribution.  values are shown in the table.
| Whole audiobook | Beeps | Affective sounds | Audiobook only | |
|---|---|---|---|---|
| EEG | 96 (49 ± 11)  |
88 (52 ± 13)  |
73 (50 ± 13)  |
73 (50 ± 10)  |
| EDA | 73 (50 ± 10)  |
69 (50 ± 10)  |
73 (49 ± 10)  |
62 (49 ± 11)  |
| IBI | 73 (50 ± 11)  |
58 (52 ± 9)  |
42 (49 ± 10)  |
73 (50 ± 10)  |
Figure 2(b)–(d) shows ISC averaged across AA participants and SA participants when paired with participants of the AA group or SA group during beep presentation (b), affective sound presentation (c) and when considering only audiobook parts without interspersed stimuli (d). The classification accuracies are shown in columns two to four of table 1. During beep presentation, ISC-EEG are clearly higher for SA participants when paired with other SA participants than when paired with AA participants ( ,
,  ). AA participants do not synchronize more within-group than between-groups (
 ,
,  ). During affective sound presentation both groups have higher within-group PS than between-group PS (AA:
  ,
,  ; SA:
; SA:  ,
,  ). Overall, classification accuracy is lower rather than higher with respect to the whole audiobook, both during the beeps (88%) and especially during affective sounds (73%). When excluding experiment parts with interspersed stimulus presentation (audiobook only), AA participants clearly have stronger ISC with other participants attending to the narrative, than with participants not attending to the narrative (
 ,
,  ). For SA participants there is no significant difference between ISC with respect to both groups (
 ,
,  ).
).
In EDA similar effects are found as in EEG. Figure 2 shows that again ISC during blocks of beeps are higher for SA participants when paired with participants in their own attentional group ( ,
,  ), but this does not hold for AA participants (
 ,
,  ). During affective sound presentation both groups have higher within-group than between-group PS (AA:
  ,
,  ; SA:
; SA:  ,
,  ). Compared to the whole stimulus, classification accuracy drops (69%) during beeps, but remains constant (73%) during affective sounds. When considering audiobook parts without interspersed stimulus presentation, no significant differences are found (AA:
  ,
,  ; SA:
; SA:  ,
,  ). Classification accuracy is not significantly higher than chance (62%) for narrative only.
Results for IBI differ from the other measures. During beep presentation IBI ISC are not higher within-group than between-groups for both AA ( ,
,  ) and SA groups (
 ,
,  ). Also during affective sound presentation there are no higher ISC within-group than between-groups (AA:
  ,
,  ; SA:
; SA:  ,
,  ). Table 1 shows that these results are reflected in classification accuracies. Classification accuracies are not higher than chance level for beeps (58%) and affective sounds (42%). For the audiobook parts without interspersed stimuli, PS is higher within-group than between groups for AA participants (
 ,
,  ), but not for SA participants (
 ,
,  ). Classification accuracy is identical to performance considering the whole stimulus (73%).
3.2. Correlations between physiological synchrony and performance measures indicative of attentional focus
The results on the post-audio stimulus-content questionnaire confirmed that participants followed their attentional instructions. SA participants remembered more affective sounds (Mdn = 6) than AA participants (Mdn = 4) ( ,
,  ) and more accurately estimated the number of beeps in the counting task than AA participants, with significantly smaller estimation error for SA participants (Mdn = 1) than AA participants (Mdn = 10), (
 ,
,  ). AA participants recalled the narrative of the audiobook more accurately. They answered more questions about the narrative correctly (Mdn = 6) than SA participants (Mdn = 3), (
 ,
,  ). Strong attentional focus, following the instruction to attend either to the narrative or to the short stimuli, can be expected to result in high performance on respectively the AA or the SA questionnaires and high ISC toward the AA and SA group. To investigate whether ISC were predictive of performance on the questionnaires, we computed correlations of the directional synchrony measures ISC-AA and ISC-SA with the questionnaire performance measures. Table 2 shows the correlation coefficients
  and corresponding
  values for the different combinations. In the grey cells we hypothesized positive correlations: attending to short stimuli would result in both high ISC with respect to the SA group and high performance on the questions about the affective sounds and beeps; attending to the narrative would result in both high ISC with respect to the AA group and high performance on the questions about the narrative. The significant correlations are shown in bold. For EEG, results are in line with our hypothesis. ISC with respect to the SA group strongly correlates with the number of reproduced affective sounds, whereas ISC with respect to the AA group strongly correlates with the number of correctly answered narrative questions. In IBI, ISC with respect to the AA group is also significantly correlated with the number of correctly answered narrative questions. Correlations were not significant for the other combinations in the grey cells. However, correlations tend to be positive in the grey cells, and negative in the other cells as might be expected when attending to the one aspect (narrative or short stimuli) decreases performance on questions about the other aspect (short stimuli or narrative).
Table 2. Correlation coefficients ( ) and corresponding
  values between inter-subject correlations (ISC) with the audiobook-attending group or stimulus-attending group and the number of correctly answered narrative questions, the number of reproduced affective sounds, estimated average number of beeps, for EEG, electrodermal activity (EDA) and inter-beat interval (IBI). Additionally, correlations between the difference of ISC toward the audiobook attending group and ISC toward the stimulus attending group with the difference of the performance metrics are shown. Bold lines show significant correlations. In the grey cells we hypothesized positive correlations.
| ISC toward audiobook attending group | ISC toward stimulus attending group | ||
|---|---|---|---|
| Ranked performance of number of correctly answered narrative questions | EEG |  , ,  |
 , ,  |
| EDA |  , ,  |
 , ,  | |
| IBI |  , ,  |
 , ,  | |
| Ranked performance of number of reproduced affective sounds | EEG |  , ,  |
 , ,  |
| EDA |  , ,  |
 , ,  | |
| IBI |  , ,  |
 , ,  | |
| Ranked performance of estimated average number of beeps | EEG |  , ,  |
 , ,  |
| EDA |  , ,  |
 , ,  | |
| IBI |  , ,  |
 , ,  | |
| Difference between ISC toward audiobook attending group and ISC toward stimulus attending group | |||
| Ranked performance difference | EEG |  , ,  | |
| EDA |  , ,  | ||
| IBI |  , ,  | ||
Some participants might be able to attend to all of the stimulus content while others might not even be able to attend to their own stimulus content. We tested whether the difference between the directional synchrony measures was also predictive of the difference between the performance metrics. Table 2 therefore also shows correlations between ISC-SA minus ISC-AA with the difference in performance on SA and AA questionnaires. Correlations are in line with our hypothesis, with strong positive significant correlations for EEG and IBI.
Table 3 shows that none of the self-reported measures of distraction and mental effort predicted performance on post-stimulus questions for SA participants. For AA participants, reported overall mental effort predicted the number of correctly answered narrative questions ( ,
,  ), where a high reported mental effort was associated with low performance. Reported distraction by the beep blocks correlated negatively with performance (
 ,
,  ), while no significant correlations were found between self-reported distraction and distraction by the affective sounds with performance on the narrative questions.
Table 3. Correlations coefficients ( ) and corresponding
  values between self-reported measures of distraction and mental effort with performance metrics reflective of paid attention. In the grey cells we hypothesized correlations. In the case of self-reported distraction, these were expected to be negative, in the case of mental effort these correlations could be either negative or positive. Cells with significant correlations are depicted in bold.
| Audiobook attending | Stimulus attending | ||
|---|---|---|---|
| Ranked performance of number of correctly answered narrative questions | Ranked performance of number of reproduced affective sounds | Ranked performance of number of estimate average number of beeps | |
| Distraction by the other stream of audio |  , ,  |
 , ,  |
 , ,  |
| Mental effort during the experiment |  , ,  |
 , ,  |
 , ,  |
| Distraction by blocks of beeps |  , ,  |
× | × |
| Distraction by affective sounds |  , ,  |
× | × |
| Distraction by the audiobook | × |  , ,  |
 , ,  |
| Mental effort during beep counting | × | × |  , ,  |
3.3. Stimulus-locked response traces
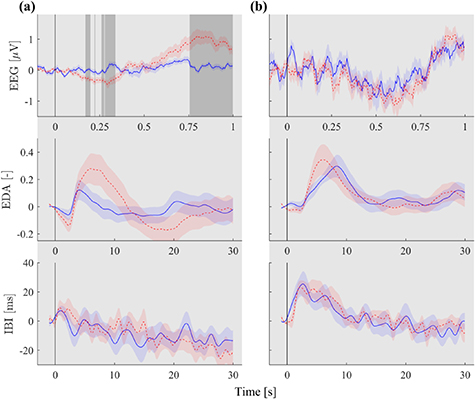
In section 3.1, the effect of interspersed stimulus presentation on ISC was presented. In this section we further focus on epochs with interspersed stimuli to investigate their effect on the physiological responses. Figure 3 shows midline parietal (Pz) event-related potentials, time-locked to interspersed stimulus onset (respectively beeps and affective sounds). Independent-sample running t-tests corrected for multiple comparisons revealed significant between-group differences ( ) in response toward the beeps, with larger deflections in SA participants than AA participants. In response to affective sounds, no between-group differences in responses were found.
Figure 3. Midline parietal event-related EEG potentials, standardized phasic electrodermal responses (EDA) and inter-beat interval (IBI) time-locked to stimulus onset of the beeps in each block (a) and affective sounds (b), averaged over audiobook-attending participants (blue, solid line) and stimulus-attending participants (red, dotted line). The standard error of the mean across participants in each group is depicted in shaded areas around the grand average potentials. Significant between-group differences ( , corrected for multiple comparisons using false discovery rate) are depicted with gray areas in the potential plots.
Download figure:
Standard image High-resolution image
Figure 3 also shows response traces for standardized phasic EDA and IBI. Although for EDA, on average responses of SA participants seem to show larger deflections than those of AA participants, statistical tests do not reveal significant between group differences in response to any of the stimuli. For IBI, response traces are very similar and no significant between-group differences were found.
4. Discussion
4.1. Summary of findings
In the current study we determined physiological synchrony (PS) through inter-subject correlations (ISC) in EEG, EDA and IBI to determine the selective attentional focus of individuals who were all presented with the same auditory stimulus and were all attending to it, but were attending to different stimulus aspects. PS in all three modalities was associated with selective attention. EEG and EDA responses of participants were more synchronized with those of participants sharing attentional focus than with those of participants attending to other stimulus aspects, but for IBI no significant effects were found. Using the correlations of an individual's EEG with the two groups of differently attending individuals as a predictor of attentional instruction resulted in a classification accuracy of 96%. For EDA and IBI, accuracies of 73% were reached. All of the classification accuracies are well above chance level. Even when only data was included coming from 'audiobook only' intervals, classification performance was above chance level for EEG and IBI, although not for EDA. The level of synchrony toward the groups also correlated with post-stimulus performance metrics reflective of paid attention, reinforcing the validity of PS as measure of attention and suggesting PS as a suitable predictor of performance. The results are framed in terms of a broader picture in the following sections.
4.2. Physiological synchrony as measure of selective attention
This is not the first study associating PS in EEG with attentional engagement to naturalistic stimuli, but our study differs from previous studies in several important aspects. Rather than relating PS in EEG to shared attentional engagement toward a single stream of information or distinguishing between attentive and inattentive conditions (Dmochowski et al 2012, 2014, Ki et al 2016, Cohen et al 2018), we here show that we can also distinguish between two different selective outward auditory attentional conditions with 96% accuracy.
EDA and IBI performed quite well in distinguishing between groups too. To our best knowledge, this is the first time that PS in EDA or IBI was shown to be modulated by attentional focus only. The promising performance of these measures is important from a user perspective, as EDA and IBI can be more easily monitored in ambulatory environments than EEG. We must note that effects for IBI are not as strong as for EEG and EDA. Classification accuracies for the whole stimulus and audiobook only parts were at least as high or higher for IBI than for EDA. However, when considering the whole stimulus, ISC values in IBI were not significantly different for between- and within-attentional groups. As can be seen in the IBI panel in figure 2(a), IBI ISC is higher within than between attentional groups for the same number of participants as in EDA, presented in the panel above it. However, because the size of this difference in IBI is relatively variable across participants, the statistical test did not produce a significant effect for IBI while it did for EDA. This may be explained by the fact that the relation between IBI and mental processing seems less straightforward, and more person dependent than for EDA. Whereas EDA has consistently shown a positive relation with arousal (Boucsein 2012), IBI shows a more complex relation with arousal, as both heart rate accelerations (e.g. Brouwer and Hogervorst 2014) and heart rate decelerations (e.g. Brouwer et al 2015a) have been reported. The reason for this is probably that arousal can be associated with the body being prepared for action (the defense reflex) or with a concentrated, focused state (the orienting reflex), that have been associated with heart rate accelerations and decelerations, respectively (Graham and Clifton 1966). As increased physiological arousal has been associated with increased emotional and attentional engagement (Boucsein 2012, Critchley 2002), a more complex relation with arousal may result in attenuated PS in IBI for some participants.
4.3. Influence of interspersed stimuli on the identification of selective attention
We hypothesized that high classification performance would be driven by moments in the audiobook with concurrent stimulus presentation. We expected that in the large parts of the experiment where only the audiobook was played it was probably hard for SA participants to ignore the narrative. This would result in similar physiological activation across all participants. Our results suggest otherwise. When considering parts of the audiobook where no stimuli were interspersed, classification accuracies were still above chance level for EEG and IBI, although not for EDA. EEG and IBI of AA participants were also found to synchronize significantly more with other AA participants than with SA participants, revealing the difference in shared attentional focus between participant groups, also during audiobook only. This result does not mean that PS was not influenced by the interspersed stimuli, although we did not find our hypothesized effect that classification accuracies would be higher when considering only data with concurrent stimulus presentation. This may partly be due to the specific chosen interspersed stimuli durations and presentation frequency. Nonetheless, during presentation of beeps and affective sounds, EEG and EDA of SA participants were much more strongly synchronized with the signals of other SA participants than with those of AA participants. Figure 2 suggests that this effect is more pronounced than when considering the entire experiment.
PS results were different for different modalities. Because mental workload mainly affects EEG, and because it is expected to respond in a similar way across participants to a well-timed, attended stimuli (Hogervorst et al 2014), we hypothesized the group-distinguishing capability of ISC in EEG to work well during the beep counting task. As emotional stimuli have been strongly related to sympathetic nervous system activity as measured through EDA (Boucsein 1992, Bradley and Lang 2000), we hypothesized the group-distinguishing capability of ISC in EDA to work well during the affective sounds. Indeed, we found no strong drop in classification performance for EEG during the beeps as compared to the whole stimulus and no strong drop for EDA during the affective sounds. In addition to this, ISC in IBI identified the selective attention relatively well during audiobook parts without interspersed stimuli. These findings support a multimodal approach that can exploit the particular strength of each neural and peripheral measure. Also note that that the attentional condition of all participants was correctly classified by at least one of the three physiological measures (see the identification of the selective attention for each participant and each physiological measure in table 5 in the supplementary material).
PS in different modalities are not only expected to differ in reflecting selective attention because they are associated with different types of mental activity, but also because they unfold on different timescales. Whereas EEG unfolds in the range of milliseconds, response latencies of the peripheral physiological measures are two orders of magnitude larger. Especially when interested in fusion data from all three sensors into a single index of multimodal PS, the issue of timescales has to be resolved in future work.
4.4. Behavioral performance and its association with physiological synchrony
We hypothesized that more synchronized physiological responses with respect to an attentional group would lead to better performance on the accompanying post-stimulus questionnaires. Participants with high PS elicit physiological activity that is similar to that of their peers and they are therefore thought to be more engaged with the stimulus (Dmochowski et al 2014, Cohen et al 2017). For EEG, this has indeed been found to result in correlations with performance on immediate and delayed memory retention questions (Cohen and Parra 2016, Cohen et al 2018). Following our hypothesis, ISC in EEG strongly correlated with performance on questionnaires reflective of paid attention. The degree of synchrony with respect to AA participants predicted performance on questions about the narrative, whereas the degree of synchrony with respect to SA participants predicted performance on questions about the short-stimuli. Also in IBI the degree of synchrony with the SA group predicted short-stimulus retention. For both EEG and IBI, we also found that the degree to which participants synchronize more with one of the attentional groups significantly correlates with the degree to which they score better on that groups' retention questions than on questions reflective of the other group's content. This is important when monitoring selective attentional engagement. Rather than only being able to distinguish overall attentive individuals (generally high PS toward both attentional groups) from overall inattentive individuals (generally low PS toward both attentional groups), this finding enables the identification of well-focused individuals, that attend well to specific information, while shutting-off other information (high PS toward one attentional group, low PS toward the other attentional group). These differences are found to be meaningful in terms of performance. Simply asking participants how distracted they were by other stimulus aspects or how much mental effort they invested during the experiment was not as informative of performance on post-stimulus questions as measures of PS. Performance of AA participants on the questions about the narrative of the audiobook was predicted by the degree of invested mental effort and the degree of distraction by blocks of beeps. However, these results were inconsistent with other self-reported measures—performance on narrative questions was not predicted by the degree of distraction by all interspersed stimuli. Furthermore, for SA participants none of the self-reported metrics of mental state predicted performance resulting in an incomplete view.
4.5. Interspersed stimulus response traces
To obtain an understanding of what drives the found effects of attentional instruction on PS, we locked the physiological response traces locked to the onset of the interspersed stimuli. We hypothesized larger deflections for SA participants than for AA participants. For the blocks of beeps, this hypothesis was confirmed; event-related responses in parietal EEG in response to beeps were significantly more deflected for SA participants than AA participants and responses of phasic EDA show a similar although non-significant effect. However, responses to affective sounds were indistinguishable between groups, with deflections for both attentional groups. Our stimuli, beeps and affective sounds, differed with respect to their capacity to draw attention. The blocks of beeps mainly attract attention through top-down mechanisms related to task instructions, whereas the affective sounds also attract attention through bottom-up mechanisms related to salience or emotional relevance (Öhman et al 2001). The affective sounds could thus be expected to attract attention of all participants and therefore to induce responses in physiological measures of all participants. This may have resulted in responses to affective sounds that were indistinguishable between groups.
4.6. Processes underlying physiological synchrony
Our findings, together with those of others who found PS in electroencephalographic and hemodynamic cortical responses as a function of attentional instruction, suggest that neural correlates of cognitive processes are reliable and reproducible (Hasson 2004, Furman et al 2007, Jääskeläinen et al 2008, Wilson et al 2008, Hasson et al 2010). It is not yet clear which underlying processes are reflected in cortical synchronization. The inter-subject synchronization has been associated with a broad range of higher-level processes, such as memory encoding, emotional processing and stimulus preference (Furman et al 2007, Hasson et al 2008, Jääskeläinen et al 2008, Wilson et al 2008, Dumas et al 2010, Nummenmaa et al 2012, Dmochowski et al 2014, Ki et al 2016). The similarity of scalp topographies of the cortical correlated components across sensory modalities indicates that the fundamental processes underlying cortical ISC are low-level and supramodal (Ki et al 2016, Cohen and Parra 2016). Our findings of synchrony in peripheral measures suggest that both systems are to some degree influenced by the same high-level processes. Research has shown that sympathetic autonomic activity is indeed influenced by higher subcortical and cortical brain areas implicated in high-level processes of attention, emotion and motivation (Kaada 1951, Neafsey 1991). Some of these brain areas were found to covariate with synchronization in EEG of participants sharing attention to a narrative visual stimulus (Dmochowski et al 2014). It may be the case that activation of the autonomic measures is induced through mechanisms of arousal, as increased attention has been shown to be associated with heightened arousal (Critchley 2002). However, future research is needed to unravel the underlying mechanisms of PS in cortical and autonomic measures.
Nonetheless, determining how strongly physiological measures synchronize across individuals is a valuable way to monitor attentional or emotional engagement. The simplicity of the current analysis may make this a valuable approach compared to other ways to determine emotional or attentional engagement using physiological variables. A common approach for the assessment of attention or engagement in this field is based on supervised learning algorithms, where a machine learning model is trained to predict attentional engagement (Liu et al 2013, Aliakbaryhosseinabadi et al 2017) or emotional engagement (Bailenson et al 2008) from a feature set of physiological variables. These approaches require labeled training data, i.e. a set of physiological responses that are labeled with the degree of attentional or emotional engagement. Not only is this time-consuming, it is also very difficult to determine a 'ground truth' mental state than can be used for data labeling (Brouwer et al 2015a). Determining the degree of PS does not depend on labeled training data. This is especially valuable when there is limited information about events in the world, as is the case in real-world environments like classrooms, where it is difficult to obtain a set of labeled training data.
4.7. Future work
While the current study and analyses produced interesting findings, there are a number of topics we have in mind in order to improve and add to our current results. Firstly, we will investigate ways of combining PS in the three modalities into one multimodal measure of PS.
Furthermore, in the current work PS in EDA and IBI was computed using simple Pearson correlations in moving windows. While this method is computationally inexpensive and easily adaptable for online use, limitations of the method include oversampling as a result of overlapping windows as well as potentially spurious correlations as a result of not controlling for autocorrelation (Levenson and Gottman 1983). While such correlations would not explain the difference between selective attentional conditions, they could influence overall correlation levels. Future research could investigate whether other methods of synchrony assessment would result in similar findings. Synchrony assessment would not even have to be limited to the time domain, but could also include frequency domain metrics, such as wavelet coherence in IBI (Quer et al 2016) or one of the many coherence metrics in neural measures (Babiloni and Astolfi 2014). An innovative method of synchrony assessment for ECG was presented by Verdiere et al (2020) who analyzed concurrent ECG peaks and found this to be a relatively effective method to detect concurrent, high workload in teams. Future work could also compare the currently obtained results with other methods of attention monitoring. For example, Ki et at (2016) showed that not only EEG ISC but also alpha power could distinguish naturally attending participants form inward focused participants, be it with a weaker modulation.
Finally, we want to suggest future work to focus on more unsupervised mechanisms identifying groups with different attentional focus. Unsupervised clustering techniques may be applied to this dataset.
As we encourage other researchers to test other synchrony metrics or classification paradigms, the MATLAB scripts and physiological data reproducing the results in this study are publicly available on https://github.com/ivostuldreher/physiological-synchrony-selective-attention.
5. Conclusion
In this study we monitored EEG, EDA and IBI responses and assessed physiological synchrony within and between groups, that were either instructed to focus attention on an audiobook or on interspersed auditory stimuli. We showed that PS in neural and autonomic measures reflects selective attentional engagement. Out of the complete set of measures, EEG showed the best results, with strong group-level differences and correct identification of the selective attentional focus in 96% of the cases. PS in EDA and IBI also showed good results, with significant group-level differences in EDA and classification accuracies of 73%. Even when only data was included coming from 'audiobook only' time intervals, classification performance was above chance level for EEG and IBI, though not for EDA. The level of synchrony toward the groups also predicted performance on post-stimulus questions reflective of paid attention. Our results support that synchrony in physiological responses with others reflects selective attentional engagement. To our best knowledge this is the first time PS has been monitored in neural and autonomic measures concurrently. The relatively high classification accuracies with the use of PS in EDA and IBI are convenient from a user perspective and should enable researchers to monitor PS in autonomic measures in situations where intrusive neural measurements are not suited. However, as each modality performed relatively good in specific stimulus conditions, we also have the ambition to combine the physiological measures into a multimodal index of PS. Work in this area may lead to applications for evaluating educational material or provide feedback to educators or other types of presenters in real time.
Acknowledgments
We thank Ana Borovac for all the help while performing the experiment. This work was supported by The Netherlands Organisation for Scientific Research (NWA Startimpuls 400.17.602).