Abstract
We report a comprehensive study of the defects in room-temperature ferromagnetic (RTFM) Cu-doped ZnO thin films using x-ray absorption spectroscopy. The films are doped with 2 at.% Cu, and are prepared by reactive magnetron sputtering (RMS) and pulsed laser deposition (PLD), respectively. The results reveal unambiguously that atomic point defects exist in these RTFM thin films. The valence states of the Cu ions in both films are 2+. In the film prepared by PLD, the oxygen vacancies (VO) form around both Zn ions and Cu ions in the hexagonal wurtzite structure. Upon annealing of the film in O2, the VO population reduces and so does the RTFM. In the film prepared by RMS, the VOs around Cu ions are not detected, and the VO population around Zn ions is also smaller than in the PLD-prepared film. However, zinc vacancies (VZn) are evidenced. Given the low doping level of spin-carrying Cu ions, these results provide strong support for defect-mediated ferromagnetism in Cu-doped ZnO thin films.
Export citation and abstract BibTeX RIS
Much theoretical and experimental effort has been committed worldwide to research into room-temperature ferromagnetism (RTFM) reported in semiconducting or even insulating, oxides such as TiO2 [1–3], ZnO [4, 5], and SnO2 [6, 7] doped with a few per cent transition metal ions. Among these systems, 3d-ion doped ZnO in forms of either thin films [4] or nanoparticles [5] are most popular. Doping with V, Cr, Mn, Fe, Co, Ni, or Cu has been reported [8]. The RTFM found in copper-doped ZnO has the least possibility of resulting from second phases such as CuO and/or Cu2O since they are not ferromagnetic [9]. Yet there is no lack of controversy. Significantly different RTFM strengths are reported in the samples with the same amount of Cu doping by different groups [10–12]. In most cases, the RTFM decreases with increased copper doping [10, 13–15]. Such variations are caused in part by the second phase formation as shown by Ma et al [15], where the magnetic moment per Cu atom decreases as a function of the amount of the CuO phase. Contrary to the theory proposed by Dietl et al [16]. that the hole-mediated coupling between spin polarized transition metal ions is responsible for the ferromagnetism, doping types appear to be nonessential since RTFM is also observed for n-type ZnO samples [13]. Moreover, in the case of Cu-doped ZnO where Cu ions have a valence state of 2+, the Cu doping in ZnO is isovalent, a priori, providing no carriers [17].
One study using x-ray magnetic circular dichroism (XMCD) in Cu-doped ZnO thin films did not detect any significant spin polarization on the Cu 3d and O 2p states, although the samples showed RTFM and were free of contamination [18]. Recently, using soft XMCD, Herng et al reported direct evidence of the RTFM in O-deficient Cu-doped ZnO films deposited by pulsed laser deposition (PLD) [19]. The double-exchange coupling between oxygen vacancies (VO) and copper impurities was proposed as the origin of the RTFM in these films. Prescription of the electronic structure around FM-related Cu ions, such as the 3d10-like configuration, is in agreement with the findings reported by Ma et al using Cu K edge x-ray absorption spectroscopy (XAS) [15]. In the Cu K edge data, it manifested itself only as a result of strong screening of the copper 1s core hole on the Cu2+ ion that lowers the energy of the 4p orbital. Rather than being interpreted as a charge transfer within the Cu–O bond [15], the interplay between the Cu2+ ion and the VO is attributed to produce the 3d10-like configuration [19]. Later in this paper, it will be shown that such an electronic configuration is likely associated with VO.
Shortly after [19], a study using XPS and XAS including XMCD on 2.2% Cu-doped ZnO nanowires concludes that the ferromagnetic interaction comes from the Cu2+ and Cu3+ states in the bulk part of the nanowire and suggests that the hole doping plays an important role in the ferromagnetism since the Cu3+ state is a Cu2+ state plus an oxygen p hole [20]. It is estimated that only 1 at.% Cu doping is ferromagnetic active. The coexistence of the Cu2+ and Cu3+ states in Cu-doped ZnO films was also reported by Thakur [21]. However an important aspect of the sample studied in [20] was not considered, i.e., a large amount of defects in the sample as described in detail by Xing et al [22], which dramatically enhanced the RTFM.
In recent years, the roles of defects, oxygen [23, 24] or cation [25] vacancies, interstitials [26], and strain [27], have drawn increasingly attention in the observed RTFMs [17]. Since super-exchange or double-exchange interactions cannot produce long-range magnetic order at concentrations of magnetic cations of a few per cent, Coey et al described the potential role of oxygen vacancies in the RTFMs of this category of materials [28], where 'ferromagnetic exchange is mediated by shallow donor electrons that form bound magnetic polarons (BMPs) which overlap to create a spin-split impurity band'. 'High Curie temperatures arise only when empty minority-spin or majority-spin d states lie at the Fermi level in the impurity band'. However, cation vacancies are also energetically favorable in ZnO, depending on the Zn partial pressure [29]. Density functional theory calculations for undoped ZnO films and nanowires suggest that Zn vacancies induce magnetic moments on neighboring O atoms which are responsible for the observed magnetism [30]. Calculations on undoped or doped SnO2 yield similar results [6, 7].
Although there is indirect evidence and theoretical calculations [22, 29], that indicate that doping induces point defects [31, 32], direct evidence of either oxygen or cation vacancies in dilute magnetic oxides (DMO) is scarce. Here, we present x-ray absorption spectroscopic characterization of Cu-doped ZnO films prepared by the PLD and reactive magnetron sputtering (RMS) techniques, respectively. With atomic details, these results provide the direct experimental evidence of defects in these films. For one film, the VOs next to both Cu and Zn ions form and the reduction of the VO population by annealing is also found. For the second film, in addition to the VOs next to Zn ions, zinc vacancies (VZn) are also deduced.
One 2 at.% Cu-doped ZnO film was deposited on a sapphire (0001) substrate in O2 ambient by the RMS of highly pure (99.99%) metallic zinc and copper targets by using dc and rf power sources at room temperature [11]. The thin film was then annealed ex situ in ambient environment at 500 °C. The film's doping type is unchecked. It will be denoted as RMS-film. The second 2 at.% Cu-doped ZnO film was grown on a sapphire (0001) substrate by the PLD in the temperature range of 600–650 °C and at a pressure of 10−6 Torr [12]. The film's doping is n-type. This sample was then divided into two parts. One was kept as deposited and the other was annealed at 600 °C in O2 ambient [33]. The film composition was checked by secondary ion mass spectroscopy. They are denoted as PLD-film and a-PLD-film, respectively. Both the RMS-film and PLD-film have a nominal thickness of 500 nm and the hexagonal wurtzite ZnO structure with the c-axis preferred orientation. The RMS-film is insulating with a resistivity of 300 Ω cm [11, 34] while the resistivity is ∼10 Ω cm for PLD-film [12]. The film thickness and compositions were indicated to be similar by the amounts of Cu and Zn Kα fluorescence emissions. Detailed characterizations of these films using other techniques can be found in the original reports [11, 33, 12]. Figure 1 displays magnetic measurements using SQUID magnetometry after correcting for the substrate contribution. More details on magnetic data are provided in the supporting info (available at stacks.iop.org/JPhysCM/24/306002/mmedia). The M–H curves indicate ferromagnetic ordering at room temperature for both films. The large values of the magnetic moment, M (μB /Cu ), at 300 K indicate that Tcs of these films are well above room temperature. M = 0.5 μB/Cu for RMS-film and M = 0.8 μB/Cu for PLD-film. Note that for the PLD-film the M value decreases upon thermal annealing in O2 ambient (figure 1b). In the case of the RMS-films, the M value decreases with increased copper doping (figure 1a), which is caused by CuO phase formation (figure S1 in supporting info available at stacks.iop.org/JPhysCM/24/306002/mmedia).

Figure 1. (a) M–H loops at 300 K for the ZnO:xCu (x in at.%) films prepared by RMS. Inset: magnified view of M–H curve at low magnetic field. (b) M–H loops at 300 K for ZnO:xCu (x = 2 in at.%) films prepared by PLD. The as-deposited film and the annealed film originate from one single sample which is cut into two pieces. See [11, 12, 33] for more details on magnetic measurements.
Download figure:
Standard imageX-ray absorption measurements around the Cu and Zn K edges were carried out at the 5BM-D beamline of DND-CAT, at the Advanced Photon Source (APS), Argonne, IL. The sample was mounted on a spinner vertically so that its surface normal is in the horizontal plane with the x-ray polarization direction. The sample spins during data collection to minimize Bragg diffraction from the sapphire substrate. Polarization-dependent x-ray absorption measurements were realized by changing the x-ray incident angle θ, that is, by rotating the sample around the axis perpendicular to its surface normal and the x-ray beam. X-ray absorption near edge structure (XANES) and extended x-ray absorption fine structure (EXAFS) measurements were obtained by recording the Cu Kα and Zn Kα emission intensities using a 13-element Ge detector (Canberra). A double crystal Si(111) monochromator was used for energy selection with ΔE/E = 1.4 × 10⁻⁴. The monochromator is water cooled and driven by a servo motor and a McClennan controller with an angular resolution of 5 × 10⁻⁵ degree. The monochromator is extremely stable, and the position errors are limited to the resolution which is < 0.1 eV around Cu and Zn K edges. The incident x-ray intensity was detuned by 70% of its maximum for harmonic rejection as monitored by an ionization chamber (Oxford Danfysik).
X-ray absorption measurements at the O K edge were carried out at beamline 4ID-C at the APS in total fluorescence yield mode. The samples were vertically mounted on a sample holder in the UHV chamber. For the given film thickness, the O Kα emission from the substrate is minimum regardless of θ. The details on the beamline can be found elsewhere [35].
ZnO powder with wurtzite structure was measured in transmission mode using the ion chambers. The powder sample was spread on Scotch tape, which then was folded a few times. The absorption jump step is ∼0.5. The uniformity of the sample was carefully checked using a small x-ray beam (0.25 mm2) to scan over the measured area (2 × 14 mm2) and recording the transmitted intensity. The variation of the ratio of the peak-to-valley difference to their arithmetic mean equaled 1%. The ratio of the standard deviation to the arithmetic mean equaled 0.26%. The extracted EXAFS spectrum matches previously published data measured in fluorescence mode [36]. Using bulk structure, the amplitude reduction factor  due to many-body effect [37] is determined to be 0.94 ( ± 0.02), which agrees well with previously reported values [38]. A CuO powder sample was prepared similarly and measured in transmission mode for which
  .
.
Figure 2 shows the Cu K edge XANES spectra and their first derivatives, as a function of θ for the RMS-film and PLD-film, respectively. Also displayed is the CuO data. Peak assignments follow Shadle et al [39]. For bulk CuO in which the copper ion has a 3d9 configuration, the XANES shows a characteristic prepeak (crudely denoted as 3d) and a ligand–metal charge transfer peak (LMCT) due to the final state screening of the 1s core hole. The screening in CuO arises from itinerant electrons within the Cu–O bond [39]. Clearly, the 3d peak is found in both films, and moved to lower binding energies by about 1.7 eV. This is likely due to the differences in the local symmetry between a planer [CuO4] in CuO and a tetrahedral [CuO4] that is consistent with the Cu substitution of Zn in the wurtzite ZnO structure. The LMCT feature of RMS-film shows little polarization dependence, and coincides with that of CuO in position, suggesting a screening mechanism similar to that in CuO. The valence state of Cu ions is readily assigned to be 2+. On the other hand, the rising edge of PLD-film after the 3d peak starts at lower energies (∼3.5 eV), and shows a strong polarization dependence, being stronger with increasing θ. This rising edge is close in position to the Cu K edge measured on Cu2O (i.e., Cu1+ with 3d10). However, the existence of the 3d peak indicates that the Cu ion in the PLD-film also has a valence state of 2+, while the early rising edge is a LMCT feature. This spectral characteristic was also reported in [15] for Cu-doped ZnO films, where a detailed analysis is given. Here, it will be shown that excess screening is likely associated with the VO around Cu ions.
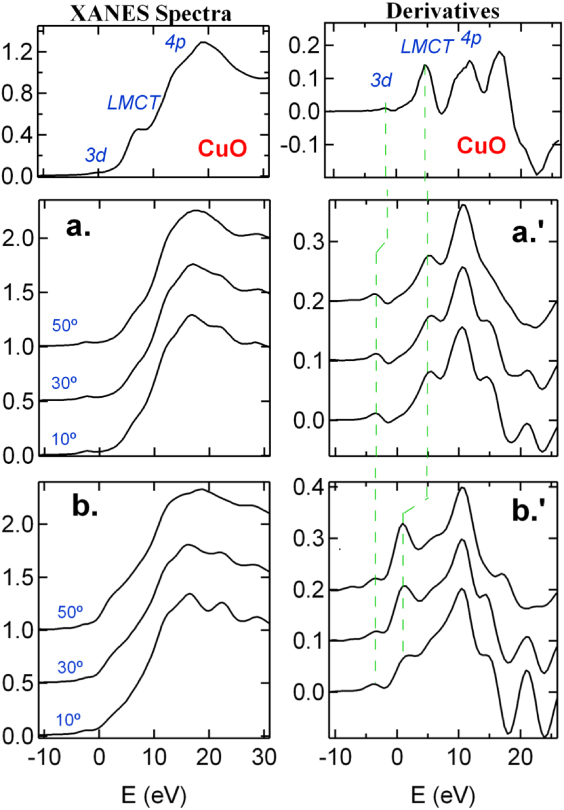
Figure 2. Polarization dependence of the Cu K edge XANES spectra measured on Cu-doped ZnO films prepared by RMS ((a)/(a')) and PLD (b)/(b'), and their first derivatives. Bulk CuO is also presented for comparison. The dashed lines indicate the features of the same origins. E = 0 refers to the onset of the copper K edge (8978.9 eV).
Download figure:
Standard imageFor both films, the θ anisotropy in the XANES above the 1s–4p transition is typically seen in the Zn K edge XANES of the  -axis oriented ZnO films, which is well understood [40]. This again suggests that the Cu ions occupy the Zn sites in the films. Moreover, the XANES features in the RMS-film are more rounded than those in the PLD-film. This is also the case for the Zn K edge XANES data (see figure S2 in Supporting Info for the details available at stacks.iop.org/JPhysCM/24/306002/mmedia).
Phase-uncorrected Fourier transforms (FTs) of the Cu and Zn K edge EXAFS spectra for both films are shown in figure 3. Also shown are the data (dash lines) for the a-PLD-film. Since the data collected at three θ angles are visually similar for the RMS-film and for the Zn K edge data of the PLD-film, only one FT curve per edge is shown. In contrast, the Cu K edge data of the PLD-prepared films show a large θ dependence. With increasing θ, a peak (*) near 2 Å increases in intensity and its position corresponds to none of those found in either CuO or Cu2O, but is close to the Cu–Cu bond (2.55 Å) in bulk Cu. Simple analytical analyses using the back Fourier transform technique suggest that it is primarily a Cu–O interaction in nature at ∼2.6 Å,7 as displayed in figure 3(c). Annealing causes this peak to shift downward by ∼0.2 Å and drop substantially in amplitude. This result reveals oxygen in the interstitial region or interacting with Cu at a larger distance along the basal plane. The structural changes around Zn ions due to annealing are seen for all θ angles which is likely associated with uptake of oxygen (figure 3(b) and figure S2 available at stacks.iop.org/JPhysCM/24/306002/mmedia).
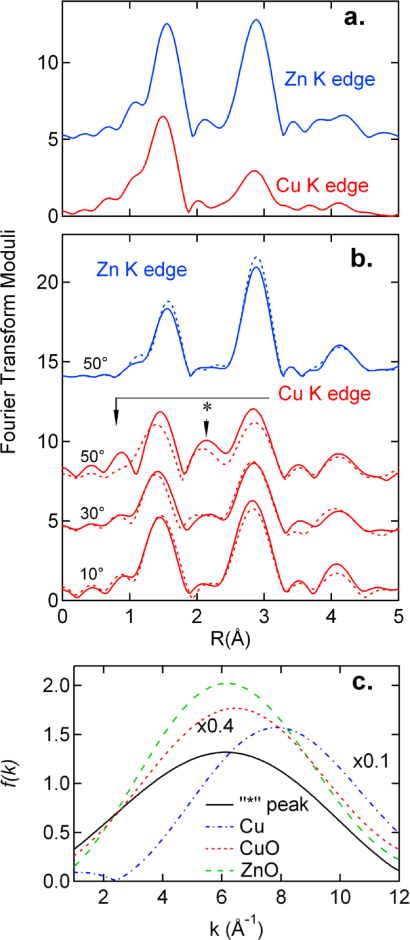
Figure 3. Phase-uncorrected Fourier transforms (FTs) of the Cu K edge and Zn K edge EXAFS data for the RMS-film (a) and the PLD-film (b). The data range from 2.5 to 12 Å−1 was used in the FTs. In (b), the full lines indicate the data measured on the as-deposited film, and the dashed lines indicate the data measured on the annealed film. See supporting information (available at stacks.iop.org/JPhysCM/24/306002/mmedia) for raw EXAFS data. (c) The backscattering amplitudes for the '*' peak (full line) in (b), Cu–Cu bond in bulk copper (dash–dot line), Cu–O bond in bulk CuO (short dash line), and Zn–O bond in the PLD-film (dash line).
Download figure:
Standard imageTable 1 gives some of the structural parameters for Cu–O and Zn–O bonds derived from EXAFS modeling using the Artemis package based on the FEFF8 code [41]. In the data fitting, only  is fixed. Note that the coordination numbers around Cu ions (NCu−O) will be larger by ∼15% than those in table 1, if
  for bulk CuO is used for the central Cu absorber, since
  [37]. The σ2 of the Cu–O bonds, root mean square (rms) deviation of bond distances, is considerably larger than that of the Zn–O bonds in both films. Therefore, the first shell structure around Cu ions is more than twice as disordered as that around Zn ions (
 –0.086 Å). For the PLD-film, the NCu−O values at 50° are smaller (by about one atom) than those at other angles. After annealing, NCu−O increased appreciably (by 30%), concurrent with the decrease in magnitude of the interstitial oxygen peak (∼20%). It is thus likely that some oxygen is located interstitially, creating vacancies next to Cu. Such an arrangement may produce the satellite peak at < 1 Å, seen clearly for the PLD-film at 50°, by the excessive scattering near the atomic edge due to the existence of oxygen vacancies [42, 43]. It is also diminished by annealing. The excess charge may account in part for the strong 1s core hole screening observed for the PLD-film. For the RMS-film, Cu ions are fully coordinated (NCu−O ∼ 4@50°, see discussion below), and the oxygen vacancies around Cu ions should be small, if any.
Table 1. Structural parameters for the first coordination around Cu and Zn.
| R (Å)a | N(θ)Cu −O b | ||||
|---|---|---|---|---|---|
| Samples | Zn–O | Cu–O | σ2 ( × 10−4 Å2) | 10°/30°/50° |

|
| Bulk ZnO | 1.96 | 43 | 4 | 0.94 | |
| Bulk CuO | 1.95 | 37 | 4 | 0.80 | |
| ZnO:Cu | 1.96 | (33 ± 7) | |||
| (RMS-film) | 1.93 ± 0.02 | (91/75/78) | 3.5/3.6/3.7 | 0.94 | |
| ZnO:Cu | 1.97 | (36 ± 7) | |||
| (PLD-film) | 1.94 ± 0.02 | (90/110/22) | 3.4/3.2/1.7 | 0.94 | |
| (a-PLD-film) | — | (77/120/100) | 3.3/3.2/2.4 | 0.94 | |
aThe third comulant effect on bond distances is considered. bSee figure 4 for N(θ)Zn−O; the Cu K edge results for PLD-film are confirmed by analytical analyses. CN@50° for as-deposited film is ∼55% of that @10° with Δσ2 = 0.004 Å2 (see supporting info available at stacks.iop.org/JPhysCM/24/306002/mmedia), while CN@50° for annealed film is ∼71% of that @10° with Δσ2 = 0.009 Å2.
The differences in the local structures around Zn ions are also appreciable (figures 3(a) and (b)). For the RMS-film, the first peaks around Zn ions appear to be larger, but the second peaks are much attenuated. For the PLD-film, the ratio of the first and second peaks of the Zn K edge data is visually similar to that of ZnO [15]. Figure 4 shows the θ-dependence of NZn−O for both films together with model simulations. NZn−O increases towards the coordination in wurtzite ZnO (or N = 4) at the so-called magic angle (θ = 54.7°) for a  -axis textured film [44, 45]. The simulations are obtained using a tetrahedron [ZnO4] and one with one oxygen vacancy [ZnO3], i.e., V O = 1. To the polarized x-ray beam, each oxygen vacancy is probed at two projections: in the basal plane and along the
  axis, which is averaged in the calculations (see figure 4). Three bond angles are used, among which β = 111° is chosen according to the detailed work by Albertson et al [46] who reported that in the wurtzite ZnO, the bond angle between the Zn–O bonds in the basal plane and the one perpendicular to the plane is 108.14°. Therefore, the bond angle in the basal plane is ∼111°. The solid lines in figure 4 are obtained based on this off-sp3 configuration. Although the models are crude, modeling does unambiguously suggest the existence of oxygen vacancies around Zn ions in these films. For the simulations (gray band) presented in figure 4, x ranges from 0.4 to 0.6 which implies a composition of Cu0.02Zn0.98Oγ, since each oxygen vacancy introduces four 3-fold coordinated Zn atoms, where γ ( = 1 − x × 0.25) ranges from 0.85 to 0.9. After annealing in O2, there is a slight increase of ∼0.2 in NZn−O that is systematically seen at all angles, which is comparable to the error bar ± 0.2 (see figure S3 in supporting information available at stacks.iop.org/JPhysCM/24/306002/mmedia for more data and analyses). For a change of +0.2 in NZn−O, the oxygen vacancy concentration will be reduced by ∼30–40%. As shown in figure 4, the VO around Zn ions in RMS-film is significantly smaller than in PLD-film.

Figure 4. Simulations of the measured coordination numbers as a function of x-ray incident angle θ for the Cu-doped ZnO films with the  -axis orientation. The margin of error for the coordination numbers are estimated from the FEFF fittings under various conditions, namely, the fitting of the first neighbors only and the fitting including the peaks up to the third neighbors. The model simulations for a sp3 tetrahedron with β = 109.5° (dashed line), off-sp3 tetrahedron with β = 111° (solid line), and off-sp3 tetrahedron with β = 113° (dash–dot lines). Blue curves for a: [ZnO4]; red and green curves for b' and b'': [ZnO3], i.e.,V(O) =1. The gray band covers y = xb + (1 − x)a with 0.4 ≤ x ≤ 0.6 for β = 111°, where b = (b' + b'')/2. β is the bond angle within the basal plane. Black dashed line is x = 0.4 for β = 109.5° and black dashed line is x = 0.6 for β = 113°.
Download figure:
Standard imageTo better understand the main spectral characteristics, the XANES calculations are carried out based on wurtzite ZnO structure using the FDMNES code [47]. The crystalline structure of ZnO is hexagonal (space group C6mc, with a = b = 3.2495 Å, c = 5.2069 Å). It can be viewed as alternating oxygen and zinc planes stacked up along the  -axis, i.e., 〈0001〉. Both Zn2+ and O2− ions are four-fold coordinated with a quasi-sp3 configuration, and therefore, the structure is non-central symmetric. The FDMNES code is developed based on dipolar approximation, both with the full-multiple-scattering (FMS) approach and with the finite difference method (FDM) approach, respectively. The FMS utilizes the spherical muffin-tin (MT) approximation to atomic potentials, whereas the FDM, a non-muffin-tin (NMT) approach, sets atomic potentials on an equally spaced 3D-grid with V = 0.25 × 0.25 × 0.25 Å3. The FDM approach is thus sensitive to variations in atomic potentials. The FMS calculation, however, is rapid. The results presented here are mostly obtained with the FMS method on a spherical cluster of 12 Å in diameter, and verified with the FDM method on a spherical cluster of 8 Å, occasionally 10 Å [48].
Figure 5 presents the calculations for O K edge (a), Cu K edge (b) and Zn K edge ((c) and (d)), compared with the experimental data, respectively. For the O K edge of the RMS-film, the spectral features are rounded off due to disorder in the local structure. Also, a pre-edge feature (*) appears near the conduction band minimum (CBM) and lowers the CBM by ∼0.6 eV. Similar features were also reported for some of Cu-doped ZnO films by Thakur et al [21], and for other TM-doped ZnO films, which were attributed to oxygen vacancies [49], impurity doping [50], or near-surface aggregates of transition metal ions [51]. As shown in figure 5(a), calculations with the first neighbor configuration [OZn4] (or [OZn4]⋅ZnO), satisfactorily produce the O K edge results, except for the pre-edge feature for the RMS-film. When the calculations involve one zinc vacancy (VZn) next to a central oxygen [OZn3]2+ (or [OZn3]2+ ⋅ZnO) a prominent peak near the pre-edge position is produced while the 3p peak is attenuated (see figure S5 in supporting info available at stacks.iop.org/JPhysCM/24/306002/mmedia). A mix of [OZn3]2+ with [OZn4] reproduces overall the O K edge results including the pre-edge feature in the RMS-film. The influence from either VO or VZn away from the first coordination is negligibly small. This result suggests that VZn may be responsible for the pre-edge feature, i.e., unoccupied states, in the RMS-film.
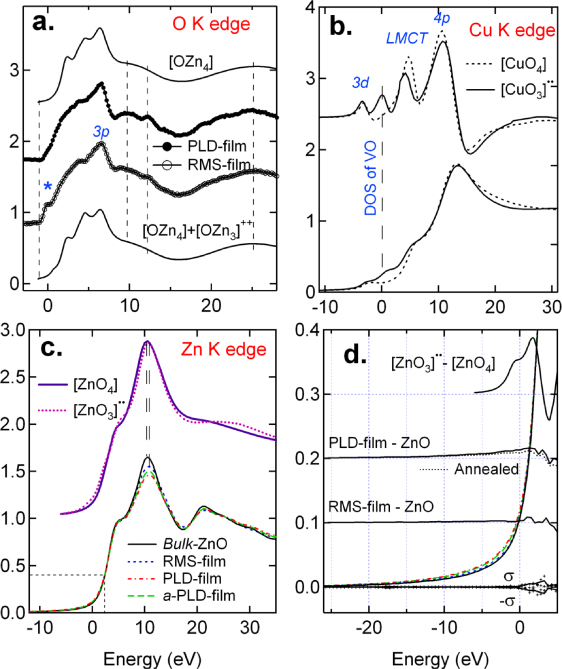
Figure 5. Calculations of O K edge (a), Cu K edge (b) and Zn K edge ((c) and (d)) XANES, respectively and direct comparison with experimental spectra in the cases of O K edge and Zn K edge. The experimental spectra presented here are measured at the x-ray incidence angle of θ = 50 Å. (a) O K edge XANES: the FMS-calculated curves for a cluster of R = 6 Å are for the defect-free [OZn4] and its mix with [OZn3]2+ (0.84[OZn4] + 0.16[OZn3]2+). (b) The FDM calculations of Cu K edge XANES and their first derivatives for the defect-free configuration [CuO4]⋅ZnO and the [CuO 3]⋅ZnO one, respectively, in the wurtzite structure with R = 4 Å. The results may be compared with figure 2. (c) Zn K edge XANES and the FMS calculations of the defect-free [ZnO4] and one VO to the central Zn, [ZnO3]⋅⋅. (d) Enlargement of the CBM regions of Zn K edge XANES. Also shown are the difference spectra of calculated and experimental results versus ZnO. ± σ is the standard derivation of the uncertainty in the monochromator motions.
Download figure:
Standard imageCalculations of the Cu K edge XANES are more challenging. Three major features, i.e., 3d, LMCT, and 4p, are reproduced satisfactorily with the first neighbor configuration [CuO4] (or [CuO4]⋅ZnO) (figure 5(b)), which agrees with the Cu K edges of CuO and the RMS-film (figures 2(b)–(b ')). Introducing one VO next to a central Cu recreates the density of states (DOS), and induces a small downward shift, not a large one (figures 2(b)-(b')), of the LMCT feature. Clearly, the excess 1s core hole screening due to VO and delocalization nature of the excess charge are unaccounted.
The lower part of figure 5(c) shows the Zn K edge XANES measured on bulk ZnO and at θ = 50° on the films. The spectra were normalized to the edge jump using the data up to 1000 eV above the absorption edge. It can be seen that the whiteline intensity varies as bulk ZnO > RMS-film >a-PLD-film > PLD-film. This is consistent with the decrease of NZn−O in the same order that results from VO. Calculations of the Zn K edge XANES show that the VOs induces the excess DOS in the CBM region (upper part of figure 5(c)). Careful examination of the CBM regions of the experimental spectra (dashed box) reveals some noticeable differences in the DOS's as well, as shown by an enlargement of this region in figure 5(d) (see supporting information available at stacks.iop.org/JPhysCM/24/306002/mmediafor more discussions). Assuming a perfect wurtzite structure for bulk ZnO, the difference spectra versus ZnO are calculated, the CMB regions of which are shown in figure 5(d). Also shown is the calculated one as well as the standard derivation, σ, of the uncertainty in the monochromator motions. The s interferes little with the experimental results. The changes in the difference DOS's are consistent with the results shown in figure 4 on the VOs, and even the annealing effect is accounted for, i.e. the reduction of the VO-related DOS by annealing. From the θ dependence of NZn−O, the changes in the whiteline intensities, to the excess DOS's in the CBM region, it is determined that the VOs form in these films, with VO (PLD-film) > VO (RMS-film).
In summary, atomic point defects are experimentally determined by x-ray absorption spectroscopy in the RTFM Cu-doped ZnO thin films. Theoretical calculations of the absorption edge structures and modeling of the extended absorption fine structures present a coherent, unambiguous description of these defects around the Zn, Cu and O ions. It is shown that oxygen vacancies form in the PLD-film and that upon annealing in O2, the VO population reduces, as does the ferromagnetism. The existence of the VOs next to Cu ions may induce excess scattering near the atomic edge, which aids in screening of the 1s core hole. Although the electronic configuration of the copper impurity in this film is 3d9, it appears 3d10–like as also described by Herng et al [19] For the RMS-film, while the VOs next to Cu ions are not detected, the electronic configuration of the Cu ion is typical 3d9, and zinc vacancies are evidenced around O ions. Moreover, if VOs exist next to Zn ions, their population is significantly smaller than that in PLD-film. Therefore, the ferromagnetic exchange in the RMS-film is likely mediated through cation vacancies, if point defects play a role in the RTFM.
Both the VO and VZn induce unoccupied states of primarily 2p–3d character [21], and generate charge carriers, which may be holes at the oxygen site [52, 53], revealed by O K edge data and may be electrons at Cu or Zn sites as revealed by Cu and Zn K edge data. These results unmistakably illustrate that point defects, either VO or VZn, are playing an essential role in the RTFM observed in Cu-doped ZnO, in particular, and in dilute magnetic oxides, in general.
Acknowledgments
x-ray absorption spectroscopy experiments are carried out at the DND-CAT located at Sector 5 of the Advanced Photon Source (APS). DND-CAT is supported by E I DuPont de Nemours & Co., The Dow Chemical Company and the State of Illinois. Use of the APS was supported by the US Department of Energy, Office of Science, Office of Basic Energy Sciences, under Contract No. DE-AC02-06CH11357. CS acknowledges G Lawes at Department of Physics and Astronomy, Wayne State University for magnetic measurements.
Footnotes
- 7
Estimated from
 , n = 1,2,3,... order of the beat nodes.