
Abstract
ESA and NASA recently selected two 5 μm cutoff Teledyne H2RG sensor chip assemblies (SCA) for flight on the James Webb Space Telescope (JWST) Near Infrared Spectrograph (NIRSpec). These HgCdTe SCAs incorporate Teledyne's "improved barrier layer" design that eliminates the degradation that affected earlier JWST H2RGs. The better indium barrier, together with other design changes that Teledyne phased in from other programs over the years, has improved the performance and reliability of JWST's SCAs. In this article, we describe the measured performance characteristics that most directly affect scientific observations including read noise, total noise, dark current, quantum efficiency (QE), and image persistence. As part of measuring QE, we inferred the quantum yield over the full NIRSpec pass band of λ = 0.6–5 μm and found that it exceeds unity for photon energies Eγ > (2.65 ± .2)Eg, where Eg is the HgCdTe bandgap energy. This corresponds to λ ≲ 2 μm for NIRSpec's 5 μm cutoff HgCdTe.
Export citation and abstract BibTeX RIS
1. Introduction
ESA and NASA recently selected two 5 μm cutoff Teledyne HgCdTe H2RG SCAs for flight on the JWST NIRSpec. These are the two "best" H2RGs out of eight candidates that were available. The new H2RGs incorporate Teledyne's "improved barrier layer" design to eliminate the degradation that affected older JWST H2RGs (Rauscher et al. 2012b). They also incorporate a few other design changes that have reduced the read noise and crosstalk compared to previous JWST H2RGs.
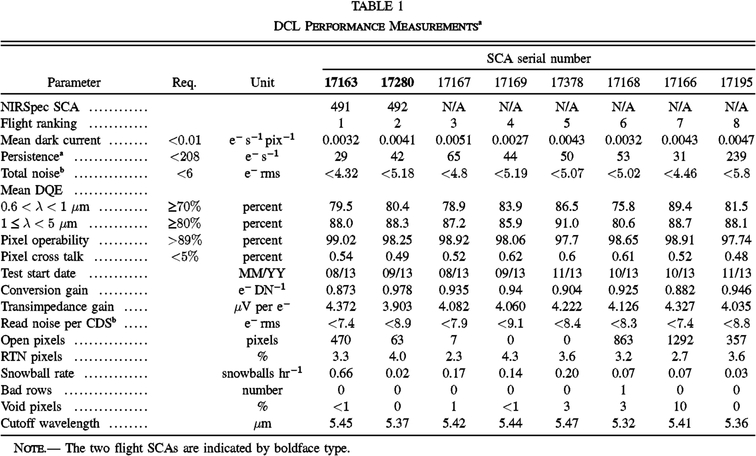
To qualify the new design, NASA and Teledyne conducted extensive destructive physical analysis, environmental testing, and accelerated life testing (Rauscher et al. 2012b, 2013b). Our focus here is on the performance testing. Section 2, and especially Table 1, present the flight selection performance results. These show that the new flight parts generally meet NIRSpec requirements5 with margin. We believe that this performance represents today's state-of-the-art for 5 μm cutoff H2RGs. Section 2 discusses the summary table and performance measurements in more detail.
 |
To provide insight into the pool of available NIRSpec SCAs, we provide detailed information for the six "flight candidates" that were not selected, as well as the two SCAs that were. Of the eight NIRSpec SCAs that passed Teledyne's screen testing (the "flight candidates"), two were deemed flight grade, another two were almost as good and are currently "flight spares", three had minor issues of one kind or another, and one had anomalously bad persistence. The Teledyne screen testing was designed to eliminate parts with severe problems such as large photoemissive defects. Detailed performance characterization testing was done in the Goddard Detector Characterization Laboratory (DCL). In addition to the eight "flight candidate" SCAs that we report on here, there were a few others that failed screen testing. Of the parts that passed screen testing, at least one quarter are considered flight grade.
When energetic short-wavelength photons interact with the HgCdTe, they can create more than one electron-hole pair per incident photon. As part of measuring the QE, we used the measured responsive quantum efficiency (RQE) values to infer the quantum yield, Φ, as a function of photon energy. We found that the onset threshold for Φ > 1 is about 2.65 ± .2Eg, where Eg is the bandgap energy. This corresponds to about 2 μm for a JWST 5 μm cutoff SCA. Section 3 describes these results, which are in good agreement with a previous measurement by McCullough et al. (2008) for λ = 0.94–5 μm. For λ = 0.6–0.94 μm, we show that Φ continues to be well behaved and that Φ increases with photon energy in a manner similar to other semiconductors.
Now that the performance of the new H2RGs is known, the flight SCAs are being built into a new focal plane assembly (FPA) at NASA Goddard Space Flight Center and Exelis in Rochester, New York. The FPA will in turn be integrated with a pair of System for Image Digitization, Enhancement, Control, and Retrieval (SIDECAR) ASICs for H2RG control, focal plane electronics (FPE) for SIDECAR and thermal control, and assorted harnesses and software to form a new "NIRSpec detector subsystem". We will characterize the complete NIRSpec detector subsystem in the Goddard DCL before integrating it into the NIRSpec instrument.
Our aims in this article are twofold. Firstly, we want to present the measured performance of the two NIRSpec flight SCAs to provide insight into the quality of JWST's new H2RG SCAs. We believe that this performance is consistent with today's state-of-the-art. To provide insight into how our flight build went, we also provide detail results for the six H2RGs that were not selected. We hope that this information may prove helpful to others who are planning SCA procurements. Finally, we anticipate that some of the measured characteristics may prove useful to other instrument builders.
A second aim was to present the quantum yield results for the JWST 5 μm cutoff SCAs. Reassuringly, our results are entirely consistent with previous work by McCullough et al. (2008) to within 2% over the wavelength range for which both studies are applicable.
2. Performance Characteristics
The performance testing was done in the Goddard DCL's "purple dewar" using a Gen-III Leach controller. This is the same test setup that we have previously used for NIRSpec testing (Moseley et al. 2010; Mott et al. 2008, 2007; Rauscher et al. 2013, 2012a, 2012b, 2011a, 2011b, 2008, 2007). The purple dewar has a demonstrated dark current floor of < 0.003 e- s-1 for 5 μm cutoff detectors and read noise per CDS floor of < 7 e- rms. The purple dewar can accommodate two SCAs at a time. The SCAs are operated at T ≈ 38.5 K. Temperature was actively controlled to δT < 1 mK over the approximately two week test duration using a Lakeshore temperature controller. Appendix
For many long science integrations, NIRSpec uses a standard "baseline science integration" (BSI). In a BSI, the detector is reset using the the H2RG's enhanced clocking mode with the pixel-by-pixel reset at the nominal frame rate. Following one reset frame, we collect 88 nondestructively sampled up-the-ramp frames at a 10.5472 seconds per frame cadence.6 The resulting integration for the ground testing that is described in this paper is 917.608 seconds. For more information on the NIRSpec readout mode, we refer the interested reader to Rauscher et al. (2007b).
Table 1 summarizes the measured performance versus requirements. The two flight SCAs are SCA17163 and SCA17280. These SCAs comprehensively meet NIRSpec requirements apart from a narrow range of wavelength near the AR coating's minimum transmission where there is a small QE shortfall. In the following paragraphs we describe some of the parameters in more detail. At the end of this section, we explain why these two SCAs were selected for flight.
2.1. Discussion of Individual Parameters
2.1.1. Total Noise
NIRSpec defines total noise as the standard deviation, computed per pixel, in a stack of >40 dark BSIs. The NIRSpec requirement is σtotal < 6 e- rms after reference correction. For flight selection, the SCA was read out single-ended, and the H2RG's reference output was not used. Each BSI (Fig. 1a) produces a FITS datacube containing 88 nondestructive up-the-ramp samples. We compute the integrated signal in each pixel by least-squares fitting a straight line to the 88 up-the-ramp samples. This procedure collapses each data cube into a two-dimensional image (Fig. 1b).
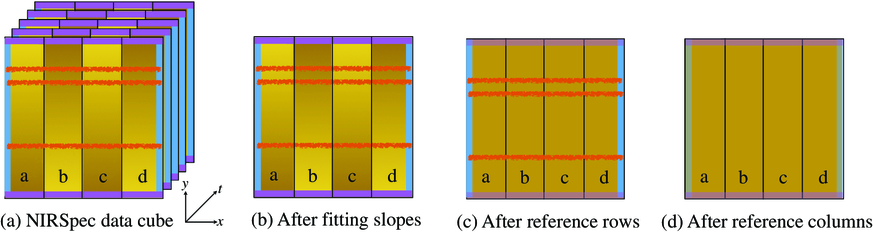
Fig. 1. (a) NIRSpec data packaged as flexible image transport system (FITS) data cubes. The SCA is read out using four video outputs, (a–d). During reference pixel correction, we treat each output separately, and moreover treat the even and odd columns within each output independently. Noise from slow bias drifts is indicated by gold shading from top to bottom on each output. Higher frequency correlated noise, such as faint 1/f bars and banding, is indicated by three horizontal orange bars. The reference pixels in rows are shown in purple at the top and bottom of the SCA. The reference pixels in columns appear in blue along the left and right sides. To compute the two-dimensional integrated signal image (b) we fit a line to the 88 up-the-ramp samples for each pixel. As is described in more detail in the text, "traditional" reference correction consists of two steps. (c) We apply a reference rows correction to remove very slow drifts from output to output. Finally in (d) we average all of the reference columns together, treating even and odd columns separately, and smooth the results using a Gaussian kernel to create mean even and odd reference columns. We subtract these from each column in the image to remove faint high frequency bars and bands within the image area. As shown here, the reference pixels in rows remove the gold shading and the reference pixels in columns remove the faint bars and bands. In practice, the reference pixel correction is never perfect and there is always some residual correlated noise.
For these tests, we used a "traditional" (for astronomy) reference correction scheme (Fig. 1c–d). The H2RG SCA data contain a 2040 × 2040 pixel array of regular pixels that is surrounded on all sides by a 4-pixel wide border of reference pixels. Starting from the integrated signal images of Fig. 1b, we compute the mean value of reference pixels on the "top" and "bottom" of each of the four outputs (treating even and odd columns independently) and fit and subtract an inclined plane between them. This removes very slow drifts between outputs (Fig. 1c), but it leaves in higher frequency noise within frames. To remove the higher frequency correlated noise, we average all eight reference columns together and smooth them using a Gaussian smoothing kernel. We then subtract the smoothed reference column of from each column of the image to remove the faint bars and banding that are characteristic of 1/f noise (Fig. 1d).
In practice, there are many ad hoc ways of using the reference pixels in rows and columns like this, and each group tends to do it differently. We have found that the simple approach that we describe above is close to optimal when one does not have access to (1) the reference output, and (2) one has not measured the statistical correlations between the reference pixels and regular pixels. With the laboratory controller that is used here, the difference between this approach and statistically optimal methods is small. With the flight system that uses Teledyne's SIDECAR ASIC, we plan to use statistically optimal methods. We refer the interested reader to our papers on improved reference sampling and subtraction (IRS2; pronounced "IRS square") for more information on how to optimally use all of the reference information to reject correlated noise (Moseley et al. 2010; Rauscher et al. 2013a, 2012a, 2011a).
2.1.2. Pixel Operability
Pixel operability for science is a NIRSpec–specific parameter. Pixels are flagged as "inoperable" if the total noise is >12 e- rms or the QE deviates by more than 30% from the mean value. Defined in this way, many of the "inoperable" pixels still generate useful information. We anticipate that observers will keep as many pixels as possible, even if some of them are formally considered to be "inoperable".
2.1.3. Pixel Crosstalk
For NIRSpec, pixel crosstalk is the fraction of the signal that appears in each of the four nearest neighbors. For flight selection, we computed crosstalk by examining hot pixel neighbors and well centered cosmic ray hits. Although the cosmic ray hits include charge diffusion, whereas hot pixel neighbors do not, in practice we find that the two methods give the same result to within the uncertainties for these SCAs. Computed in this way, crosstalk is identical to the interpixel capacitance alpha term that Moore et al. (2004) first introduced.
In practice, all functional NIRSpec H2RGs easily meet this requirement. The < 5% required value dates back over a decade, to a time when JWST's H2RG SCAs were still in development.
2.1.4. Open Pixels
An "open pixel" is a pixel that behaves as if it were missing the indium interconnect between the HgCdTe detector layer and the readout integrated circuit (ROIC). Open pixels are particularly troublesome because there is no potential minimum at their pixel location to collect charge. The charge, therefore, collects in neighboring pixels, creating a bright "donut" around the affected pixel. Because of this "donut", each open pixel corrupts about five pixels including itself.
2.1.5. RTN Pixels
Random telegraph noise (RTN) can appear as an almost digital toggling on and off between states in up-the-ramp sampled data (i.e., as if the pixel were sending a message in morse code). RTN is thought to be caused by single charges moving on to and off of isolated quantum defect states in individual pixel MOSFETs. Although RTN can manifest in a great many ways (Bacon et al. 2005), from an observer's perspective it is best thought of as non-Gaussian noise that affects individual pixels. Because of their non-Gaussian noise, RTN pixels will require special handling in the calibration pipeline.
2.1.6. Snowball Rate
Snowballs may well be unique to space missions and others who are in the fortunate position of receiving detectors very soon after they are made. Snowballs appear to be much like an enormous cosmic ray hit, often affecting ∼100 pixels. In JWST, we have found that the snowball rate goes down with time, and moreover the decay rate is consistent with known radioactive isotopes that are used during the SCA fabrication process at Teledyne. By the time JWST flies in 2018, we believe that the snowball rate will be negligible.
2.1.7. Void Pixels
JWST's H2RGs are manufactured using flip-chip hybridization. The ROIC and HgCdTe detector layer are fabricated separately. They are subsequently hybridized using indium bump bonds, and an epoxy is wicked between the bumps to increase the mechanical strength.
During the JWST flight production, we experienced nonuniform epoxy backfill that created voids (see Figs. 2–3). The voids flat field out from science data. Extensive thermal cycling by the JWST project and finite elements modeling by Teledyne show that the voids are mechanically stable with excellent strength margin versus growth. Nevertheless, for NIRSpec we were in the fortunate position of having excellent parts that had very small (or nonexistent) voids. The voids were therefore considered as only one factor among many in ranking the SCAs.
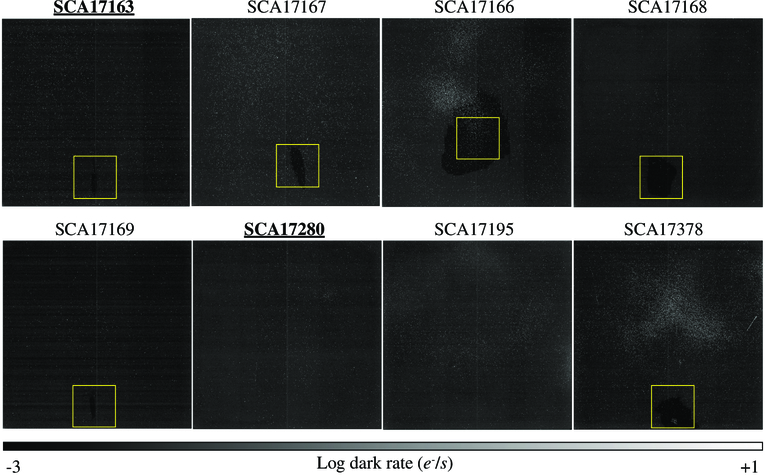
Fig. 2. Dark maps of all eight flight candidates on the same grayscale, with two flight parts indicated (underlined boldface type). Six of the parts had noticeable epoxy voids (box) which encapsulates 5% of the pixelated area.
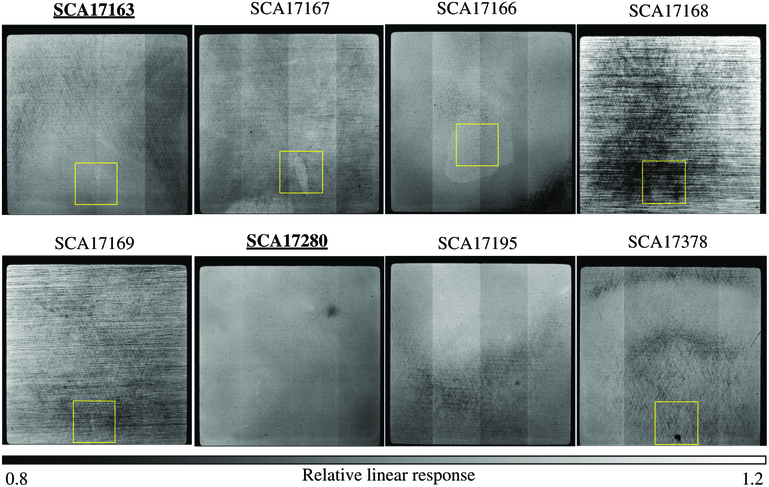
Fig. 3. 2 μm flat-field images of all eight flight candidates with two flight parts indicated (underlined boldface type). Six of the parts had noticeable epoxy voids (box) which encapsulates 5% of the pixelated area. The edges on three sides are vignetted by a field stop in the test setup. Pixels in the vignetted areas appear dark. The flat-field images show faint "crosshatching" (see also § 2.2) caused by dislocation defects in the HgCdTe. These defects, which flat-field out, follow the HgCdTe crystal lattice planes and are inherent in the manufacturing process.
2.1.8. Quantum Efficiency
QE is the probability that an incident photon will promote charge carriers into conduction in the semiconductor. One simple way of measuring QE is to expose the detector to a known illumination stimulus and measure the response. The ratio of the response to the stimulus is the RQE. For energetic short-wavelength photons, which can create more than one electron hole pair in the HgCdTe, RQE tends to over estimate QE. However, QE can be inferred from RQE data if the quantum yield, Φ(λ), is known and divided out from the RQE data.
Figure 4 shows the QE that we inferred from our RQE data for the two flight SCAs. We discuss the quantum yield correction further in § 3. For NIRSpec's 5 μm cutoff HgCdTe, the quantum yield exceeds unity for wavelengths λ ≲ 2 μm.
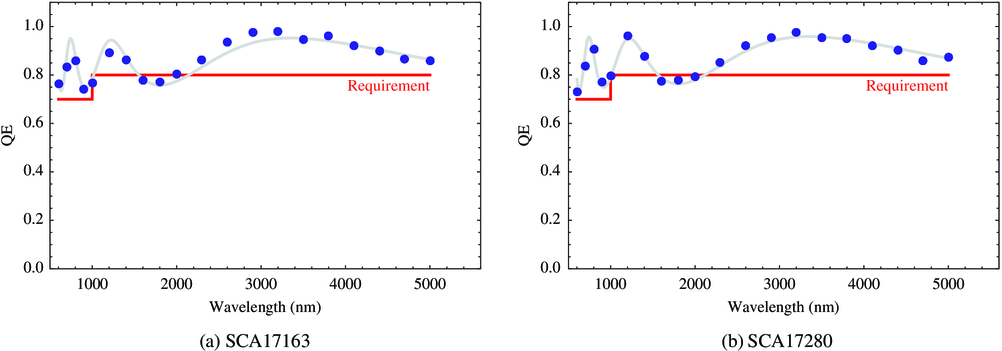
Fig. 4. QE(λ) = RQE(λ)/Φ(λ) for the two flight SCAs. There is about a ± 6% correlated (i.e., systematic) uncertainty on all data points; statistical error bars are about 2.5%. To provide context, we overlay the NIRSpec QE requirements (red) and a two-parameter nonlinear least-squares fit of Teledyne's theoretical AR coating model (gray) (eq. [4] with α and β fixed).
2.1.9. Persistence
Persistence refers to the charge memory from an earlier exposure appearing in the current one. It is important because bright sources in one exposure can affect subsequent exposures by imprinting faint ghost images. Although these can be mitigated in calibration pipelines, good practice dictates choosing SCAs that have minimal persistence.
When the JWST project started working with Teledyne in the early 2000s, we defined a fairly simple "< 0.1% of the previous saturating exposure" persistence requirement and test procedure. We now know that both the requirement and procedure are inadequate because they did not capture all aspects of persistence that are important for scientific observations. Since then, a fairly clear consensus has emerged regarding persistence images in JWST H2RGs.
Testing by the JWST Near Infrared Camera (NIRCam) team shows that persistence has the following properties:
- 1.persistent images do not depend on wavelength of illumination,
- 2.persistent images do not get stronger past ∼3 × saturation,
- 3.persistent images are weaker for 5 μm cutoff detectors than for 2.5 μm detectors,
- 4.taking longer to apply a given level of illumination causes a stronger persistent image than a shorter time, and
- 5.persistent image strength does not depend on whether the illumination is focused or flat field.
Mike Regan of STScI and Roger Smith of CalTech have studied persistence extensively and reached similar conclusions. In addition they find:
- 1.persistence depends on position on the detector (i.e., there is a persistent image pattern), and
- 2.there can be a very long wait following detector bias changes while persistent charge decays away.
Both Smith et al. (2008) and Anderson et al. (2014) report that bias settings can be used to mimic the persistence of H2RG SCAs in the lab. Likewise, in the early 2000s, the DCL characterized persistence for the Hubble Wide Field Camera 3 by varying the DSUB bias voltage of the H1R SCA. We have also found that bias settings can be used to mimic persistence in H2RGs. However, for these SCAs, we believe that there may be some subtle differences between electronic persistence and light persistence that would benefit from further study.
Because persistence results can be highly dependent on the details of how the test is executed, we provide more detail on the persistence procedure than for other procedures. We measured persistence using 10 × saturated λ = 3.4 μm flat-field light. We were careful to use continuous illumination because our own experience, and that of others in the community, has been that long exposures to saturating light cause more persistence than short exposures of the same fluence. Our procedure was as follows:
- 1.Pre-dark test:
- a)Take two sequential 918 s up-the-ramp sampled dark integrations
- 2.10 × full - well illumination:
- a)Turn on the cold 3.4 μm LED.
- b)Adjust the LED current to ≈104 e- s-1 pix-1
- c)Take one 622 s up-the-ramp sampled illuminated integration
- d)Turn off the cold LED
- 3.Post-dark test:
- a)Take 10 sequential 918 s up-the-ramp sampled dark integrations
Figure 5 shows the result for the two flight SCAs. We found that the persistence of all eight flight candidates was well approximated the power law, f(t) = f0/t. All of the parts but one produced persistence curves similar to Figure 5. The one exception was SCA17195 which had anomalously high persistence and a correspondingly larger normalization. The power law index was the same (= -1) as for the other parts. The persistence values shown in Table 1 are the fitted f0 coefficients. These can be thought of as the persistent flux that would be measured one second after resetting the detector following the previous saturating exposure.
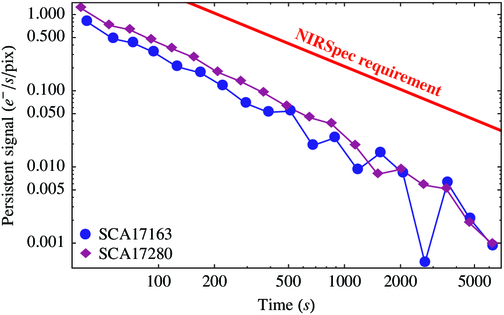
Fig. 5. The persistence of the two flight parts easily meets the NIRSpec requirement (thick red line). For both flight parts, the persistence decay is reasonably well fitted by an ≈1/t power law. The persistence of five other flight candidates was very similar. Only SCA17195, which had anomalously high persistence, failed to meet the NIRSpec requirement. Even SCA17195 followed the simple power law form, only with a higher normalization.
The 1/t form of the persistence curves is reassuring as it says that most traps decay quickly. It arises naturally from a population of exponentially decaying charge traps, for which the initial trap density of specified decay timescale τ is proportional to 1/τ. For present purposes, however, the main point is an empirical one. Persistence in NIRSpec's flight SCAs decays according to a 1/t power law and there is no evidence of any long-time constant persistent tail that would complicate either flight operations or calibration.
2.1.10. Performance Summary
Overall, we believe that the "improved barrier layer" design, taken together with other design improvements that Teledyne has phased in from other programs over the years, has produced better H2RGs than JWST had before. The persistence decays according to a simple power law without any sign of enhanced long timescale persistence. The QE is uniformly about 10% higher than in previous JWST H2RGs, and the shape of the QE curves is consistent with theoretical expectation across the fully NIRSpec bandpass. Finally, the read noise is about 10% lower, and the dark current is at least as good as before. In extensive JWST testing at Goddard, the University of Arizona, and Teledyne, we have not noticed any parameter to be worse in the new SCAs, although many parameters seem to be better. This bodes well for JWST, EUCLID, and WFIRST, all of which plan to use Teledyne HxRG family detectors with the new barrier layers.
2.2. Reasons for Flight Selection
SCA17163 and SCA17280 were selected for flight primarily because they had very low persistence and also because they had comparatively uniform flat-field structure. Other considerations included good overall performance and a desire to minimize void size.
We placed particular emphasis on persistence and flat-field uniformity because these parameters affect calibration complexity. For example, persistence injects position and time dependent correlations into dithered data sets. For NIRSpec, the most concerning type of flat-field nonuniformity is the "crosshatch" pattern that is visible in Figure 3. The crosshatching is caused by a fixed pattern of dislocation defects in the HgCdTe. These are inherent in the manufacturing process. The crosshatching flat fields out. However, because crosshatching injects high spatial frequency structure into the flats, it will complicate the NIRSpec calibration pipeline which interpolates flats for any frequency using a library of 20 reference flats. For NIRSpec, we were in the fortunate position of having several good SCAs to choose from. We therefore chose the two that are likely to be easiest to calibrate.
3. Quantum Yield
When short wavelength, high energy photons interact with the HgCdTe, they can create more than one electron-hole pair per incident photon. The quantum yield, Φ, increases the RQE,

but it also adds Fano noise (Fano 1947). The combined effect of the boosted response and added Fano noise is to reduce the sensitivity compared to a detector that has Φ = 1 and no Fano noise. For both detector characterization and scientific observations, it is therefore important to know when the quantum yield exceeds unity and account for it.7
To infer Φ(λ), we asked Teledyne to provide their theoretical AR coating model for our SCAs, T(λ). This took the form of a table that gave the predicted transmission as a function of wavelength from 400–6000 nm at 5 nm intervals. Teledyne also provided AR coating witness samples for each SCA, but we found that the theoretical AR coating always gave lower chi-square when fitted to our data. To infer Φ(λ), we fitted T(λ) to the RQE data from all eight 5 μm cutoff NIRSpec H2RGs.
Our RQE model was,

where

Equation (3) is based on the work of Shockley (1961), and in particular it approximates the behavior shown in his Figures 3–4 to first order in Eγ. One could include higher order terms once the quantum yield turns on. For this study, however, we opted to use the simplest possible linear model. In equations (2)–(3), α is the threshold energy as a fraction of the bandgap energy Eg, β is the slope of the quantum yield after it turns on in units of eV-1, η is the "internal QE", and κ is a wavelength scale factor. κ is needed as a free parameter because Teledyne's anti-reflection coating model is for a different temperature than NIRSpec's T ∼ 40 K SCA operating temperature and we expect the AR coating transmission function to shift in wavelength with temperature. Although we refer to η as "internal QE", one should bear in mind that any spectrally featureless reduction in the QE (e.g., an imperfect AR coating) would be accounted for by η. Substituting equation (3) into equation (2), we arrive at the four-parameter expression that we fitted to the data,

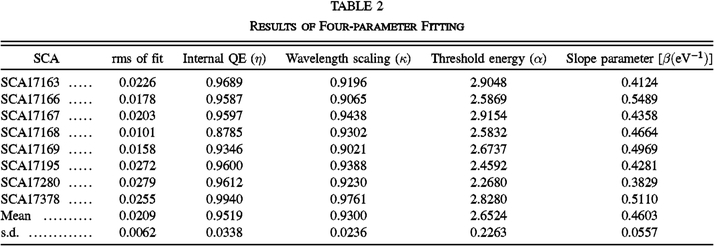
The fits were simple four-parameter least squares fits. The mean values across all eight SCAs for the fitted parameters are; α = 2.65 ± .2, β = 0.460 ± .06 eV-1, η = 0.952 ± .03, and κ = 0.930 ± .02. Figure 6 shows the fits for the two flight SCAs, and Table 2 shows the fit parameters for every SCA. Figure 7 shows our quantum yield results in the context of the work of McCullough et al. (2008) and results for a few other semiconductors from the literature.
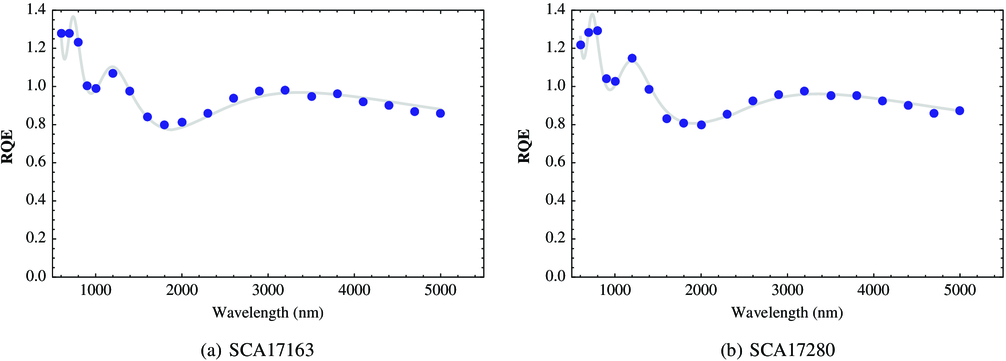
Fig. 6. To infer the quantum yield vs. wavelength, Φ(λ), we fitted eq. (4) to eight NIRSpec flight candidate SCAs. Here we show the fits for the two parts that were selected for flight. The fits for the other six SCAs are similar. The effect of the quantum yield is obvious for wavelengths shorter than 1400 nm, where the RQE usually exceeds 100%. Fig. 4 shows the quantum efficiency, QE, after correcting for quantum yield. As in Fig. 4, there is about a ± 6% correlated uncertainty on all data points. The statistical error bars are about 2.5%.
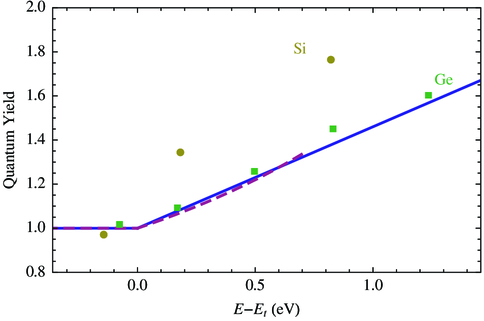
Fig. 7. This plot shows (solid blue) the quantum yield that we infer and (dashed purple) the quantum yield from McCullough et al. (2008). To provide context, we overlay data for Si and Ge from Shockley (1961) and references therein. For the range of photon energies over which both studies claim validity, our results agree with McCullough et al. to within 2%. For photon energies E - Et > 0.7 eV, the results reported here do not diverge greatly from the type of behavior exhibited by Si and Ge. As discussed in the text, one could probably use a higher-order model to allow for some curvature in the quantum yield curve if desired.
 |
McCullough et al. measured a threshold energy of Et = 0.65 ± .06 eV using an older 5 μm cutoff NIRSpec H2RG that we provided. This corresponds to α ∼ 2.9 ± .3. Here we have used a different but complementary method to infer α = 2.65 ± .2. Moreover, our quantum yield results agree with McCullough et al.'s to within < 2% for all wavelengths over which the two studies claim to be valid.
Based on the goodness of the fits and reasonable comparisons to other measurements in the literature, we believe that the average quantum yield parameters reported here are reasonable for 5 μm cutoff HgCdTe. We therefore use the inferred average values of α = 2.65 ± .2 and β = 0.460 ± .06 eV-1 in all other sections of this paper.
4. Summary
In this article, we report the measured performance of the two JWST NIRSpec flight SCAs. These SCAs supersede any others that may have previously been designated "flight" parts. The measured performance as shown in Tab. 1 generally meets NIRSpec requirements, and we believe represents today's state of the art for Teledyne's 5 μm cutoff H2RGs. Of the eight SCAs that passed Teledyne's coarse "screen testing", two were deemed "flight" grade, another two were nearly as good, and three others would certainly be desirable in a less demanding application than the JWST NIRSpec. Only one of the eight parts that passed the "screen test" clearly had a problem. For this one part, the persistence failed to meet requirements.
As part of characterizing the new SCAs, we measured the quantum yield of Teledyne's 5 μm cutoff HgCdTe. Reassuringly, our results were within 2% of McCullough et al. (2008)'s over the full range of wavelength for which both studies claim to be valid. Moreover, for the shortest wavelengths, where McCullough et al.'s model does not apply, our results are consistent with the known behavior of other semiconductors all the way down to the shortest NIRSpec wavelength of 600 nm.
This work was supported by NASA as part of the James Webb Space Telescope Project. We are very grateful to John Auyeung, who manages JWST work at Teledyne, and to Eric Piquette, our HgCdTe lead at Teledyne. Both did a fantastic job making the new detectors possible! We also wish to thank Drs. Mike Regan and Peter McCullough of the Space Telescope Science Institute (STScI), both of whom read the manuscript and provided valuable feedback.
Appendix A:: Nist Traceable Absolute Quantum Efficiency
Here we describe the DCL's absolute QE calibration, which was recently upgraded to be NIST traceable. The purple dewar uses two NIST-traceable Judson J10D-FP600765 InSb photodiodes for absolute QE calibration. Figure 8 shows a block diagram of the purple dewar when it is configured for QE measurements. One InSb diode is permanently mounted in the integrating sphere, where it continuously monitors the intensity of the incoming light. The second is mounted in a "mule" FPA that does not contain any H2RGs, but otherwise mimics a real FPA in terms of its scattered light properties. To compute the dewar transfer function, we remove the real FPA and install the "mule" so that the InSb diode lies at the location of the SCA's HgCdTe surface. Using the two photodiodes, we compute the attenuation from the integrating sphere to InSb diode. We use the measured illumination pattern of the integrating sphere at the FPA location to propagate this to all pixel locations. Once this transfer function is known, only the InSb diode in the integrating sphere is needed to make the QE measurement on a day to day basis.
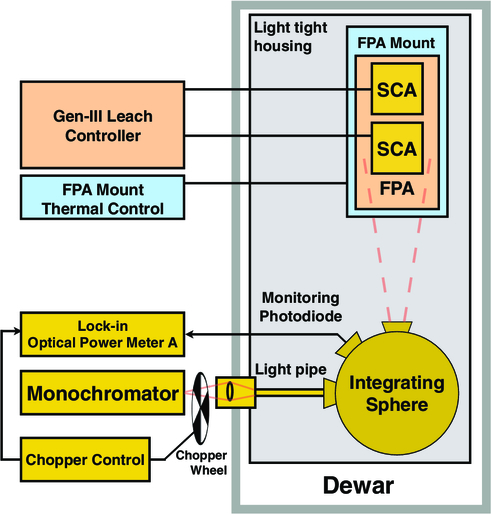
Fig. 8. Purple dewar configured to use external illumination from a monochromator. The first cryogenic element that the light encounters is the lens at the entrance to the light pipe. We control the SCAs using a Gen-III Leach controller from Astronomical Research Cameras, Inc. We use a LakeShore Model 340 temperature controller for thermal control. As is described in the text, two InSb reference diodes are used to make the measurement (only one of which is shown here). One (shown) is permanently mounted in the integrating sphere. This is used to monitor the source intensity continuously. The second can be installed at the focal plane location, where it is used occasionally to compute the transfer function from the integrating sphere to all positions in the focal plane. Once the transfer function is known, only the reference diode in the integrating sphere is needed to make the measurement.
The DCL's InSb diode calibration is described in detail in a report that NIST delivered to the DCL. NIST's methodology is described in Podobedov et al. (2012). In practice, the DCL diodes are tertiary standards. The primary standard is NIST's absolute cryogenic radiometer. The NIST team used this to calibrate two "cryogenic working standard" diodes of type J10D-M210S-R07M (NIST Standards #4 and #1). NIST then calibrated the DCL diodes against these using the substitution method. According to NIST, the k = 1 (1-σ; see Taylor & Kuyatt [1994]) uncertainty in the DCL reference diode calibration is ± 1.5%. At DCL system level, we believe that the uncertainty is < ± 6%.
The purple dewar can be configured for either external illumination using a monochromator or internal illumination for ultimate dark performance. The QE measurements were made using the external configuration as shown in Figure 8. There is a cryogenic shutter on the integrating sphere input port that can be close to change to the internally illuminated configuration.
Appendix B:: H2rg Operating Conditions
Several JWST affiliated groups (e.g., Teledyne, University of Hawaii, University of Arizona, STScI) including the DCL have conducted trade studies to find the optimal JWST H2RG operating conditions. Based on these, we concluded that for NIRSpec's 5 μm cutoff HgCdTe H2RGs, the optimal temperature is about T = 38.5 K and the scientific performance degrades only slowly for temperatures up to about T < 46 K.
Of all performance parameters, the one that appears to fall off most rapidly with increasing temperature is pixel operability. On average, the hot pixel percentage of JWST's 5 μm cutoff HgCdTe H2RGs doubles roughly every 6 K for temperatures near this optimum. Temperature stability is also very important. We therefore actively control the temperature of NIRSpec's H2RGs to δT < 1 mK on the timescale of a test which is a few weeks.
All of the testing that we report here was done using a Gen-III "Leach controller" by Astronomical Research Cameras Inc. for H2RG control. The Leach controller's video bandwidth is set by a simple RC filter to about 160 kHz. We clock the H2RGs at a pixel rate of 100 kHz per output and use four video outputs. Table 3 lists the bias voltages that we used.
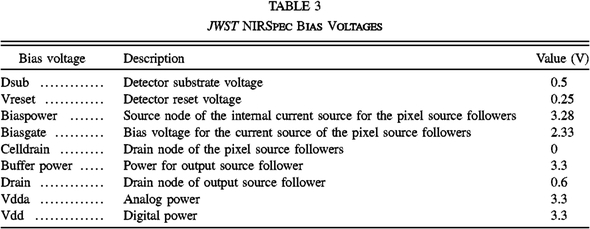 |
The Leach controller's video gain is about 20×. The 16 bit analog to digital converters have a 5 V range, resulting in a video gain of about 0.262 ± .03 DNμV-1 referenced to the video input. With a mean 5 μm cutoff H2RG transimpedance gain of 4.14 μV e-, this produces a conversion gain of approximately 0.92 e- DN-1. The measured transimpedance and conversion gains for all parts are shown in Table 1.
Footnotes
- 5
The JWST NIRSpec detector subsystem requirements are formally defined in a series of JWST project documents. Although these documents describe exactly what is needed, they are often not comprehensible without reading other JWST project documents. For the sake of brevity, we therefore use the word "requirement" informally in this manuscript. The relevant JWST project document always takes precedence.
- 6
When the SIDECAR ASIC is used for SCA control, the frame time goes up slightly, but in any case the frame time will be shown in the FITS header.
- 7
As part of characterizing the full NIRSpec detector subsystem, we will measure the Fano noise of these detectors. Our expectation is that the Fano noise will be small, except possibly near the shortest NIRSpec wavelength of 600 nm. However, until those measurements are available, we refer the interested reader to Sec. 8 of McCullough et al. (2008) for more information on Fano noise.