
ABSTRACT
The nulling coronagraph, first proposed by Roddier and Roddier, uses a small mask (less than half the size of the central Airy spot) that shifts the phase of the incoming light by 180° to strongly attenuate the Airy spot as well as the rings. We report on both theoretical and laboratory performance. In our laboratory experiment, we reduce the peak intensity of the Airy pattern by a factor of 16. We derive estimates of the performance of a nulling coronagraph used on a telescope equipped with an adaptive optics system, based upon the performance of the University of Hawaii Hokupa'a adaptive optics system. On a 3.6 m telescope at 1.65 μm, it is found that a tip/tilt amplitude lower than 20 mas is needed for such a coronagraph to yield an extinction better than 2 stellar mag.
Export citation and abstract BibTeX RIS
1. INTRODUCTION
Direct imaging of light sources close to bright unresolved objects is of great scientific importance. Such observations require both a high angular resolution and a high dynamical range. Interesting science applications include the direct observation of host galaxies around quasars, accretion disks and young stellar environments, low‐mass stellar companions, and the detection of dust shells around asymptotic giant branch(AGB) and post‐AGB stars. In the solar system, satellites of asteroids can be imaged (e.g., Merline et al. 1999).
Detection of faint light sources near bright stars is limited by atmospheric turbulence, light scattering by the optics of the instrument, and Fraunhofer diffraction of the incoming wave front by the entrance pupil. Light scattering by the optics can be decreased by using very fine polished optical elements, and the effect of atmospheric turbulence can be minimized by using adaptive optics (AO) systems. The coronagraph is intended to block the light of the bright star and reduce the amount of diffracted light from the occulted star in the focal plane.
The first coronagraph was built by B. Lyot to image the solar corona (Lyot 1939). The same design was later used on stars. Although this technique led to interesting results such as the discovery of the circumstellar disk around β Pictoris (Smith & Terrile 1984), atmospheric turbulence prevented the mask from getting smaller than a few arcseconds. More recently, the Lyot coronagraph has been improved by using apodized masks and by taking advantage of the sharper point‐spread functions (PSFs) delivered by AO systems. The use of a tip/tilt system with a stellar coronagraph allowed the use of smaller occulting masks (Golimowski et al. 1992; Walker et al. 1994). Stellar coronagraphy with an AO system is even more efficient and was first demonstrated by F. Malbet on the 3.6 m ESO telescope and the COME‐ON AO system (Malbet 1996). Using apodized masks improves the performance of the Lyot coronagraph by preventing the sharp mask's edge from diffracting a lot of light, especially when the occulting mask (in the focal plane) is small (Ftaclas 1995). However, the occulting mask cannot be too small because the Lyot stop aperture (in the pupil plane) has then to become small too. The nulling coronagraph, first proposed by Roddier & Roddier (1997), can use a small mask without suffering from the same limitations.
2. HOW THE NULLING CORONAGRAPH WORKS
2.1. Overview of the Lyot and the Nulling Coronagraphs
To understand how the nulling coronagraph works, one can compare it with a Lyot coronagraph. Figure 1 compares the two coronagraphs. The Lyot coronagraph, developed by Lyot for solar corona imaging (Lyot 1939), is the most common coronagraph used in astronomy. In this paper, we will consider stellar coronagraphs only. The Lyot stellar coronagraph uses an opaque mask in the image plane to remove almost all the light of the star (only the Airy rings outside the mask are still present). The mask is usually at least three Airy rings wide. Of course, at this point, no improvement has been made yet on the detection of faint light sources near the star, which is the purpose of a coronagraph.
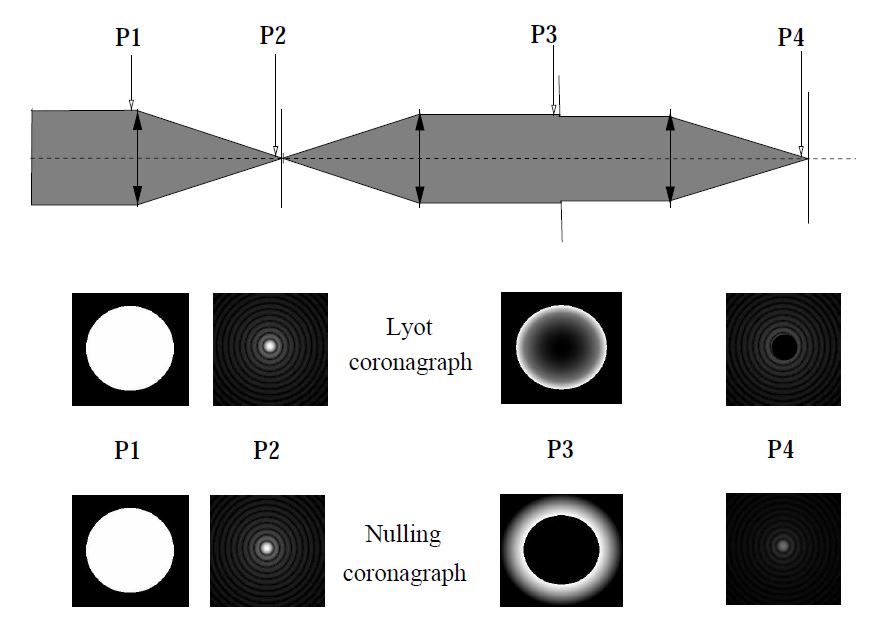
Fig. 1.— The Lyot coronagraph uses an opaque mask in the image plane, whereas the nulling coronagraph uses a phase mask. Light distribution in the pupil is very different for the two coronagraphs. For the Lyot coronagraph the light is concentrated inside the pupil near the edge. For the phase mask it is moved outside the pupil. This figure shows the light distribution in four different planes for both coronagraphs. Plane P1 is the entrance pupil plane; plane P2 is the focal plane, where the occulting (or phase) mask is; plane P3 is the second pupil plane, where the "Lyot" stop is; and plane P4 is the second focal plane.
To understand how the Lyot coronagraph works, the image of the star in the image plane has to be seen as being the power spectrum of the pupil complex amplitude (a uniformly bright disk). The opaque mask on the central part of the Airy pattern removes the low‐frequency components of the Fourier transform of the pupil complex amplitude. Hence, putting an opaque mask on the center of the Airy pattern increases the relative intensity of the edges of the pupil in comparison to the center (the edges of the pupil are diffracting the light away from the central part of the Airy spot).
The use of a stop in the second pupil plane (after the mask) can suppress the light contribution from the edge of the pupil to the final image. Hence, the Airy rings that were still present in the first image plane, outside the mask, are attenuated. The final image of the occulted star will be a dark disk (the mask) surrounded by very faint diffraction rings. If a light source is far enough from the star so that its image is outside the mask, its light distribution in the second pupil plane will be a uniformly bright disk of light and the pupil stop will remove only a small fraction of its light. The offset light source will then be attenuated by a factor which is far lower than the attenuation of the Airy rings of the central occulted star, making it easier to detect.
The nulling coronagraph works differently. The mask is not opaque: it is a phase mask which shifts the phase of the light by 180°. When the phase mask has the right size, destructive interference occurs inside the pupil and the light from the star is sent outside the pupil in the second pupil plane (see Fig. 1). The nulling coronagraph is not the only way to use destructive interference on a star in order to image faint light sources very close to it. The achromatic interferometric coronagraph (Gay 1996) can cancel out efficiently the light from the star, but the true image is superposed with its 180° rotation around the optical axis. Multiaperture nulling techniques also exist (e.g., Bracewell 1978; Leger & Mariotti 1996; Angel & Woolf 1997) and can yield better angular resolutions, thanks to large baselines. But their incomplete sampling in the Fourier plane has to be overcome (high number of apertures and/or variable baseline geometry) before they can offer high dynamical range direct imaging capabilities.
Because a simple phase mask has a wavelength‐dependent phase shift and because the Airy spot size is wavelength‐dependent too, the nulling coronagraph cannot work over a wide wavelength range at once.
2.2. Theoretical Aspects
The light amplitude distribution in the focal and pupil planes is plotted in Figure 2, which shows the effect of the phase mask in the pupil plane. Because the phase mask shifts the phase of the light by 180°, it induces interference between the light that passes through it and the light that passes around it. The light passing through the mask forms a narrow peak in the image plane, no bigger than the size of the mask itself. The Fourier transform of the narrow peak is a broad peak which describes the light amplitude distribution in the pupil plane. It is represented as being of negative value in Figure 2 because the light phase has been shifted by 180°. The light amplitude distribution in the pupil arising from the light that does not pass through the phase mask is then the normal uniformly bright disk (Fourier transform of the Airy pattern) minus this broad peak. When the two light amplitude distributions (inside+outside) are added together (along with their sign to take account of the interference) the inside of the pupil is even further lowered (in the same representation) and the outside has negative values. The square of this curve gives the light distribution intensity in the pupil, and it appears that by choosing the right value for the phase mask size, the light can be canceled inside the pupil. This theoretical optimum diameter is 43% of the first dark ring in the Airy pattern. Then, destructive interference occurs in the pupil while constructive interference puts the light outside the pupil.
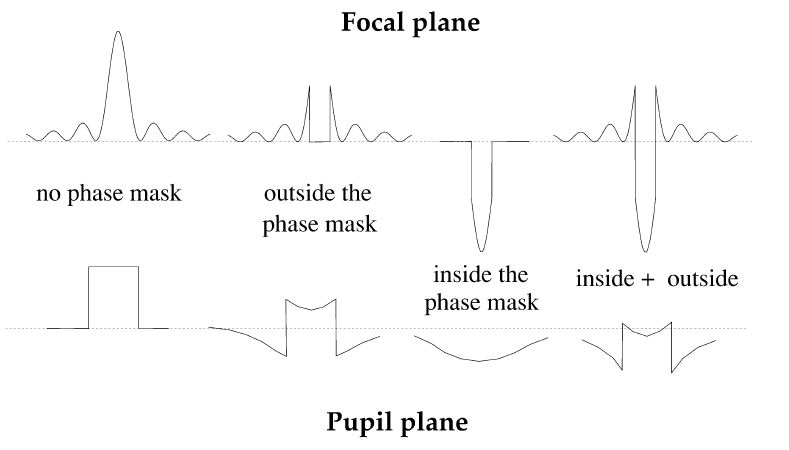
Fig. 2.— The effect of the phase mask in the pupil plane. The top row represents light amplitude distribution in the image plane, and the bottom row is the corresponding light amplitude distribution in the pupil plane, which is the Fourier transform of the top row curves. By choosing the right size for the phase mask, the sum of the two lower right curves (pupil light distribution for the light that passes inside and outside the mask) can be brought close to zero (dotted line) inside the pupil: this is the correct size for the phase mask. This then leads to the light distribution in the pupil shown in Fig. 3.
3. THE NULLING CORONAGRAPH EXPERIMENT
3.1. The Fabrication of the Phase Mask
The phase mask was made at the University of Mexico by a close collaboration between two laboratories: the Microwave Laboratory, at Centro de Instrumentos, and the Detectors Laboratory, at the Instituto de Astronomia. The photolithography work was done at the Microwave Laboratory and thin‐layer deposition at the Detectors Laboratory. The thickness of the mask is given by the relation
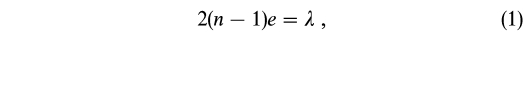
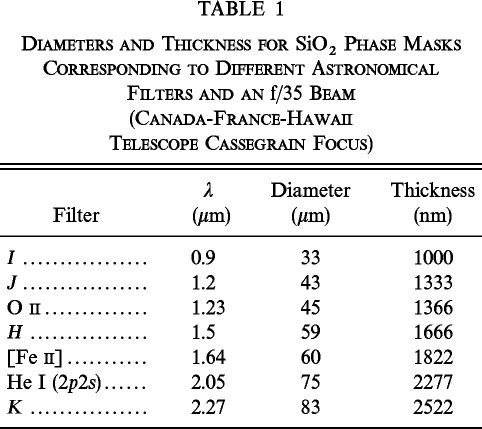
where n is the refraction index and λ the wavelength of the light, in this case He‐Ne laser light. The diameter of the mask is 0.43 times the size of the Airy spot corresponding to the wavelength and the f/ number of the optical system. In Table 1 diameters and thickness of the mask for different usual filters are indicated. The mask for this first laboratory experiment was made by a deposition of SiO2 on glass and for He‐Ne laser light. The mask thickness was 700 ± 1 nm.
 |
The fabrication steps are the following:
- 1.Copper film deposition made over a substrate.
- 2.Deposition of a photosensitive resin layer.
- 3.Ultraviolet illumination of the resin layer through a photographically generated mask. In this case, the mask was a disk.
- 4.Chemical removal of the copper layer over the hole.
- 5.Sputtering deposition of SiO2 over the hole.
- 6.Chemical removal of the SiO2 and copper excess.
3.2. Optical Setup
Several masks of different sizes, ranging from 1 mm to 100 μm, were available on the same glass plate. For our experiment, we chose to use only one of them (the 200 μm diameter mask), so that the optical alignment would not have to be done too often. Instead of changing the size of the mask, we changed the size of the pupil, hence modifying the size of the Airy spot. Our Airy spot was created using an He‐Ne laser and a beam expander. The parallel light beam was then focused using a lens. The Airy pattern at the image plane was very sharp, thanks to the monochromatic laser light, and numerous Airy rings could be seen on the images.
The optical layout of the experiment is shown in Figure 3. The phase mask was mounted on an x,y stage. Because of the very long focal length (5 m for a pupil smaller than 2 cm at maximum extinction) of the beam, the position of the phase mask along the optical axis was not critical. A single CCD camera (1024 × 1024 CCD chip) was used to record both image plane images and pupil images. Swapping from the image plane to the pupil plane was done by sliding a lens (L6) in the optical train. A second iris was used as the pupil stop (the equivalent of the Lyot stop in the Lyot coronagraph, this stop being also referred as a Lyot stop in this paper). We chose to have this iris opened at 90% of the pupil size for each image we took. Each measurement was done with a different pupil size. After having set the pupil size, a first image of the pupil was taken to measure the size of the pupil on the CCD image. This was done by moving the phase mask out of the way, opening the Lyot pupil stop iris (to see the actual pupil), and sliding in the lens to image the pupil. Then, the phase mask was carefully centered by looking at the pupil image while moving the mask and a second pupil image was taken (mask in). The Lyot pupil stop iris was then closed to 90% of the pupil aperture and a third image was taken at the pupil plane. Finally the last two images taken were in the image plane: phase mask in and phase mask out. The measurements presented below have been obtained by using this set of images.
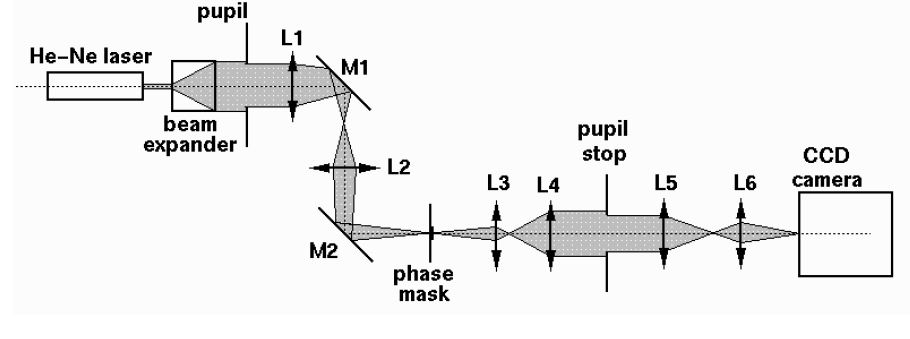
Fig. 3.— General optical layout of the nulling coronagraph experiment. The pupil is an iris, and its size can be chosen to maximize the efficiency of the nulling coronagraph for a given phase mask diameter. Lens L6 can be removed to image the pupil plane on the CCD.
3.3. Laboratory Measurements
Being able to acquire an image in both the pupil plane and the image plane allowed us to check that the nulling coronagraph performs well according to the theory. By changing the pupil size it was possible to draw a curve of the PSF's center intensity attenuation versus the phase mask size relative to the first Airy dark ring size of the Airy pattern. This curve fits well with the theoretical curve (see Fig. 4), and the maximum PSF peak extinction position is very close to the predicted pupil size value. However, it was impossible to reach the theoretical attenuation (a factor of 550 for a phase mask 43% as big as the Airy spot) because of the imperfect thickness profile of the phase mask we used: when the phase mask was put in one arm of a Michelson interferometer, the fringes showed that the mask thickness was maximum at the center.
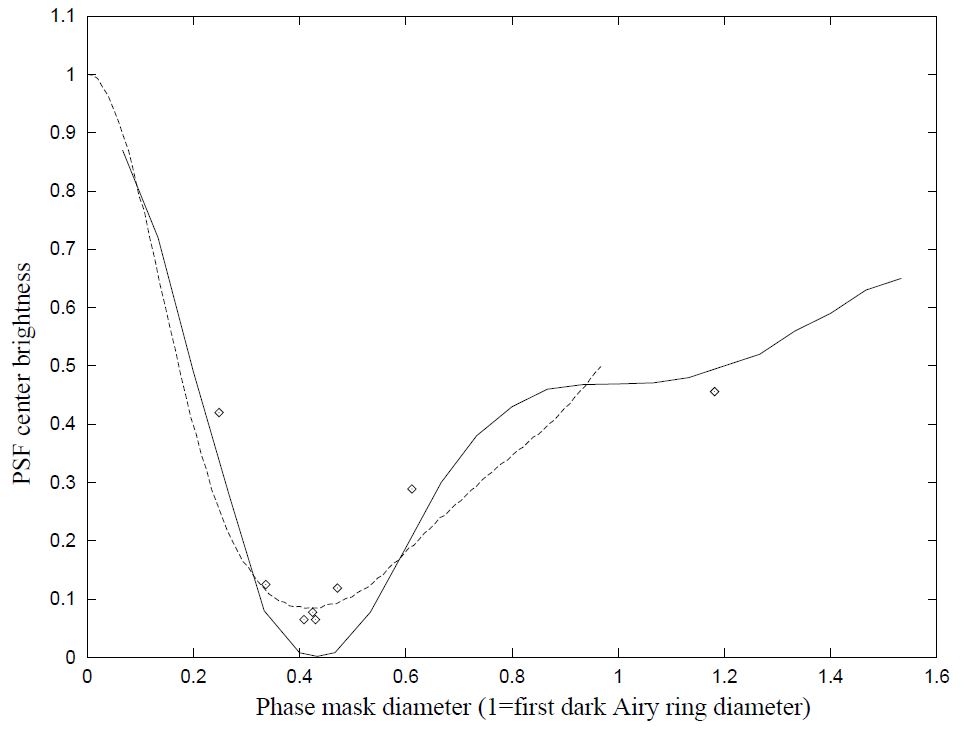
Fig. 4.— The PSF's center brightness for different diameters of the phase mask. The brightness is normalized to the brightness of the PSF's center when the phase mask has been removed. The unit for the phase mask diameter is the diameter of the first dark ring of the Airy pattern. The solid curve is the theoretical curve for a perfect mask, the dashed line is the theoretical curve obtained with a phase mask having the thickness profile plotted in Fig. 8, and the dots correspond to points obtained with the optical setup described earlier. Because of the imperfect thickness profile of the phase mask, the deep theoretical minimum has not been reached, but the overall shape of the theoretical curves matches very well the values obtained in the experiment. The last point (mask diameter = 1.2) was obtained with a larger mask.
The theory predicts that the first dark Airy ring disappears when maximum extinction is achieved (Fig. 5), when the phase mask diameter is 0.43 times the first dark Airy ring diameter (0 23 on a 3.6 m telescope at 1.65 μm). Our images (Fig. 6) do not show this phenomenon because this theoretical maximum efficiency point was not reached due to an imperfect phase mask. Figure 6 shows the image of our artificial star when extinction is maximum. The maximum attenuation we could reach was a factor of 16 (3 stellar mag), as shown in Figure 7.
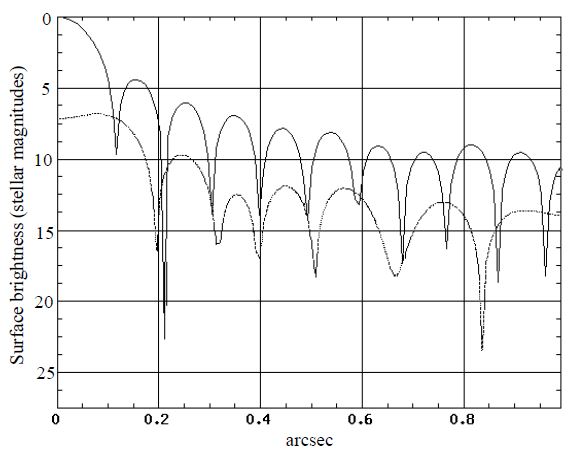
Fig. 5.— Theoretical PSF profiles in stellar magnitudes with no nulling coronagraph (upper curve) and with nulling coronagraph at maximum extinction (lower curve) for a 3.6 m telescope at 1.65 μm. Distance from the center of the PSF is in arcseconds.
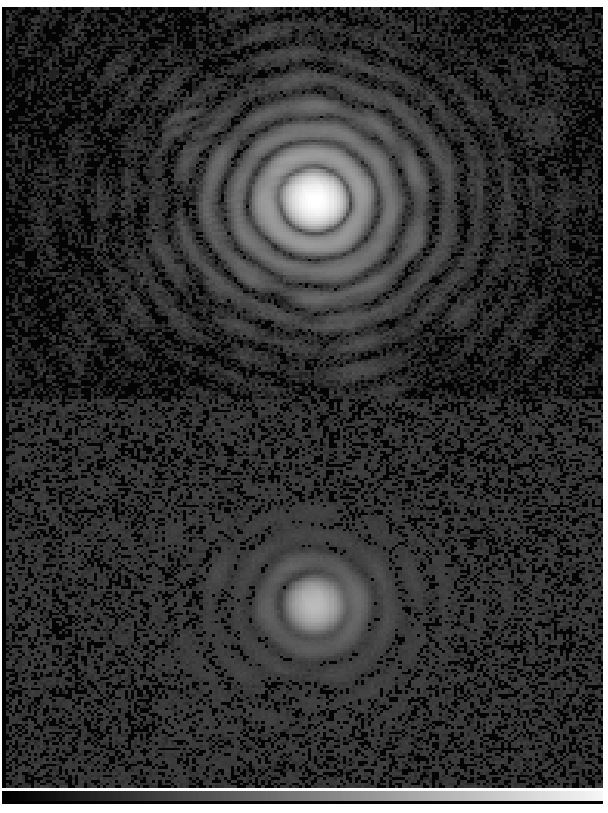
Fig. 6.— The top image was taken with the phase mask out of the way and the bottom one with the phase mask in. The nulling coronagraph can attenuate both the central Airy spot and the rings as demonstrated here. Brightness scale is not linear in this image.
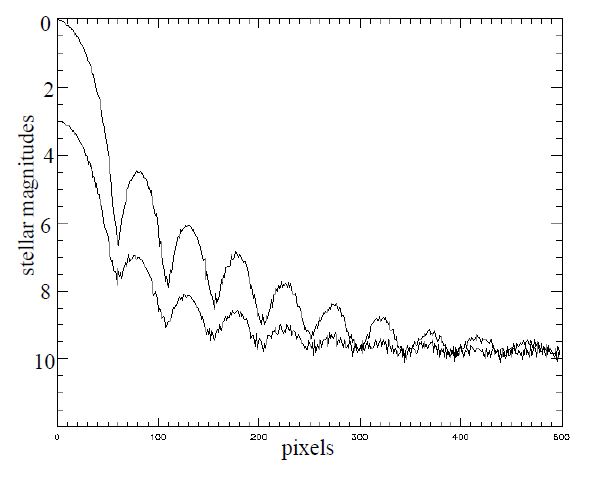
Fig. 7.— Light profile of the two images of Fig. 6. The peak intensity of the PSF is lowered by about 3 mag (a factor of 16) by the nulling coronagraph. The light profile is given in stellar magnitudes per unit of area, the zero reference being the central brightness of the PSF obtained without the phase mask. The distance from the center of the PSF is given in pixels on the actual CCD image.
However, the extinction curve obtained in the experiment has been reproduced by computer simulation with a mask of uneven thickness. A mask with rounded edges (thinner at its edges) but of the right central thickness produced an extinction curve very close to the one obtained in the experiment. The mask was then put in a Michelson interferometer, and the interference fringes showed that the thickness profile of our mask was close to the simulated profile. Figure 8 shows the thickness profile of the mask we used in our simulations to reproduce the results obtained in our experiment. The simulated light profile (Fig. 9) is in good agreement with the light profile measured in our experiment. The light intensity distribution obtained in the experiment is well reproduced by the computer simulation for the central Airy spot and the first Airy ring. The two curves do not match after the second Airy ring because the light intensity is then below 1 ADU on the CCD image and the diffused light background dominates the image.
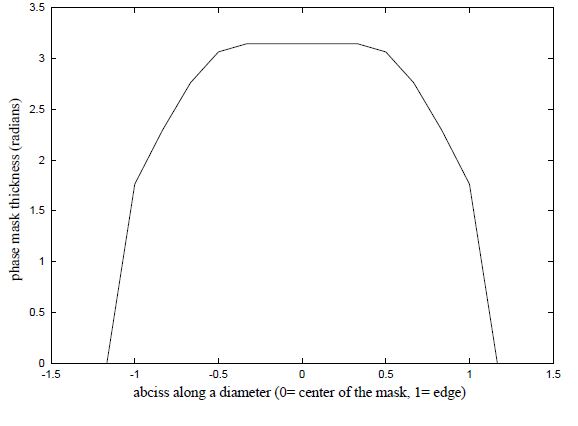
Fig. 8.— Simulated thickness profile of our experimental phase mask. This profile has been chosen to fit the results of our experiment, as shown in Fig. 9. It is also in good agreement with the observation of the thickness profile of the mask we have carried out by inserting the mask in one arm of a Michelson interferometer, which showed that the mask had "bent" edges. The phase is in radians (thus peaking at π), and the distance from the center of the mask is in mask radius units.
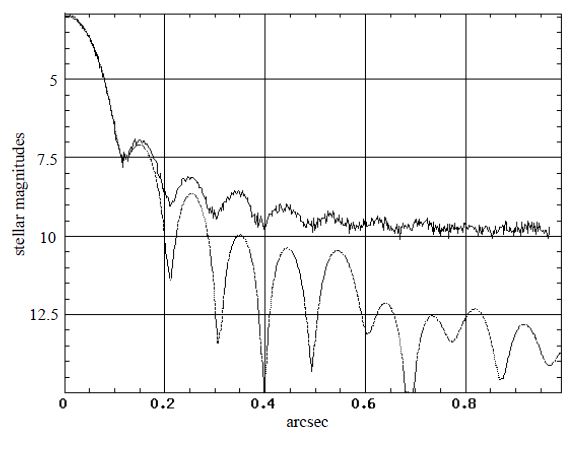
Fig. 9.— The top curve is the "best extinction" light profile obtained in our experiment, and the lower curve is the simulated light profile using the phase mask thickness profile of Fig. 8. Because the true data had limited dynamical range, the profile is dominated by noise and diffused light after the third Airy ring. The brightness scale is in stellar magnitudes, and the distance from the center of the PSF is in arcseconds. The simulated curve assumes a 3.6 m telescope working at 1.65 μm, and the real data have been scaled to the same focal plane scale.
The pupil plane images show very well how the phase mask induces destructive interference inside the pupil while putting the light outside the pupil (see Fig. 10). The pupil size is a very critical adjustment to reach maximum extinction. It would have been even more critical with a better mask, with which the maximum extinction would have been greater.
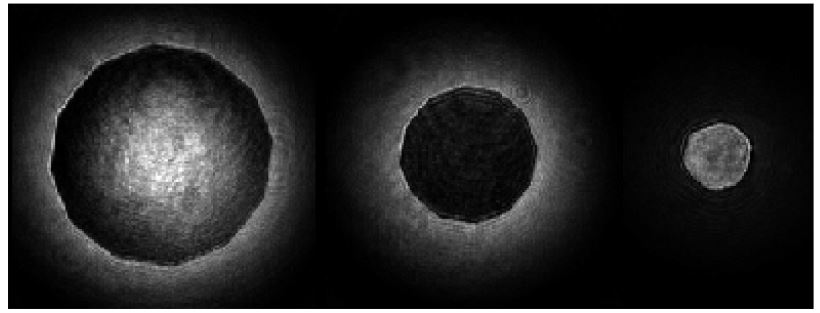
Fig. 10.— This set of three pupil images shows the effect of the pupil size (same phase mask size) on the pupil plane light distribution. If the pupil is too large (left), or the phase mask is too large, the light inside the pupil is not cancelled out very well, but part of the light is put outside the pupil edge. When the pupil size is optimum (middle), very little light remains inside the pupil. If the pupil is too small (right), the Airy spot is bigger and the phase mask is too small to have a significant effect on the light distribution in the pupil.
4. THE NULLING CORONAGRAPH AT THE TELESCOPE
4.1. Using the Nulling Coronagraph with an AO System
Because the phase mask in the nulling coronagraph is only 43% the size of the first dark Airy ring, its use is limited to astronomical instruments yielding sharp and steady PSFs: as related in § 4.2, our tip/tilt simulations suggest that a Strehl ratio higher than 0.9 is needed to achieve an extinction better than 2 mag. A simulation predicting the performance of the nulling coronagraph on the Hubble Space Telescope, taking into account the residual aberrations of its 2.4 m primary mirror, has been done by Roddier & Roddier (1997). On a large telescope without AO, the phase mask would be inefficient since atmospheric turbulence would spread the light over an area far bigger that the Airy spot size and the turbulence‐induced image motion would move the star over great distances in the image plane. Hence, the phase mask can only be used on a space telescope or on a ground‐based telescope equipped with a high‐compensation AO system.
Figure 11 shows how AO can efficiently reduce the brightness of the PSF between 007 and 1
'' on a 3.6 m telescope in H band (1.65 μm). On such a telescope, the diffraction rings are responsible for most of the light found up to 1
'' away from the star. The scattering induced by the telescope optics is then the most important contribution at greater distances. That is why the use of a nulling coronagraph can be very efficient for faint light source detection in the first Airy rings of the PSF, where the Lyot coronagraph cannot be of any help because the Lyot mask usually covers the first three or four Airy rings. Using a nulling coronagraph on a telescope requires very fine optical alignment since the phase mask is smaller than the Airy spot size. The use of narrowband filters might be useful to avoid decreasing the performance of the coronagraph which works best for monochromatic light. The most important degradation of the performance of the nulling coronagraph might arise from residual tip/tilt: this is the subject of the following section.
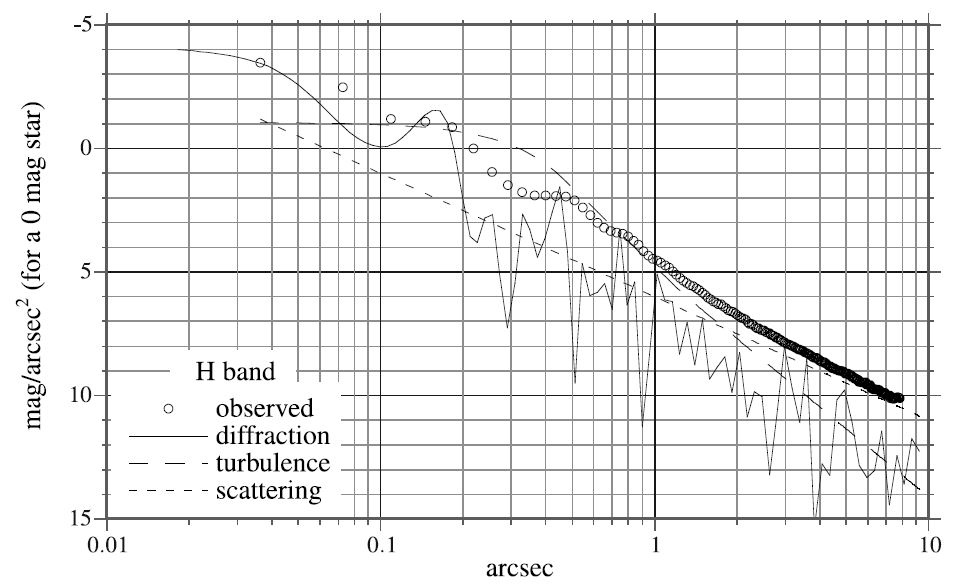
Fig. 11.— Different contributions to the radial brightness of a PSF on a 3.6 m telescope in H band (1.65 μm). The brightness profile of a PSF obtained with the Hokupa'a AO system is plotted on this graph.
4.2. Tip/Tilt Error and the Nulling Coronagraph
Using computer simulations, it is possible to create PSFs obtained by offsetting the image of the star on the phase mask. Then, if we assume that the turbulence is moving the star in the image plane with a Gaussian probability density (which is a good approximation), we can simulate the effect of image residual motion for the nulling coronagraph.
The results of the computer simulations for a 3.6 m telescope at a wavelength of 1.65 μm are shown in Figure 12. The effect of tip/tilt residual error seems to be very important. On Hokupa'a (the University of Hawaii's AO system), the tip/tilt error is thought to be around 15 mas for bright stars. A 5 mas tip/tilt error (0.993 Strehl ratio) already produces a dark spot in the middle with a brighter ring around. However, it has little effect on the PSF wings: the dark diffraction rings are slightly brighter, but there is no significant brightening of the bright diffraction rings. However, with a 10 mas tip/tilt error (0.973 Strehl ratio), the dark diffraction rings disappear, and the brightening of the central part of the PSF, just outside the phase mask, is about 1 mag. A 20 mas tip/tilt error (0.899 Strehl ratio) yields a PSF in which the dark diffraction rings have been replaced by bright rings. When the star is on the border of the phase mask, the PSF is highly asymmetrical, showing bright diffraction arcs in the direction away from the center of the mask. This is why a 20 mas tip/tilt error, by radial integration of those bright arcs, yields such a PSF. Then, the new bright rings are about 1.5 mag brighter than the diffraction rings obtained without any tip/tilt error.
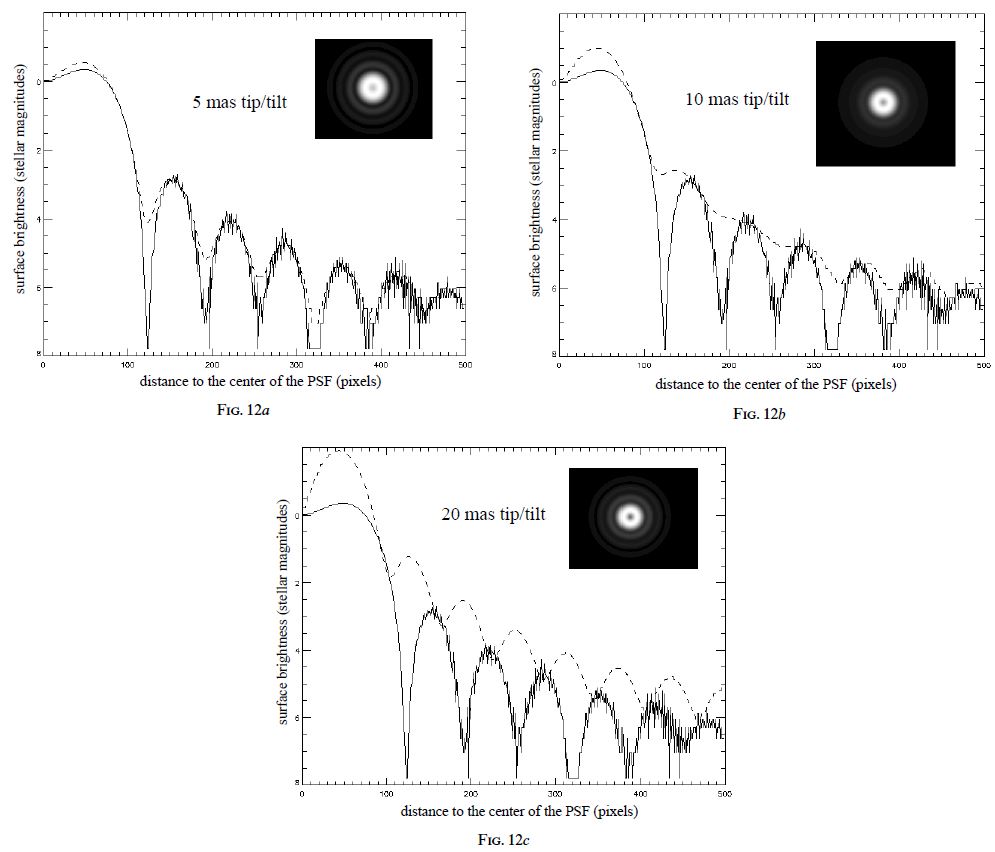
Fig. 12.— Theoretical PSF(s) obtained for a 3.6 m telescope at 1.65 μm using the nulling coronagraph with a residual tip/tilt of (a) 5 mas, (b) 10 mas, and (c) 20 mas corresponding to Strehl ratios of 0.993, 0.973, and 0.899, respectively. The solid curve is the PSF profile when no tip/tilt is present. The brightness scale is in stellar magnitudes. The distance from the PSF center is in pixels on the simulated images, with 1 mas corresponding to 0.64 pixels.
4.3. Chromatism
The use of the nulling coronagraph in broadband imaging encounters two problems. First, the mask itself does not induce the same phase shift at all wavelengths. The other problem is that the Airy spot size is wavelength‐dependent and the nulling coronagraph performs well only when the mask size is 43% the size of the first dark Airy ring. Allowing 1% of the light of the occulted star to pass through the coronagraph, the wavelength bandwidths, at 1.65 μm, for those two effects are 0.1 μm for the wavelength‐dependent phase shift effect and 0.22 μm for the Airy pattern wavelength‐dependent effect (Roddier & Roddier 1997). The bandwidth of a standard H filter being 0.3 μm, those effects are not negligible.
The first problem can be solved by using a more sophisticated phase mask, stacking layers of materials having opposite refraction index wavelength dependence. It is reasonable to think that such masks can be built to offer the same phase shift over the wavelength range of a common IR filter (H, J, or K filters, for example). Figure 13 shows that the Airy spot wavelength‐dependent size then limits the performance of the coronagraph. Close comparison of Figure 13 and Figure 5 shows that the central attenuation of the star is then about 5 mag: about 1% of the light of the star passes through the coronagraph, which is explained by the fact that the H filter bandwidth (0.3 μm) is close to the value of the bandwidth given above (0.22 μm). However, optical designs offering a wavelength‐dependent magnification and a wavelength‐independent focal plane exist and could be used to solve this problem.
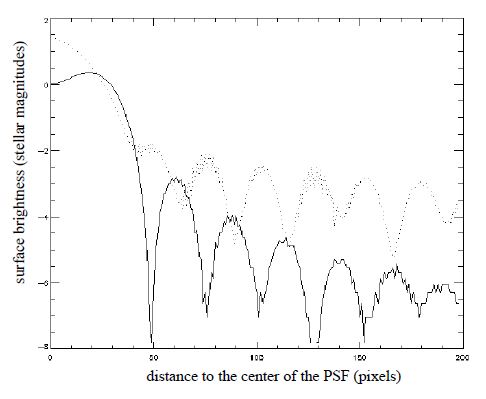
Fig. 13.— Theoretical PSF obtained on a 3.6 m telescope using the nulling coronagraph through an H filter (dotted line) having a 100% transmission from 1.5 to 1.8 μm. The phase mask is considered as perfectly achromatic (same phase shift for all wavelengths), but the Airy spot wavelength‐dependent size has been taken into account. The solid curve is the PSF obtained in monochromatic light (1.65 μm).
5. CONCLUSION
The nulling coronagraph experiment results were very well matched by computer simulations. The deep extinction maximum predicted by the simulation could not be reached in the experiment because of the imperfect thickness profile of our phase mask. However, computer simulations using an imperfect phase mask with bent edges match well the measurements obtained.
Those results give us confidence that a better phase mask can yield results very close to the theoretical simulations with a perfect mask. However, a good nulling coronagraph would be very sensitive to residual wave front errors. This makes it more easy to use this type of coronagraph in the infrared where the Airy disk is wider and where high compensation can be achieved with adaptive optics.
The use of such a coronagraph on a space telescope would not suffer from atmospheric turbulence, hence making it easier to use. The chromatism of such a coronagraph appears to limit its use in broadband imaging, but technological solutions exist to solve this problem.
The nulling coronagraph can also be used in an interferometric mode by densifying the entrance pupil (Labeyrie 1996) before using the phase mask. The pupil can then be rediluted to avoid the narrowing of the field of view. Simulations are being done and will be presented in a forthcoming paper.